In the field of Political Economy, workplace or occupation are viewed as some of the fundamental determinants of a wide range of individual political preferences such as preferences on free trade (Scheve and Slaughter, Reference Scheve and Slaughter2001), redistribution and labor market risk (Iversen and Soskice, Reference Iversen and Soskice2001; Kitschelt and Rehm, Reference Kitschelt and Rehm2014), or foreign investment (Scheve and Slaughter, Reference Scheve and Slaughter2004). After all, where people work and what they do is the main source of their livelihood. However, data on the workplace are virtually absent from research on individual campaign contributions, despite the long-running debate on whether donations are a quid pro quo investment in expectation of political favors or merely consumption (Ansolabehere et al., Reference Ansolabehere, de Figueiredo and Snyder2003; Gordon et al., Reference Gordon, Hafer and Landa2007).Footnote 1 If individuals were donating based on what is good for their employer, we would expect their donations to be strongly aligned with the political preferences of their company. However, observing both individual and employer political preferences at the same time is very difficult in practice.
In this paper, I create a measure of political alignment between firms and their employees based on novel data matching 1,691,790 federal campaign contribution filings of 85,109 individuals to the donations of 874 Political Action Committees (PACs) of publicly listed US companies, between 2003 and 2016. I leverage natural language processing tools to link individual donors to their company PAC, and use donations to Democratic and Republican candidates to measure partisan alignment between firms and their employees. I show that PAC- and employee donations are significantly correlated. Moreover, I demonstrate that firm-level and occupational characteristics are associated with firm–employee alignment in predictable ways. Contrary to existing datasets, these novel data can be easily linked to external datasets on industries, firms, and occupations. Thus, the data enable scholars to better study the connections between corporate and employee donations, or the impact of political change and economic shocks on individual contributions.
Whether individuals align with their employers has important implications for the study of corporate political mobilization, the formation of policy coalitions, and representation. More internally aligned firms might be more likely to mobilize politically due to lower costs of collective action (Olson, Reference Olson1965; Hansen et al., Reference Hansen, Mitchell and Drope2005). Since the corporate political strategy of firms is often determined by their senior management, common views might result in less frictions to arrive at common political positions. For the same reason, we might expect corporations with highly aligned employee preferences to be more likely lobby alone rather than in associations (Bombardini and Trebbi, Reference Bombardini and Trebbi2012), or to show greater unity in industry-wide associations like the American Chamber of Commerce, given that they decide to lobby via associations (Walker and Rea, Reference Walker and Rea2014). Finally, unequal distribution of preferences across firms and occupations might have severe consequences for unequal representation (Gilens and Page, Reference Gilens and Page2014). Scholars of money in politics should pay more attention to individual's workplace, their profession, and the activities of their employer when exploring motivations for political giving.
1. Linking firm and employee campaign donations
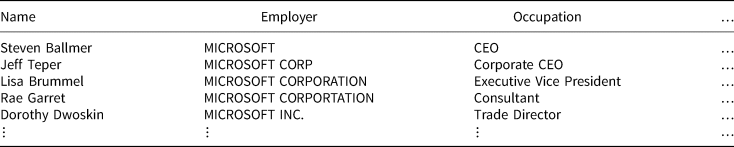
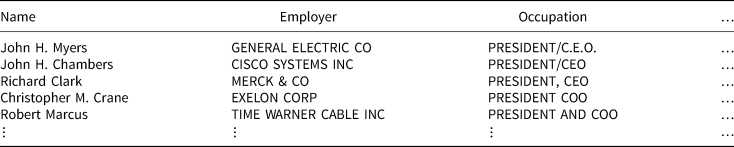
I match employee to corporate donations using US Campaign Finance data from the Federal Election Commission (FEC) on corporate PAC campaign contributions and individual donations to political candidates. The individual donations data contain information on donor names, employers, and occupation. However, linking employers in the individual data to firm-level, industry-level, and occupation-level information or PAC donations is challenging for two reasons. First, there are no unique employer names or identifiers. Rather, donors manually enter employer names into a form, resulting in vastly different firm names across individuals working for the same firm. This problem is shown in Table 1 which depicts political contributions of five MICROSOFT employees, each of which provides a slightly different (and sometimes, orthographically incorrect) employer name. The same problem exists for individual occupations. Table 2 shows the problematic structure of occupation names in the FEC data for five senior managers of well-known US companies. Second, the sheer amount of the data precludes attempts to manually match individuals to employers or manually categorize individual occupations. Between 1980 and 2018, the FEC data contain 52,974,196 itemized individual contributions, 4,085,773 unique employer names, and 825,697 unique occupation names.
Lack of unique employer names for individual campaign donations

Note: The table shows the lack of unique employer names in the FEC individual donations data. In this example, all individuals are employees of Microsoft, but they use different versions of the company name when filing their contribution to the FEC.
Lack of unique occupation names for individual campaign donations

Note: This table shows examples of different employees of five companies, all of which have a very similar jobs. However, all individuals provide very different occupation names when filing their contributions to the FEC.
Therefore, I need an automated way to match employer names to unique company identifiers and occupation names to unique occupation identifiers. I developed an automated script, written in the programming language Python, leveraging Python's computationally efficient natural language processing capabilities. The process by which the script links un-structured employer and occupation names to unique identifiers is portrayed in Figure 1 below. The script takes as input a list of unstructured employer names and a list of unique firm (or occupation) names with unique firm IDs (or occupation codes). For employers, I use the full list of 35,672 publicly traded firms in the Compustat North America database. For occupations, I use the “direct match files” of occupation titles to Standard Occupational Classification Codes (SOC) by the US Census Bureau and the Bureau for Labor Statistics, as well as more fine-grained O*NET codes, widely used in Labor Economics (Acemoglu and Autor, Reference Acemoglu and Autor2011).
Script matching employees to unique employer IDs and occupation codes. The flow chart shows how employer names and occupations are matched to unique employer IDs (Compustat GVKEY) and occupation codes (Standard Occupational Classification Codes (SOC)).

The script proceeds as follows: first, a number of different FEC employer names is given to the script. Then, the names get lower-cased, additional whitespace and punctuation is removed, and company legal forms are canonicalized. Next, a term-document matrix is created from the FEC employer names, where row entries are the individual employer names, the columns are the terms used across all unique names, and row–column entries are the term frequencies for each FEC employer name. The terms are then weighted by term frequency–inverse document frequency (tf-idf), so that terms that appear in many company names (like “incorporated”, “inc”, etc.) receive less weight in the matching step than the more unique parts of company names (e.g., “Microsoft”). Second, for each cleaned name, the cosine similarity between any given FEC employer name and each name in the list of 35,672 publicly traded firms in the Compustat database is calculated. The cosine similarity between an FEC employer name vector d 1 and any given Compustat company name vector d 2 is calculated as $sim( d_1,\; d_2) = {d_1 \cdot d_2^{T}}/{\Vert d_1\Vert \, \Vert d_2\Vert } = {\sum _{i = 1}^{n}d_{1i}d_{2i}}/{\sqrt {\sum _{i = 1}^{n}d_{1i}^{2}} \sqrt {\sum _{i = 1}^{n}d_{2i}^{2}} }$ . The numerator of this fraction is dot product between the two vectors, $d_1 \cdot d_2^{T}$
 , where the superscript T indicates the transpose of the respective Compustat company name vector. The denominator normalizes the dot product by vector length (magnitude) of both vectors d 1i and d 2i. The result is the cosine of the angle between the two employer name vectors in a two-dimensional space that is between 0 (no similarity, or an angle of 90° between both vectors) and 1 (complete similarity, or an angle of 0° between the vectors). The more similar the two vectors are with respect to the terms present in the company names, the smaller the angular distance and the closer is the match.Footnote 2 Finally, the script picks the Compustat firm name with the highest cosine similarity, and returns it with its unique Compustat firm ID (GVKEY), given that the similarity is above a pre-defined threshold. For employer names, I use a threshold of 0.81, based on similar record linkage problems for company patent data (Raffo and Lhuillery, Reference Raffo and Lhuillery2009). For occupations, I use a lower threshold of 0.72. First, the occupation field in the FEC data contains more text than the company name field which adds noise makes finding a matching occupation more difficult and requires a lower threshold. Second, while the 0.81 threshold for employer names is a good compromise between maximizing the number of matches and achieving accurate matches given a match is found, the 0.72 threshold is in practice very stringent, resulting in highly accurate matches.Footnote 3
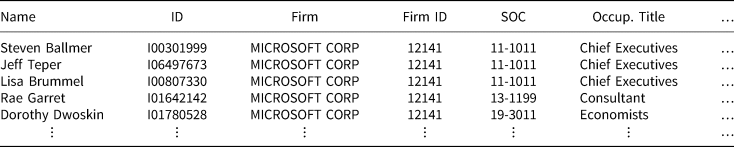
This process is repeated for each unique employer name, as well as for 17,215 corporate PAC names. The result can be seen below in Table 3 for MICROSOFT. All five employees are now matched to one unique firm name and each individual and employer gets assigned a unique ID. The process for matching occupation names to unique occupation titles and codes is identical to the procedure for employer names—only the inputs to the script differ. For occupations, the direct match files of the Census Bureau and the Bureau for Labor Statistics contain a combined number of 89,000 occupation names which include around 1,500 widely used acronyms for many occupations, for example, “CEO” for “Chief Executive”, “SVP” for “Senior Vice President”, or “EVP” for “Executive Vice President”.Footnote 4

Overall, I match 3,537,187 filings of 466,840 individuals to 13,991 firms and 850 occupations between 2003 and 2016. I also match 274,106 out of 825,697 unique occupation names. These occupations make up about 85 percent of the individuals contribution records matched to employers, excluding unemployed individuals and students.Footnote 5
2. Advantages over existing data
These data provide some advantages over existing datasets of US campaign donations like OpenSecrets.org or the Database on Ideology, Money in Politics, and Elections (DIME) (Bonica, Reference Bonica2016b). First, the data include donations for all employees identified for a given publicly traded company. Existing research provides ample evidence on donations of individuals (Barber et al., Reference Barber, Canes-Wrone and Thrower2017) or chief executives (CEOs) (Bonica, Reference Bonica2016a), but either does not differentiate between different positions of individuals in companies or concentrates on CEOs only. Second, the data contain commonly used identifiers for firms (Compustat GVKEY), industries (NAICS), and occupations (SOC), as depicted in Table A1 in the appendix. Those allow researchers to easily link corporate and employee contributions to firm financial databases (e.g., Compustat or Orbis) and add industry- and occupation-level data from the Census Bureau, the Bureau of Labor Statistics, or other official data sources. In comparison, existing research uses the Open Secrets coding scheme for “industry/occupation” of donors which cannot easily be linked to external data. Thus, the data make it easier for researchers to study the impact of industry or occupational reforms and economic shocks on the political behavior of firms and employees. Moreover, existing research often confuses occupation with industry (Bonica, Reference Bonica2014; Barber et al., Reference Barber, Canes-Wrone and Thrower2017), even though in economics (Acemoglu and Autor, Reference Acemoglu and Autor2011), CPE (Kitschelt and Rehm, Reference Kitschelt and Rehm2014), or IPE (Owen and Johnston, Reference Owen and Johnston2017), researchers have developed theoretical models with very different empirical implications for each of these levels of analysis.Footnote 6
The subsequent findings are limited with regards to the occupations and firms covered. First, I only use publicly traded companies in the US, but not small and privately held firms. Thus, if there are systematic differences between public and private companies (e.g., more employees and more capital intensity in public firms), this will be reflected in the data. Second, occupation data are only provided by the FEC since 2003, and therefore, analyses of different occupations within firms are only possible thereafter. Third, the disclosure rules for federal campaign contributions limit the representativeness of the data. Disclosure of donations is mandatory for all individual contributions exceeding USD 200, and since 2015, for donors who cumulatively donate more than USD 200 within a reporting period. While some committees do report receipts of amounts smaller than USD 200, small donations are typically bundled in committee accounts, so that no data on names, employers, or occupations are available for these donations. Thus, disclosed donors are more likely to be more affluent, white, older, and male (Francia, Reference Francia2003). These limitations need to be taken into account when interpreting the empirical results presented in this paper, and when making use of the alignment measure.Footnote 7
3. Alignment across firms and occupations
I provide three validation exercises that illustrate the potential usefulness of these data for scholars of Political Economy and American Politics. These are relationships that should be present in the data according to existing theories. First, I hold that employees’ campaign contributions will be positively correlated with their employers’ contributions. For instance, employees could self-select into firms because they live in areas dominated by the same party that the firm supports. Alternatively, the nature of the workplace could tie the economic fortunes of individuals to the firm and incentivize them to donate to the same party (Alt and Gilligan, Reference Alt and Gilligan1994). Lastly, employers themselves might mobilize employees to support certain candidatesFootnote 8, as could labor unions (Kim and Margalit, Reference Kim and Margalit2017).
Second, I expect that firm–employee alignment will be higher in smaller firms, as compared to larger firms. Intuitively, one would expect alignment to be inversely related to firm size. Collective action is more difficult in larger groups due to the higher likelihood of free riding (Olson, Reference Olson1965; Hansen et al., Reference Hansen, Mitchell and Drope2005), and because both the firm and their employees need to mobilize in order to support the same partyFootnote 9. Also, while firms with a larger market share might be more likely to mobilize because political activity might yield more concentrated benefits, these firms are also more likely to have politically heterogeneous employees (Walker and Rea, Reference Walker and Rea2014).
Third, I test whether contributions of high-ranking employees are more aligned with firm contributions, compared to lower-ranking employees. Work on the political behavior of chief executives in Finance, Economics, and Management has documented that chief executives donate more dollars and more frequently (Richter and Werner, Reference Richter and Werner2017) to more extreme candidates (Bonica, Reference Bonica2016a), and that CEO ideology impacts corporate decisions like downsizing (Gupta et al., Reference Gupta, Nadkarni and Mariam2018). CEOs should also have more incentives to donate to the same party as their company, since often, a large fraction of executive compensation is based on bonuses and stock options which depend on company profits. This does not mean that regular employees cannot hold stock options, or that their income cannot depend on company profits. However, corporate executives should be more likely to hold company shares, and hence, be more likely to align with the party preferred by the company, on average.Footnote 10
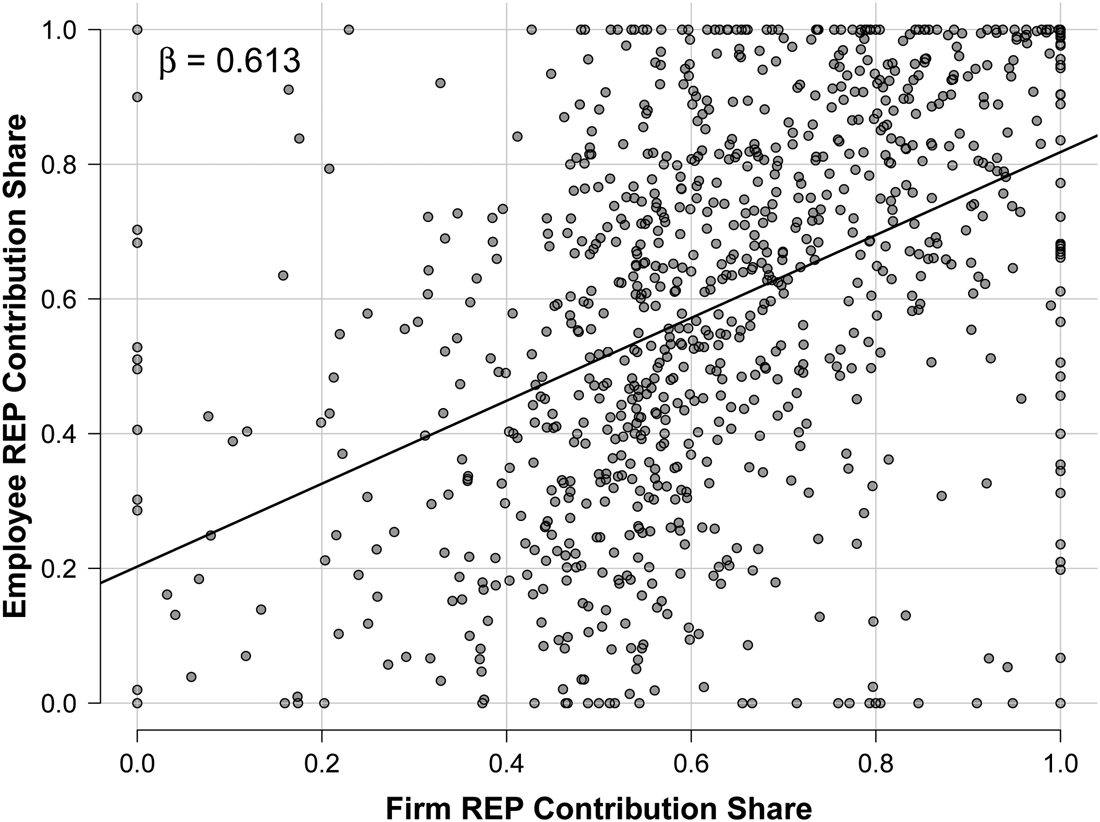
Figure 2 plots Republican donations as a share of overall donations of publicly traded US corporations against the aggregate Republican donation share of the same companies’ employees. It shows that employer and employee donations are indeed highly correlated: the higher the share of Republican donations by a corporate PAC, the higher the share of Republican donations by the same company's employees. Further, this relationship is driven by House and Senate candidates, and is strongest for incumbents, followed by challengers and open seat candidates, as shown in Figures A1 and A2 in the appendix, providing evidence that is more consistent with investment motives behind corporate donations.
Relationship between firm and individual partisan donations. This scatter plot shows the relationship between the share of donations donated to Republicans by firm PACs and their employees. β denotes the slope coefficient of the bivariate linear regression of employee Republican donation share on the firm Republican donation share. The R 2 is 0.2.

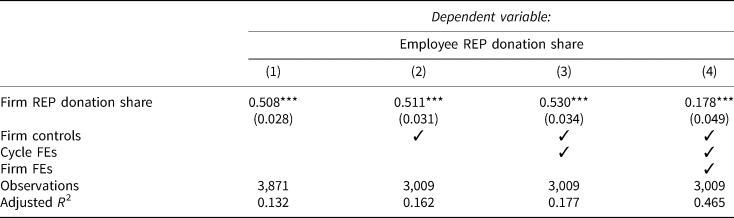
Next, I aggregate donations at the firm–electoral cycle-level, and regress the Republican donation share of employees on the donation share of their company PAC. As expected, employee donations to the Republican party are positively correlated with firm donations, as seen in Table 4. Then, I add time-varying firm controls (capital expenditure, plant and property expenses, cost of goods sold, and sales, all logged), cycle fixed effects, and firm fixed effects. Moving from 0 to 1 on the PAC Republican donation share increases the employee share to Republicans by approximately 18 percent, even after controlling for firm- and cycle unobservables. This association is large and surprising, given that a large portion of the campaign finance literature argues that individual donations are merely consumption (Ansolabehere et al., Reference Ansolabehere, de Figueiredo and Snyder2003), but is more in line with newer accounts of workplace coercion (Hertel-Fernandez, Reference Hertel-Fernandez2018) and individual donations to sector-related congressional committee members (Barber et al., Reference Barber, Canes-Wrone and Thrower2017).
Regression results: employee and firm donations

Note: *p < 0.1; **p < 0.05; ***p < 0.01. Standard errors clustered by firm.
For testing the second and third expectation outlined above, I need a measure of alignment between firms and employees which incorporates the fact that most individuals only donate to one party while corporate PACs vary substantially in the partisanship of their donations. Hence, the main dependent variable for this paper, partisan alignment between employees and their employers, is calculated as:

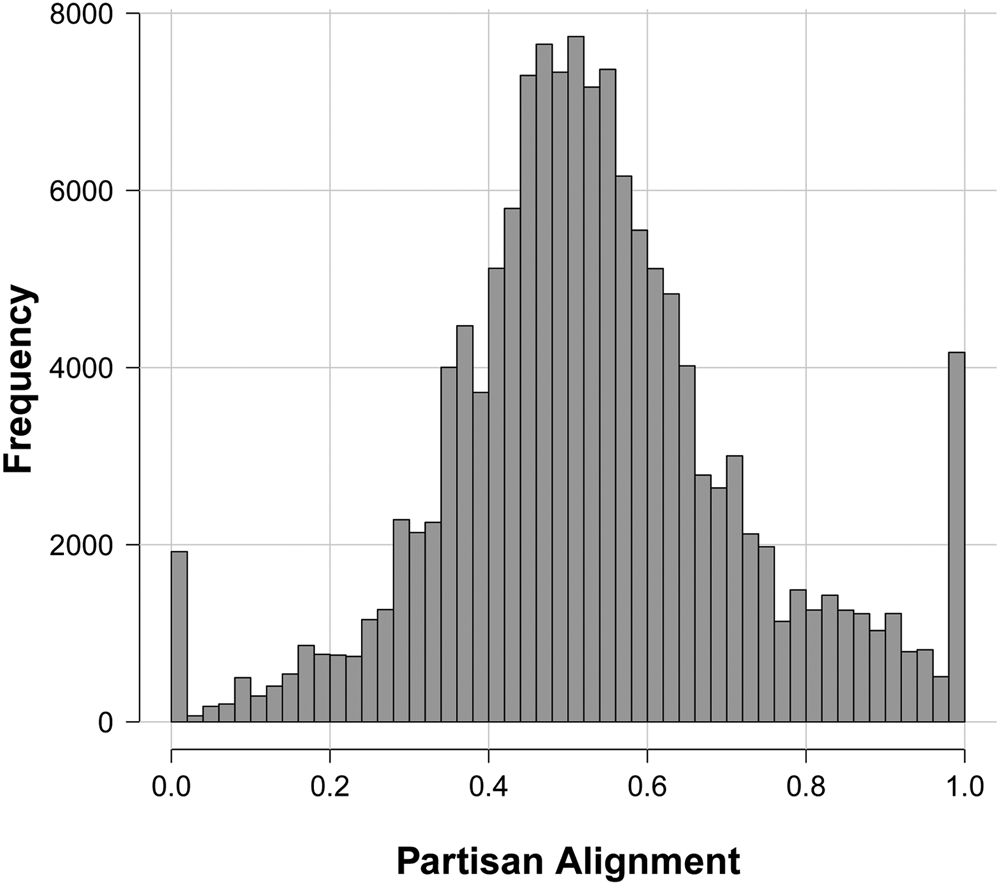
which is the absolute difference in the Republican donation share of firm j in electoral cycle t and the Republican donation share of employee i working for firm j in the same cycle t. R and D denote donations to Republican and Democratic federal candidates, respectively. In Figure 3, I plot the distribution of partisan alignment between firms and employees which ranges from 0 (complete partisan dis-alignment) to 1 (complete partisan alignment). It centers around 0.5, with peaks at both extremes of the distribution. While individuals tend to donate to only one party, PACs often split donations between both parties. Hence, if PACs split their donations equally between Democrats and Republicans but employees donate to one party, this results in alignment falling around the 0.5 mark. As another example, if a PAC donates 70 percent of its contributions to Democrats, alignment will be at 0.7 for employees who donate to Democrats and around 0.3 for employees who donate to Republicans. However, a few firms only donate to one party in some electoral cycles. Then, all individuals working for this company who donate to the opposite party score 0, and all employees donating to the same party score 1 on the alignment measure, which explains the approximately 6,000 1's and 0's in the distribution. For example, the Blackstone Group PAC donated only to Republican candidates from 2011 to 2015. Therefore, 408 employees of Blackstone donating to the Republican party score 1 (full alignment), and 209 employees donating to Democrats score 0 (no alignment).Footnote 11 All results in this section hold and regression coefficients are of similar magnitude when extreme values (i.e., 0's and 1's) are excluded from the analysis, shown in Appendix A12.
Distribution of Partisan alignment. This histogram depicts the distribution of alignment from complete disalignment (0) to complete alignment (1) in the US campaign finance data.

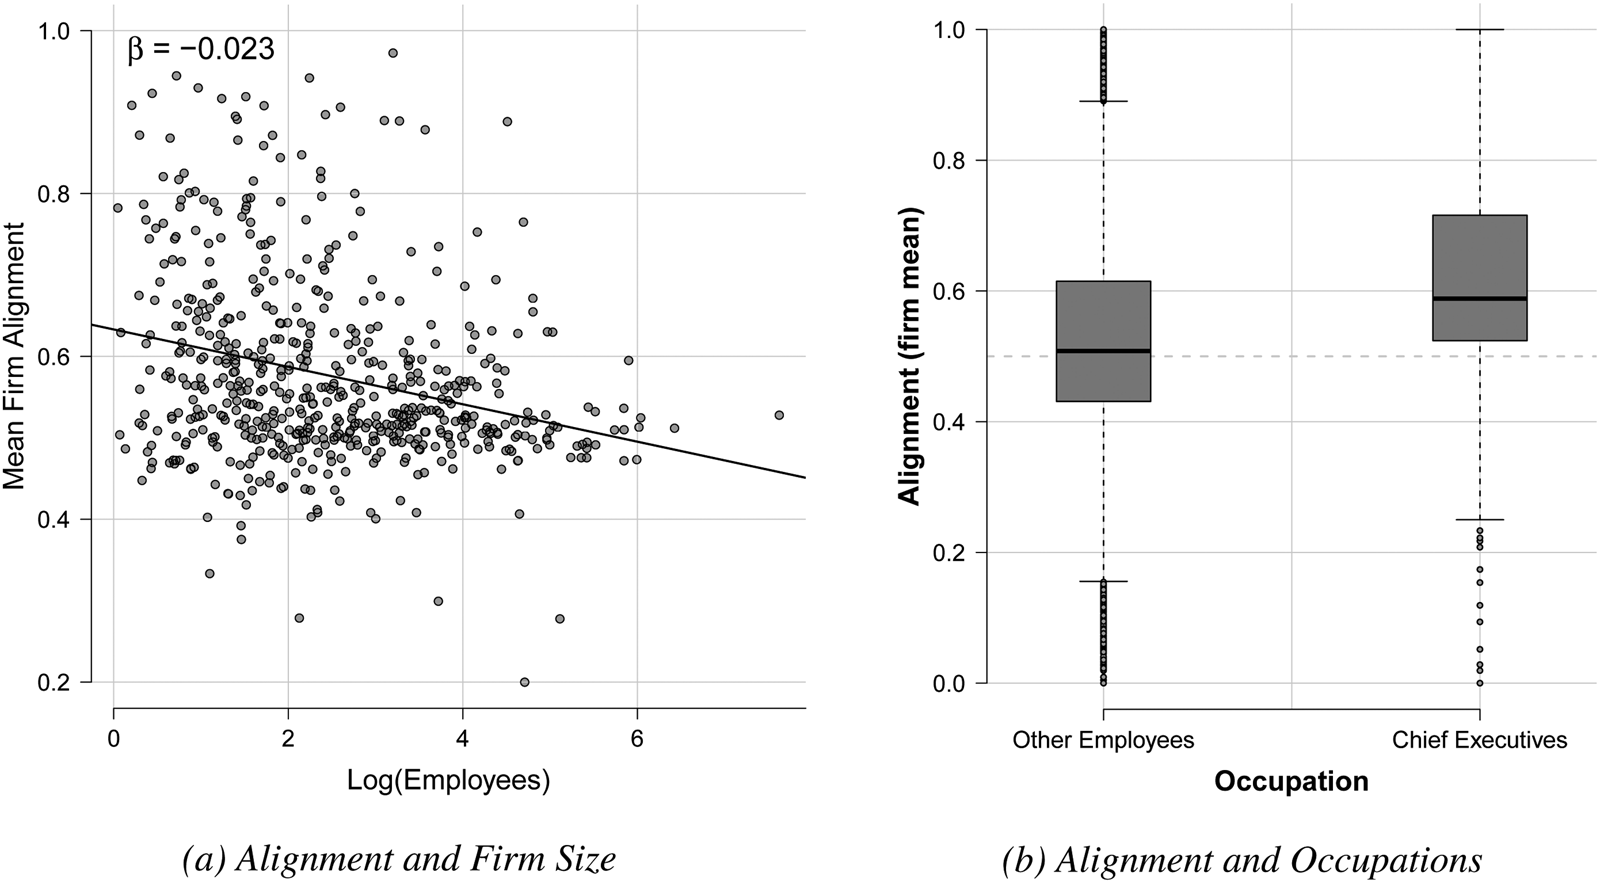
Figure 4 below provides some descriptive evidence in favor of the expectations with respect to company size and the motivations of chief executives. Panel 4(a) shows the bivariate relationship between average firm alignment and the logged number of employees. The relationship is moderately negative, with alignment across all employees being about 0.63 for firms with the lowest number of employees, and about 0.45 for firms with the highest number of employees, supporting the expectation that larger firms are less aligned. Panel 4(b) shows boxplots comparing average alignment of CEOs and regular employees. Executives have a median alignment score of 0.59 and normal employees have a median alignment of 0.51. Hence, while CEOs tend to be more aligned with the partisan donations of the corporate PAC, rank-and-file employees seem to donate equally to both parties, on average. There is, however, a large variation in alignment, especially for non-executive employees. In contrast, over 75 percent of CEOs tend to align with the partisan donations of their PAC.
Alignment and firm- and occupational characteristics. Panel (a) shows the relationship between firm size and average alignment of firms and employees at the firm-level. Panel (b) shows the average alignment of chief executives with their company PAC, compared to all other employees. (a) Alignment and firm size and (b) alignment and occupations.

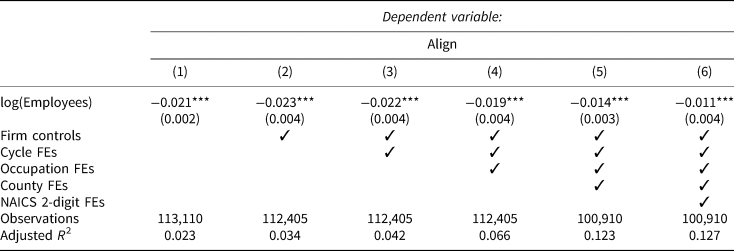
In Table 5, I regress employee–firm alignment per electoral cycle on the logged number of firm employees. The regression coefficient is negative, significant, and similar in size to the bivariate relationship in Figure 4. Then, I add a number of firm–election cycle controls, and the coefficient stays almost unchanged. I consequently add fixed effects for the electoral cycle, individual occupation at the six-digit SOC level, and counties. Lastly, I add broad industry fixed effects to control for the fact that some industries might be larger than others due to unobserved factors. The strength of the coefficient decreases, especially when adding county fixed effects, but remains negative and significant. Holding constant occupation, electoral cycle, county, and industry, going from the minimum logged number of employees in the data (close to 0) to the 90th percentile is associated with a 0.059 increase in alignment. This is substantive, given that most observations cluster closely around 0.5. Even though the results cannot be interpreted as causal, they support the notion of more collective action problems in large companies. There are several possible mechanisms behind this relationship that might be interesting to investigate further in the future: first, to the extent that it is important whom your colleagues donate to, it might be easier for employees in smaller companies to coordinate donations. Second, firms might find it easier to mobilize their employees to donate in smaller firms with a more geographically concentrated workforce.
Regression results: firm size and alignment

Note: *p < 0.1; **p < 0.05; ***p < 0.01. Standard errors clustered by firm.
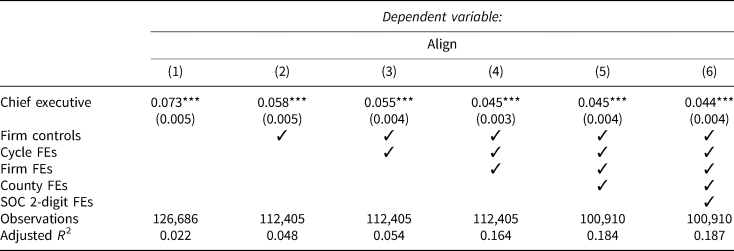
Finally, in Table 6, I regress firm–employee alignment on being a top executive (SOC 11-1011). As expected, the coefficient is significant and positive, indicating that CEOs are more aligned than other employees, on average. Like before, I add firm controls and a host of fixed effects to the model. Holding constant electoral cycle, firm, county, and broad two-digit SOC occupations, CEOs are more aligned than other employees. In the most conservative specification, chief executives score 0.044 higher on my measure of alignment. This is less than a big increase in the number of employees but still substantively large.
Regression results: chief executives and alignment

Note: *p < 0.1; **p < 0.05; ***p < 0.01. Standard errors clustered by firm.
4. Summary and future applications
I link big data on corporate and employee campaign contributions, and create a measure of partisan alignment between firms and employees. In line with Political Economy theories, firm and employee donations are highly correlated, and firm–employee alignment is significantly associated with firm size and employee position in the company. These data open up multiple avenues for further research to gain insights into coalition formation, individual motivations for political giving, and representation in US politics. For example, what is the impact of economic shocks or reforms affecting occupations and industries on individual contributions? What are the implications of stronger alignment among top executives on the likelihood of firms to lobby alone or in business associations (Bombardini and Trebbi, Reference Bombardini and Trebbi2012), and does it affect lobbying success? How has the distribution of donations across and within industries and occupations changed over time, and how has it affected representation in US politics (Gilens and Page, Reference Gilens and Page2014)? These are only some of the questions which will be easier to answer with the linked employer–employee donations data presented in this paper. While I show only some applications from my ongoing work, these data will be a useful resource for many different purposes in American Politics and Political Economy.
Supplementary material
To view supplementary material for this article, please visit https://doi.org/10.1017/psrm.2020.19
Acknowledgments
Funding from the French Agence Nationale de la Recherche (under the Investissement d'Avenir program, ANR-17-EURE-0010) is gratefully acknowledged. I thank In Song Kim for accompanying this project from the start. I also thank Stephanie Rickard, Kenneth Benoit, Mark Manger, Kenneth Shadlen, Elena Pupaza, and Selina Hofstetter, and Florencia Pezzimenti for feedback and advice on earlier drafts.