Introduction
Sri Lanka has been the forerunner in Asia in mortality and fertility declines. Sri Lanka's crude birth rate at the turn of the 20th century was 39 births per 1000 mid-year population and ranged between 33 and 42 during the period 1900–1946. Sri Lanka commenced tabulating births by age of mother in 1953 and the total fertility rate (TFR) estimated for that year stood at 5.1 children per woman. According to the 1975 World Fertility Survey TFR had declined to 3.4 in 1974. This rate, while consistent with the expected trends, was slightly lower than the rate (3.6 children per woman) estimated from vital registration data. Vital registration data include births registered by Sri Lankan residents living overseas, but this may not explain the difference in TFR between the two sources. It was also lower than the Own Children Estimates produced by Ratnayake et al. (Reference Ratnayake, Retherford and Sivasubramanium1984), using the 10% sample data file from the 1981 population census. The TFR remained around 3.9 children until the late 1970s and began to decline in the early 1980s. The Sri Lanka Contraceptive Prevalence Survey (CPS) of 1982 estimated a TFR of 3.7 children per woman in 1981. Although this rate was comparable with the rate produced by the vital registration system, some analysts considered this rate to be high and attributed it to potential survey errors (Gendell, Reference Gendell1985).
The first Demographic and Heath Survey (DHS) in Sri Lanka was conducted in 1987. This survey estimated a TFR of 2.8 births per woman for the period 1982–1987. This rate was also consistent with that of the vital registration system. The next DHS of 1993 estimated the TFR to be 2.3 births per woman for the period 1988–1993. This rate, while consistent with the declining trend, was also close to the average TFR shown by the vital registration system (2.5 children per woman). The next round of the DHS carried out in 2000 gave a TFR of 1.9 births per woman for the period 1995–2000, which indicated a fall below the replacement level. With this decline, Sri Lanka recorded the lowest fertility in South Asia at that time. Sri Lanka's TFR below-replacement level was hailed as a success of the family planning programme (De Silva, Reference De Silva1994). Considering the fertility trends in Sri Lanka since the 1960s, particularly the declines shown since 1981, it was anticipated that Sri Lanka's TFR would soon fall below replacement fertility (Langford, Reference Langford, Sathar and Phillips2001). Accepting this fall as evidence of completing the fertility transition, some researchers predicted that the TFR of Sri Lanka would further decline to 1.4 by 2010 and to 1.3 by 2015 (De Silva, Reference De Silva2001). However, the next DHS survey carried out during 2006/7 produced a reversal: average TFR increased to 2.3 in 2004/6, which was well above replacement level and has puzzled many (for example, De Silva et al., Reference De Silva, Perera and Anuranga2010).
However, we have found that fertility rates for Sri Lanka, derived from the vital registration data, were different from fertility rates estimated from the 2000 DHS survey. It is important to note that fertility estimates for Sri Lanka that were derived from household surveys conducted since 1987 generally excluded the northern and eastern provinces owing to the civil war. It is probable that fertility during 1995–2000 indeed continued to decline and was less than the level observed in 1988–1993, but did not go below replacement level to 1.9 births per woman during the period. Thus it is likely that there was no major reversal of fertility decline between 2000 and 2006/7, rather a minor fluctuation close to replacement-level fertility.
This paper evaluates, using registration statistics and other evidence, the claim that the TFR in Sri Lanka fell below replacement level during 1995–2000. If the decline to 1.9 was genuine then it would be necessary to investigate whether the rebound to 2.3 births per woman estimated from the DHS 2006/7 was also genuine. To test these claims the TFR is first re-calculated from the 2000 survey for the five-year period before the survey to verify that the method of calculation did not cause the higher than expected decline in TFR. The trends in TFR obtained from the vital registration system for the country as a whole with and without the northern and eastern provinces are then compared with the fertility estimates from the DHS surveys. The study also briefly examines whether there were any changes in the key proximate determinants of fertility (nuptiality, contraception, breast-feeding and abortion) that may have influenced the TFR to fall below replacement fertility during 1995–2000 and then return to the pre-1995 level.
Results
Trends in fertility
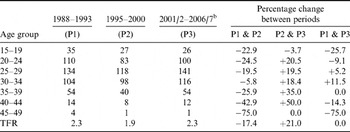
The estimated age-specific and total fertility rates for the five years preceding the three DHS surveys are given in Table 1. While the estimates for 1988–1993 and 1995–2000 are taken from the survey reports, new age-specific fertility and TFR derived from the 2006/7 survey for the period 2001/2–2006/7 were used. The total fertility rate reported for the five years preceding the surveys declined by 17% between the 1993 and 2000 surveys and then began to rebound and reached the level of 2.3 as estimated from the 2006/7 survey. The decline in age-specific fertility rates between period 1 and period 2 were large and were contributed to by women in all age groups, with women 35 years and over showing large declines. Between 2000 and 2006/7 there seems to be a complete reversal of these age-specific fertility trends. The changes in age-specific rates between periods 1 and 3 indicate that there may indeed be a shift to later childbearing. This means that while there might have been a small decline in the younger age groups, the decline was probably not large enough to bring the overall total fertility rate to as low as 1.9.
Age-specific fertility rates and total fertility rate (TFR) for Sri Lanka (excluding the northern and eastern provinces) from the 1993, 2000 and 2006/7 Demographic and Health Surveys a

a Estimates refer to the five years before the respective surveys.
b Estimates provided by D. N. P. Fernando, University of Colombo.
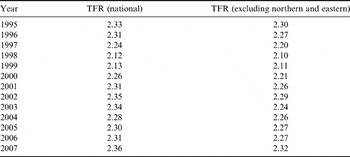
Fertility rates were re-estimated from the 2000 survey using the same methodology employed by the DHS programme. This yielded a TFR of 2.0 for the 1995–2000 period, 2.04 for the three years preceding the 2000 survey, and 2.06 for the 12 months before the survey, which were consistent with estimates provided by others (Champa Shiromali, Department of Census and Statistics, Sri Lanka, personal communication). Table 2 shows how the new TFR estimate compares with the trends in TFR calculated from vital statistics for the relevant period for the country as a whole and excluding the north and east. It is clear that TFR for none of the years between 1995 and 2007, with or without the northern and eastern provinces, dropped below the replacement level. However, in 1998 and 1999 the TFR approached 2.1 but did not fall below the replacement level and rebounded in 2000 to the 1997 level. The TFR estimated from the 2000 survey for the period 1995–2000 was 1.9, whereas the comparable rate derived from the vital registration data was around 2.2 with or without the northern and eastern provinces. The 2004 December Tsunami undoubtedly caused some deaths among pregnant women and newborn infants, but its effect on TFR cannot be accurately determined. The TFR derived from the 2006/7 DHS (2.3 births per woman) for the five years preceding the survey was consistent with the estimates from the vital registration data.
Total fertility rate (TFR) derived from vital registration data, 1995–2007: national rates and rates excluding northern and eastern provinces

The registration data clearly showed that the TFR had been fluctuating between 2.12 (1998) and 2.36 (2007) during the period under consideration. Ross and Frankenberg (Reference Ross and Frankenberg1993, p. 6) examined national and sub-national estimates of contraceptive practice and total fertility rates for a large number of developing countries and established a simple mathematical relationship between contraceptive prevalence rate (CPR) and fertility. They expressed the relationship in the form of an equation: TFR=7.2931−(0.0700×CPR). Here TFR was obtained by applying the contraceptive prevalence rates obtained from the 1993, 2000 and 2006/7 DHS surveys to the above equation. The results are revealing. While the survey estimate for 2000 was 1.9, the regression estimate was 2.4, well above the replacement level. For 2006/7, the survey estimate (2.3) and regression estimate (2.4) were close. The regression method yielded a TFR of 2.67 for 1993, which was slightly above the DHS estimate of 2.3. Interestingly, while the survey estimate increased between 2000 and 2006/7, the regression estimate did not change. Thus it appears that the 2000 DHS survey provided an underestimate of total fertility rate.
The changes in the proximate determinants of fertility during 1995–2006/7 and how those changes align with changes in total fertility rates estimated from the DHS surveys are now examined.
Trends in proximate determinants of fertility
The initial decline in fertility observed in the early 1960s in Sri Lanka has been attributed to delayed marriage rather than to substantial reductions in marital fertility (Wright, Reference Wright1968). Fertility control within marriage was limited and has been attributed to the use of traditional methods such as rhythm, withdrawal and sexual abstinence (Caldwell et al., Reference Caldwell, Gaminiratne, Caldwell, De Silva, Caldwell, Weeraratna and Silva1987). This is not surprising as it was only in 1970 that most government health facilities in the country were equipped to provide routine family planning services, including IUD insertions and sterilizations.
An indicator commonly used to assess the trends in age at first marriage is the Singulate Mean Age at Marriage (SMAM). The SMAM for both sexes declined slightly between 1981 and 2001: from 28.2 to 27.9 years for males and 24.7 to 23.9 years for females. The declining trend in mean age at marriage does not explain why fertility declined below the replacement level during the period 1995–2000. Even as average age at marriage kept decreasing, the proportions single increased in successive censuses. It is clear that Sri Lanka probably broke away from the universal marriage pattern in the 1990s.
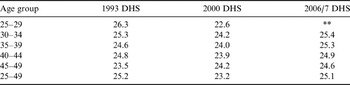
Most countries undergoing fertility transition experience increase in age at first birth. This is mainly due to substantial reductions in adolescent fertility. The median age at first birth for Sri Lankan women estimated from the three DHS surveys shows that the estimates from the 2000 survey are inconsistent with what is expected when total fertility rate declines to below replacement level (Table 3). The median age at first birth for those aged 25–49 was 25.2 years in 1993 and remained the same in 2006/7. However, the estimate derived from the 2000 survey showed a decline of 2.0 years compared with that of 1993. This is inconsistent with trends in total fertility rate, which, according to the published reports, declined between the 1993 and 2000 surveys.
Trends in median age at first birth, Sri Lanka, women aged 25–49 years

Estimates for age groups 15–19 and 20–24 were not reliable as only a few women reached parenthood in these age groups.
Estimates for 1993 and 2000 exclude northern and eastern provinces and that for 2006/7 excludes the northern province, but includes the eastern province.
**Not derived due to small number of cases.
The apparent declines in median age at first birth for women in prime childbearing age groups and the overall median values reported from the 2000 DHS suggest problems with data rather than a genuine change in childbearing pattern. Prior to 1965 the Sri Lankan government provided grants to the Sri Lankan Family Planning Association and allowed it to use government health facilities for family planning services. Although fertility decline in the 1960s was mostly due to nuptiality changes, there was some evidence of fertility control within marriage in older age groups. A micro-level study carried out in some parts of Sri Lanka showed that Sri Lankan couples used natural family planning methods before modern contraceptive methods were widely available (Caldwell et al., Reference Caldwell, Gaminiratne, Caldwell, De Silva, Caldwell, Weeraratna and Silva1987).
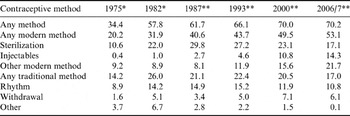
In the mid-1970s, one in three married women aged 15–49 were using a contraceptive method (Department of Census and Statistics, 2009). By the mid-1980s, as shown in Table 4, this increased to almost two in three women. This was due to a greater increase in the uptake of modern methods compared with the increase in the use of traditional methods. The prevalence of contraceptive has consistently increased over time. In particular, during the period 1993–2000 the overall prevalence increased from 66% to 70%. Moreover, this increase was due to growth in the use of modern methods. It is interesting that the prevalence rate did not change between 2000 and 2006/7. However, the method composition had changed. A small increase in the proportion of married women using modern methods was accompanied by a parallel decline in traditional methods. The trend in contraceptive use between 1993 and 2006/7 is not consistent with the fertility trend during the same period, which raises doubts about the reliability of estimates, particularly from the 2000 DHS survey. Contrary to De Silva et al.'s (Reference De Silva, Perera and Anuranga2010) observation, contraceptive prevalence in Sri Lanka did not seem to have declined between the 2000 and 2006/7 surveys. The figures in Table 4 show that there was no major change in prevalence rate and thus it is not a plausible explanation for the apparent increase in fertility between the two surveys.
Trends in contraceptive use of currently married women aged 15–49, by method, Sri Lanka

*National estimates; **excluding the northern and eastern provinces.
In terms of duration of breast-feeding, this continued to increase between the three surveys. For example, the duration of breast-feeding increased from 23 months in 1993 to 28 months in 2000, and this is consistent with the decline in fertility over that period. In 2006/7 estimated breast-feeding duration was 30 months, an increase of 2 months from 2000. This increase does not align with an increase in fertility during 2000–2006/7.
The last intermediate variable of interest is induced abortion. Abortion in Sri Lanka is a criminal offence and only ‘legally’ performed when it is necessary to save the life of the mother. Existing estimates on the numbers of abortions in Sri Lanka differ depending on the purpose, methodology, survey design and sponsor of the study. According to the 1993 DHS survey, about 2.2% of ever-married women had reported having ever had an induced abortion (Department of Census and Statistics, 1995). The 2000 DHS yielded an even lower rate of induced abortions than the 1993 DHS: 1.2% (Department of Census and Statistics, 2002, p. 133). De Silva et al. (Reference De Silva, Perera and Anuranga2010) cited a community survey conducted in 1998 that estimated an induced abortion rate similar to the estimate from the 2000 DHS survey. Another study estimated that the number of induced abortions in Sri Lanka ranged from 125,000 to 225,000 (De Silva et al., Reference De Silva, Dayananda and Perera2006). Based on this information, De Silva and colleagues argued that the decline in fertility to below replacement level between 1993 and 2000 was largely due to induced abortion. While this seems plausible, the relatively high prevalence of induced abortions in the early 2000s does not explain an apparent rebound in fertility with TFR rising by 21% between the last two DHS surveys, 2000 and 2006/7.
Abeykoon (Reference Abeykoon2006) attempted to decompose fertility decline in Sri Lanka between 1975 and 2000 using the proximate determinants framework of Bongaarts (Reference Bongaarts1978) in which the difference between the observed fertility and the theoretical maximum fertility is decomposed into components related to marriage patterns, contraception and abortion and other factors (mainly breast-feeding). In the absence of prevalence estimates for Sri Lanka Abeykoon used abortion rates from other countries at similar level of socio-economic development. The results of the study showed that the relative contribution of induced abortions had in fact declined from 2.7% in 1993 to 1.5% in 2000. Thus it is reasonable to infer that the level and trend in induced abortion did not make a significant contribution to the declining fertility trend in Sri Lanka or to the fertility rebound between the 2000 and 2006/7 surveys.
Discussion and Conclusion
The main objective of this paper was to examine the claim that the total fertility rate in Sri Lanka actually fell below the replacement level during the late 1990s. The 1993 DHS estimated a TFR of 2.3 births per woman. The TFR of 1.9 derived from the 2000 survey for the period between 1995 and 2000 was, while consistent with the declining fertility trends, in the authors' view, too low to be a genuine estimate. If the fertility rate did not fall below the replacement level then the issue of whether the TFR increased in the five-year period before the 2006/7 survey or whether the fertility transition in Sri Lanka has been reversed does not arise. In order to compare the fertility rates across the 1993, 2000 and 2006–07 surveys, the 2006–07 fertility rates were re-computed excluding the eastern province for the five years preceding the survey to ensure that the fertility estimates from the three surveys were comparable.
The study also analysed time series data on fertility from 1995 to 2007 obtained from the Registrar General's Office for the country with and without the northern and eastern provinces. This analysis showed that except for two years when the TFR reached the replacement level, there was no evidence of the TFR falling below the replacement level during the five-year period 1995–2000, as the 2000 DHS report claims. The trends in proximate determinants suggested a declining trend throughout the period under consideration (1988–2006/7). This is not consistent with the claim that the fertility rate went through an up-swing between the 2000 and 2006/7 surveys. Thus the trends in the proximate determinants of fertility do not lend credence to the view that a reversal of fertility transition began following the year 2000.
This analysis of total fertility rates based on vital registration data showed that the national fertility pattern differed depending on whether or not the northern and eastern provinces were included in the computation. This fact points to a possible variation in fertility patterns between the various regions of Sri Lanka. It is possible that the many regions of Sri Lanka are at different stages of fertility transition or that the pace of fertility transition is different between regions. Fertility in Sri Lanka is gradually approaching replacement level and could go below this in the near future, if current trends continue.
Acknowledgments
The authors wish to thank the Department of Census and Statistics, Sri Lanka, for granting permission to use the Demographic and Health Survey data files. In particular, the assistance of Mrs L. P. De Silva (Additional Director), Mr S. A. S. Bandulasena (IT Director), Mr E. A .G. S. Perera (Systems Analyst) and Mr D. P. Rajapakse (Former Director, Vital Statistics Section) is gratefully acknowledged. Thanks are also due to Professor K. A. P. Siddhisena for his support for this research, and in particular for his comments on an earlier draft of the paper. The authors also thank the anonymous reviewers for their valuable comments on the earlier drafts of this paper.