Introduction
Individual variation in intelligence (or general cognitive ability, GCA) predicts a broad array of important outcomes, including morbidity, mortality, mate value, educational attainment, and vulnerability to various forms of psychopathology, including schizophrenia (see Deary, Reference Deary2012, and Nisbett et al., Reference Nisbett, Aronson, Blair, Dickens, Flynn, Halpern and Turkheimer2012, for recent reviews). The biological underpinnings of these variations have thus become a focus of intense scrutiny. One important approach is derived from graph theory, which conceptualizes the brain as a network comprised of nodes and the connections that link them (Bullmore & Sporns, Reference Bullmore and Sporns2009). Graph metrics can be derived from either functional or structural MRI data (Messé et al., Reference Messé, Marrelec, Bellec, Perlbarg, Doyon, Pélégrini-Issac and Benali2012; Yu et al., Reference Yu, Plis, Erhardt, Allen, Sui, Kiehl and Calhoun2011), quantifying important organizational properties of the network. In the current study, we used diffusion weighted imaging (DWI) as the foundation for determining individual variation in patterns of network connectivity. Our central goal was to characterize and compare network features associated with GCA in healthy controls and individuals with schizophrenia. A second goal was to evaluate whether a specific genetic measure reflecting mutation load, previously found to predict GCA in individuals with schizophrenia (Yeo et al., Reference Yeo, Gangestad, Walton, Ehrlich, Pommy, Turner and Calhoun2014), was related to graph metrics.
A great deal of interest has emerged in recent years regarding the covariation of schizophrenia and GCA. There are several reasons for this, including the large effect sizes for GCA observed when comparing groups of patients and controls (Dickinson & Harvey, Reference Dickinson and Harvey2009), the cross-cultural nature of the deficit (Schaefer, Giangrande, Weinberger, & Dickinson, Reference Schaefer, Giangrande, Weinberger and Dickinson2013), and the likelihood that the phenotypic overlap of schizophrenia and GCA is genetically determined (Lencz et al., Reference Lencz, Knowles, Davies, Guha, Liewald, Starr and Malhotra2014). Based on these and related findings, it has been argued that schizophrenia is primarily a cognitive illness, not a psychotic disorder (Kahn & Keefe, Reference Kahn and Keefe2013). Similarly, Caspi and colleagues have described a single, overarching dimension of psychopathology (the p factor) that is partly defined by variation in GCA (Caspi et al., Reference Caspi, Houts, Belsky, Goldman-Mellor, Harrington, Israel and Moffitt2013). Because GCA can be very reliably measured and has such a rich research foundation (e.g., with respect to genetic, neuroanatomic, social, and developmental correlates), investigating determinants of its variation in schizophrenia may prove to be an illuminating research strategy.
Early graph theoretic analyses found that the human structural network exhibits a small world organization, whereby there is a balance of local and long distance connectivity that facilitates both specialized and distributed information processing (Bassett, 2006 and Iturria-Medina, 2008). The extent of local connectivity in a network is characterized by the clustering coefficient. Characteristic path length refers to the shortest number of steps needed to link one node to another, averaged across all pairs of nodes. Small worldness is a network feature emerging from both clustering and relatively shorter path lengths that facilitates efficient information transfer (Latora & Marchiori, Reference Latora and Marchiori2001; Watts & Strogatz, Reference Watts and Strogatz1998). The global efficiency metric attempts to quantify both global and local efficiency, providing a meaning to the concept of small world. Compared to efficiency, characteristic path length is more influenced by the longer pathways in the network (Rubinov & Sporns, Reference Rubinov and Sporns2010).
Three studies have explored relationships between GCA and network metrics derived from DWI. In a sample of 79 healthy young adults, Li et al. found correlations of medium effect size between summary measures from the Chinese Revised Wechsler Adult Intelligence Scale and clustering, characteristic path length, and global efficiency metrics (Li et al., Reference Li, Liu, Li, Qin, Li, Yu and Jiang2009). However, all of these measures are influenced by the overall connectivity of the network, and the impact of this factor must be taken into account. Fischer et al. observed no relationships between these graph metrics and estimated IQ (a short-form of the Hamburg-Wechsler Intelligence Test) in 43 elderly individuals (Fischer, Wolf, Scheurich, & Fellgiebel, Reference Fischer, Wolf, Scheurich and Fellgiebel2014). Zalesky et al. (Reference Zalesky, Fornito, Seal, Cocchi, Westin, Bullmore and Pantelis2011) explored correlations of clustering, path length, and efficiency (normalized for overall connectivity with degree-matched random graphs) with scores from the Wechsler Test of Adult Reading (WTAR, an estimate of premorbid GCA) in controls (N=32) and patients with schizophrenia (N=74) (Zalesky et al., Reference Zalesky, Fornito, Seal, Cocchi, Westin, Bullmore and Pantelis2011). Prominent group differences were observed for each metric, with controls demonstrating networks with greater connectivity. In controls, positive correlations were found between WTAR scores and both efficiency and clustering, along with a negative correlation of WTAR and characteristic path length. In contrast, no significant correlations were noted in the patient sample, perhaps because the measure of GCA did not accurately reflect current cognitive status.
Our primary interest is in the analysis of global, brain-wide network features, as these may best map onto the global construct of GCA. However, some nodes may be more important for GCA and group differences than others. In particular, “rich club” (RC) nodes have received much recent attention, due to their role in global communication (van den Heuvel, Kahn, Goñi, & Sporns, Reference Van den Heuvel, Kahn, Goñi and Sporns2012), global efficiency (Senden, Deco, de Reus, Goebel, & van den Heuvel, Reference Senden, Deco, de Reus, Goebel and van den Heuvel2014), and integration between functional networks (van den Heuvel et al., Reference Van den Heuvel, Sporns, Collin, Scheewe, Mandl, Cahn and Kahn2013; Yu et al., Reference Yu, Plis, Erhardt, Allen, Sui, Kiehl and Calhoun2013). RC nodes are highly connected to other brain regions, and as well, are highly connected to each other, more than would be expected based simply on their overall number of connections. We are aware of no studies that have specifically attempted to link RC connectivity with GCA in both controls and patients, taking an edge-centric perspective (de Reus, Saenger, Kahn & van den Heuvel, Reference De Reus, Saenger, Kahn and van den Heuvel2014). Thus, one major goal was to evaluate group differences in the nature and significance of specific classes of edges in controls and individuals diagnosed with schizophrenia.
A second goal was to evaluate the impact of a specific type of genetic variation on network features. One type of mutation that may be especially important is copy number variation (CNV), which can be manifest as either deletions or duplications of genetic material (Zhang, Gu, Hurles, & Lupski, Reference Zhang, Gu, Hurles and Lupski2009). A greater overall burden of rare deletions predicts reduced GCA and executive function in individuals with schizophrenia, but not controls (Martin, Robinson, Reutens, & Mowry, Reference Martin, Robinson, Reutens and Mowry2014; Yeo, Gangestad et al., Reference Yeo, Martinez, Pommy, Ehrlich, Schulz, Ho and Calhoun2013, Reference Yeo, Gangestad, Walton, Ehrlich, Pommy, Turner and Calhoun2014). Thus, we evaluated the impact of rare deletion burden on all global network parameters identified as contributing to GCA.
Methods
Participants
Participants were recruited through the Mind Clinical Imaging Consortium (MCIC) from four sites: the Mind Research Network and University of New Mexico in Albuquerque (21 controls, 16 patients), New Mexico; Massachusetts General Hospital (22 controls, 23 patients); the University of Minnesota (18 controls, 21 patients); and the University of Iowa (55 controls, 20 patients). See Gollub et al. (Reference Gollub, Shoemaker, King, White, Ehrlich, Sponheim and Andreasen2013) for additional details. The Institutional Review Boards approved this study at each site. From the original sample, we included all participants who had structural MRI scans and virtually complete neuropsychological testing. Five participants were excluded due to poor quality imaging. The final sample included 80 individuals diagnosed with schizophrenia (62 males, 18 females) and 116 controls (69 males, 47 females). Self-stated ethnicity of participants was 82.1% Caucasian, 9.2% African American, and 8.7 “other” (Asian American, Native American, mixed ethnicity).
A comprehensive clinical diagnostic assessment included either the Structured Clinical Interview for the DSM IV (First, Spitzer, Gibbon, & Williams, Reference First, Spitzer, Gibbon and Williams1997) or the Comprehensive Assessment of Symptoms and History (CASH) (Andreasen, Flaum, & Arndt, Reference Andreasen, Flaum and Arndt1992). Symptoms were evaluated with the Scale for the Assessment of Positive Symptoms (Andreasen, Reference Andreasen1984b) and the Scale for the Assessment of Negative Symptoms (Andreasen, Reference Andreasen1984a). Healthy controls were recruited from the general community at each site through medical clinics and advertisements in local newspapers. Exclusionary criteria for the control group were presence of a physical or neurologic disorder affecting brain function, and lifetime history of any Axis I disorder, including substance abuse or dependence. Parental and self socio-economic status was calculated using the modified five-point Hollingshead-Redlich scale (1=highest, 5=lowest).
Cognitive Assessment
All participants were administered a comprehensive battery of neuropsychological tests assessing reading ability, verbal fluency, working memory, verbal abstraction, nonverbal reasoning, attention, and visuomotor and executive skills (see Sponheim et al., Reference Sponheim, Jung, Seidman, Mesholam-Gately, Manoach, O’Leary and Schulz2010, for details). To facilitate accurate assessment of factor structure, the entire sample of participants with neuropsychological testing (N=247) was used for a principal components analysis (PCA), although subsequent analyses reported below were limited to those with high quality DWI imaging. (Scores on the first PC from the original sample of 247 participants correlated r=.99 with scores from the first PC computed within the current, more limited sample). A total of 25 test scores were entered for each participant for the PCA (see Supplementary Table 1 in Yeo, Gangestad et al., Reference Yeo, Martinez, Pommy, Ehrlich, Schulz, Ho and Calhoun2013, for a list of specific test variables and factor loadings for each). The highest factor loadings were from the WAIS III Block Design (.64), Letter Number Sequencing (.52), and Vocabulary subtests (.47). Across the total number of expected data points (247 participants with 25 variables), a total of 2.4% were missing values. Missing values were replaced by the individual group mean. The first principal component captured 34.11% of test variance and was used in all analyses as a measure of GCA. This measure of GCA has two main virtues. First, it provides a comprehensive assessment of the generalized deficit, that is, the common variance underlying all cognitive tests. Second, the “same” principal component emerges from different test batteries, facilitating comparisons across studies, even if they use different tests (Johnson, Bouchard, Krueger, McGue, & Gottesman, Reference Johnson, Bouchard, Krueger, McGue and Gottesman2004).
Neuroimaging
Structural images were obtained with an in-plane resolution of 0.625×0.625 mm, a slice thickness of 1.5 mm, and a flip angle of 7 degrees. Other parameters differed across sites. Two sites (MGH, NM) used a Siemens 1.5-Tesla scanner with TR=12, TE=4.76, and NEX=1, but 3 separate images were collected and averaged. At the University of Iowa a GE 1.5-Tesla Genesis Signa scanner with TR=20, TE=6, and NEX=3 was used. The University of Minnesota site used a Siemens 3-Tesla scanner with repetition time (TR)=2530, inverse time (TI)=1100, echo time (TE)=3.79, and number of excitations (NEX)=1. All DWI images were acquired on Siemens 3-Tesla scanners with 2-mm isotropic resolution. MGH used a Siemens Sonata with TR=8900, TE=80, B values of 0 and 700, NEX=1, and NEX=60 directions. Iowa used a Siemens Trio with TR=9500, TE=90, B values of 0 and 1000, and NEX=4 and 6 directions. In New Mexico a Siemens Sonata with TR=9800, TE=86, B values of 0 and 1000, and NEX=4 and 12 directions was used. Minnesota used a Siemens Trio with TR=10 500, TE=86, B values of 0 and 1000, and NEX=2 and 12 directions. To minimize the impact of using different imaging parameters across sites, all graph metrics (see below) were normalized within site, rendering the means and standard deviations equal across sites.
Processing of the DWI data was conducted as described in detail elsewhere (de Reus & van den Heuvel, 2014; Ryman, van den Heuvel et al., 2014; van den Heuvel & Sporns, Reference Van den Heuvel and Sporns2011). Eddy current induced distortions and the smaller, gradual motion through the scan were corrected with an affine transform and mutual information cost index. Participants with greater than 10% of the volumes removed were not included because of the possible bias in their calculated diffusion parameters. The motion sensitivity of each participant was characterized by the mean frame-displacement (FD) index calculated across all images. To ensure group differences were not due to differences in motion, we examined group differences in FD and correlations of FD with graph metrics.
The T1 images were segmented and used for anatomical references and for the selection of the nodes of the brain network. Freesurfer version 5 was used to automatically segment the subcortical structures and parcellate the reconstructed cortical surface of the T1 images (http://surfer.nmr.mgh.harvard.edu/; (Fischl et al., Reference Fischl, van der Kouwe, Destrieux, Halgren, Segoone, Salat and Dale2004). This resulted in 82 (+ brain stem) distinct cortical and subcortical brain regions segmented based on the Deskian-Killiany Atlas. These represent the nodes of the individual brain networks.
Connectome Reconstruction
Connectome reconstruction included the following steps, described in detail elsewhere (Ryman, van den Heuvel et al., Reference Van den Heuvel, Kahn, Goñi and Sporns2014). For each participant, the brain network was described mathematically as a graph consisting of 82 brain nodes and a set of connections between them, or streamlines. To obtain streamlines, diffusion weighted images were realigned and registered to the first b=0 image and corrected for eddy-current distortions. A robust tensor fitting method was used and the level of fractional anisotropy (FA) was computed (Chang, Jones, & Pierpaoli, Reference Chang, Jones and Pierpaoli2005). The white matter tracts of the brain networks were reconstructed by using the deterministic fiber tracking, based on the FACT (fiber assignment by continuous tracking) algorithm using an FA threshold of 0.2 and an angular threshold of 45 degrees (Mori & van Zijl, Reference Mori and van Zijl2002). The number of streamlines between i and j was taken as the connectivity strength between nodes i and j in the network and included in the weighted connectivity matrix. Edges comprising fewer than 10 streamlines were considered potentially spurious and were deleted from the connection matrix (Hagmann et al., Reference Hagmann, Cammoun, Gigandet, Meuli, Honey, Wedeen and Sporns2008).
Graph Metrics
Several graph metrics were calculated, quantifying the overall connectivity strength, efficiency, characteristic path lengths, clustering, and modularity of the network for each subject using MATLAB version 2012a and the Brain Connectivity Toolbox. For additional detail on calculations of these metrics with the Toolbox, refer to Rubinov and Sporns (Reference Rubinov and Sporns2010). First, weighted connectivity strength (S) of each node Si in the individual network provides information about the total level of the overall connectivity of a network. The formula connectivity strength of node i was:
 $$S_{i}^{{weighted}} =\mathop{\sum}\limits_{j\in N} {w_{{ij}} .} $$
The overall connectivity of the network is given by:
 $$S^{{weighted}} ={1 \over N}\mathop{\sum}\limits_{i\in N} {S_{i} } .$$
By taking this approach, the connectivity-weighted measure reflects both the number of connections in the whole brain and the fidelity of those connections quantified by the number of streamlines (NOS). Overall connectivity influences most other graph metrics, so to minimize multiple colinearity and maximize independence, we statistically removed variance related to overall connectivity from all other graph metrics with regression procedures. Paths in a network are sequences of distinct links between nodes that represent the route of information flow. Characteristic path length (L) represents the average shortest path length across the network, estimating the potential for functional integration between relatively distant brain regions (Watts & Strogatz, Reference Watts and Strogatz1998). Weighted global efficiency provides information about the integration of information from distributed brain regions (Latora & Marchiori, Reference Latora and Marchiori2001). It is calculated as the average inverse shortest path length from region i to all other regions j in the network, and in contrast to the closely related metric of characteristic path length, shorter connections are relatively more important. The weighted clustering coefficient of the network (C) and of each node is used to quantify the segregation in the brain, allowing for specialized processing to occur within densely interconnected regions. Modularity (Q) also quantifies the extent of segregation by characterizing the ratio between intra-module connectivity to the inter-modular connectivity; high Q thus indicates greater intra-modular connectivity and greater segregation between modules.
To evaluate the impact of the difference across scanning sites in number of diffusion directions, we performed rank order correlations between graph metrics and the number of diffusion directions. Two were significant: r=−.14 (p=.04) for clustering and r=−.24 (p=.001) for local connectivity. All graph metrics were then normalized within site, rendering the means and standard deviations equal across sites. After normalization, these two correlations dropped to r=.02 and r=.03, respectively (both ns). All analyses below used measures normalized across sites.
RC Detection
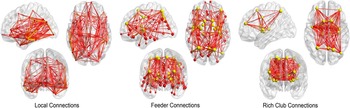
A normalized RC coefficient Φ w norm was computed by comparing the weighted RC parameter Φw(k) relative to the RC parameter of a set of ten-thousand comparable random networks of equal size and degree sequence (Colizza, Flammini, Serrano & Vespignani, Reference Colizza, Flammini, Serrano and Vespignani2006; McAuley, da Fontoura Costa, & Caetano, Reference McAuley, da Fontoura Costa and Caetano2007). The network was determined to have a RC organization if Φw norm(k) >1, for a continuous range of k. To assess statistical significance of the results, permutation testing was used. The normalized RC coefficient Φw norm(k) was assigned a p value by computing the percentage of random values that were found to be more extreme than the observed RC coefficient Φw norm (k). All tests were conducted using Bonferroni-adjusted α-levels of 0.0025 per test (0.05/tests performed). To understand how different connections contributed to GCA, nodes of the group network were divided into RC and non-RCnodes, and edges were divided into three topological categories (see Figure 1): (i) “RC connections” linking RC nodes, (ii) “feeder connections” linking RC nodes to non-RC nodes, and (iii) “local connections” linking non-RC nodes to each other.
The three major types of global connectivity: local connections (i.e., those between non-rich club nodes), feeder connections (from local nodes to RC nodes), and RC connections (those among RC nodes).

Genetic Analyses
Details on the CNV measure, based on the number of rare deletions, was previously described in Yeo, Gangestad et al. (Reference Yeo, Gangestad, Liu, Ehrlich, Thoma, Pommy and Calhoun2013) and Yeo et al., (Reference Yeo, Gangestad, Walton, Ehrlich, Pommy, Turner and Calhoun2014), so will be only briefly reviewed here. For details on the analysis pipeline and quality control see (Chen, Liu, & Calhoun, Reference Chen, Liu and Calhoun2010, Reference Chen, Liu and Calhoun2011). DNA extracted from blood samples was genotyped using the Illumina HumanOmin1-quad chip, including 1,140,419 markers. CNV segments were excluded if they failed the signal-to-noise ratio check, overlapped with telomere or centromere more than 50%, or were smaller than 500 base pairs. Only deletions occurring in less than 3% of participants were included in this analysis. The total number of these rare deletions exceeding 500 base pairs in length was summed, providing an overall measure of rare deletion number. Due to possible differences in CNV frequencies, and the small number of available participants of African-American or Asian-American descent, these genetic analyses were restricted to Caucasian individuals with high quality data (controls N=101; patients N=56).
Analysis Strategy
To minimize the impact of multiple comparisons (1) all graph metrics were examined concurrently in a multivariate format, thus taking into account the number of predictor variables and their covariation, and (2) only significant effects were subjected to follow-up evaluation. We first examined the overall relationships between global network parameters and GCA, covarying sex, age, and group (diagnosis) in a single multivariate analysis. We included interaction terms between group and each graph metric to evaluate possible group differences in the relationship between GCA and a given graph metric.
These GLM analyses revealed the importance of overall connectivity, so we then pursued more fine-grained connectivity analyses comparing local connections, connections among RC nodes, and feeder connections between local and RC nodes. Next, we examined whether rare deletion burden was related to network features found to predict GCA.
Results
Descriptive Statistics and Group Differences in Global Network Parameters
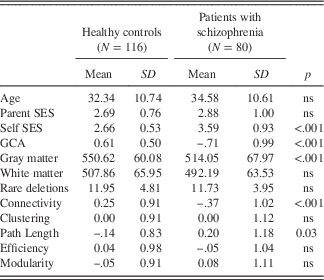
Participants in the patient group had been diagnosed with schizophrenia for a mean of 12.67 years [standard deviation (SD)=11.16]. Mean scores for symptom scales were: Positive symptoms=4.64 (2.76), Negative symptoms=7.62 (3.92), and Disorganized symptoms=1.78 (1.90). Table 1 presents basic demographic data and network parameters by group. The patient group was slightly older and there were more men than women in the HC sample (60%; N=69 vs. N=47) and in the patient sample (79%; N=62 vs. N=18). The number of gradient directions differed across sites. To evaluate the significance of this factor we evaluated, across all participants, rank order correlations of graph metrics with the number of gradient directions used across all sites. Two were significant (p<.05), clustering at r=−.15 and local connectivity at r=−.24. After normalizing data by site, however, these two correlations dropped to r=−.02 and r=.03, resp., both non-significant. No group differences were found for FD by independent samples t-test (HC=.281 (SD=.132); SP=.253 (SD=.145); p=.16). Nor was FD related to any graph metric (all r values<.07).
Descriptive statistics on demographic variables and global network parameters, by group

Note. For rare deletions N=101 (controls) and N=56 (patients, see text). All network variables are expressed as Z-scores. Clustering, characteristic path length, efficiency, and modularity were adjusted for overall connectivity. Gray matter and white matter variables reflect volume in cubic ml. Participant numbers for the rare deletion genetic variable were N=101 (controls) and N= 56 (patients).
GCA=general cognitive ability.
Group differences were analyzed with a multivariate general linear model (GLM); dependent variables were global connectivity and adjusted (for overall connectivity) measures of clustering, path length, efficiency, and modularity. Age, sex, group, and the interaction of group and sex were entered as predictors. Group (F(5,187)=4.92; p<.001, partial eta squared=.12) and age (F(5,187)=2.74; p=.02, partial eta squared=.07) effects were found. Regarding group differences, two reached significance -- reduced overall connectivity (F(1,187)=17.54; p<.001, partial eta squared=.08) and increased characteristic path length (F(1,187)=5.38; p=.02, partial eta squared=.03) among individuals with schizophrenia. There were no significant effects for sex or sex×group interactions. These effect sizes, as well as those reported below, varied little when results from any one research site were not included in analyses.
Relationships between Global Network Parameters and GCA
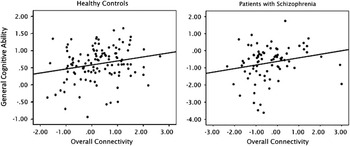
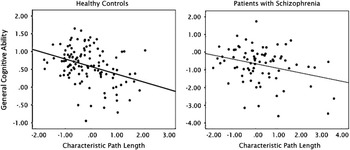
To reveal relationships of global graph metrics with GCA across groups, we performed a GLM analysis in which we predicted GCA with global connectivity, and adjusted (for overall connectivity) measures of clustering, efficiency, path length, and modularity. Covariates were sex, age, and group; the model included interactions of group with each network variable. Age and group effects were significant. Two predictors of GCA were also significant. Among the graph metrics, greater overall connectivity (F(1,182)=6.43; p=.01, partial eta squared=.03; see Figure 2) and shorter characteristic path length (F(1,182)=10.65; p=.001, partial eta squared=.06; see Figure 3) predicted greater GCA. No group×network variable interactions were significant as effect sizes for graph metrics were quite similar (for global connectivity, partial eta squared was .041 in controls and .031 in patients, whereas for path length partial eta squared was .064 in controls and .059 in patients). We performed a mediation analysis (Monte Carlo method, Selig & Preacher, Reference Selig and Preacher2008) to determine if group differences in graph parameters mediated group differences in GCA. Partial mediation (Selig & Preacher, Reference Selig and Preacher2008) was found for overall connectivity (p<.05), but not for characteristic path length.
Scatterplot of the relationship between global connectivity and general cognitive ability (GCA) across both healthy controls (left side, r=.21; p=.02) and patients with schizophrenia (right side, r=.21; p=.06).

Scatterplot of the relationship between characteristic path length and general cognitive ability (GCA) across both healthy controls (left side, r=−.35; p<.001) and patients with schizophrenia (right side, r=−.30; p=.008).

To determine the overlap of significant network variables with total white matter volume we performed partial correlations (controlling for sex, age, and group), revealing that total white matter volume was related to overall connectivity (r=.34; p<.001), and a trend was noted for characteristic path length (r=−.14; p=.06).
A Closer Look at Connectivity -- RC versus Local Connections
Consistent with previous reports (van den Heuvel & Sporns, Reference Van den Heuvel and Sporns2011), the structural network of the human cerebral cortex and subcortical regions showed a RC organization for a range of node degrees from k=8 to k=24 as reflected by Φ w norm (k)>1 and Φw(k) significantly greater than Φ random(k) (p<.001, Bonferroni corrected, 10,000 permutations; Figure 1a). The RC (k=20) was comprised of the thalamus, caudate, putamen, pallidum, precentral, rostral middle frontal, superior frontal, superior parietal, precuneus (right), inferior parietal (left), and the insula (all bilateral unless specified). Given the significance of global connectivity, we pursued exploratory analyses of different topological types of connectivity. Three additional types of connectivity were computed: feeder connections linking RC nodes to non-RC nodes, connections among RC nodes, and local connections, i.e., those between non-RC nodes. First, we evaluated group differences in these parameters in a multivariate GLM analysis, controlling for sex, age, and global connectivity. None were significant after controlling for overall connectivity. To evaluate the importance of these three metrics for GCA, we conducted a univariate GLM that included covariates (overall connectivity, age, sex), as well as the three topological types of connectivity, group, and the interaction of group with the three connectivity metrics. As before, the overall connectivity variable was significant, as was the effect for local connections (F(1,185)=19.02; p≤.001, partial eta squared=.09) and RC connectivity (F(1,185)=11.78; p<.001, partial eta squared=.06). Feeder connectivity was not significant, and no interactions were observed between group and graph metrics.
Rare Deletion Burden and Global Network Parameters
On the subsample with high quality genetic data (101 controls, 56 patients), a multivariate GLM was performed in which the four global network features related to GCA (overall connectivity, characteristic path length, local connectivity, and RC connectivity) served as dependent variables. Factors included in the model were group, sex, age, rare deletion burden, and the interaction of rare deletion burden with group. The main effect of uncommon deletion burden on these four variables was significant (F(4,148)=2.66; p=.035, partial eta squared=.07), but the interaction with rare deletion burden with group was not. At the univariate level only characteristic path length was significantly predicted by rare deletion burden (F(1,151)=5.46; p=.02, partial eta squared=.04). In the combined sample, greater deletion number predicted greater longer characteristic path length, which in turn predicted lower GCA.
Discussion
Greater overall connectivity and shorter characteristic path length predicted higher GCA across groups. Across analyses we found no significant interactions between group and network variables, suggesting that variations in basic network design have similar implications for GCA across groups. Nonetheless, individuals with schizophrenia showed less connectivity and greater path length. A more fine-grained analysis of connectivity indicated the importance of local connections and RC connections, but not feeder connections. In the subsample with genetic data, a greater burden of uncommon deletions predicted longer characteristic path length.
Network Features and GCA
The present results join a rapidly growing body of research demonstrating the importance of specific network design characteristics for GCA. In comparing our results to those from other studies, two issues should be kept in mind. First, our measure of cognitive ability reflects “g” or GCA, rather than Full Scale IQ (e.g., Li et al., Reference Li, Liu, Li, Qin, Li, Yu and Jiang2009) or a reading-based estimate of premorbid IQ (e.g., Zalesky et al., Reference Zalesky, Fornito, Seal, Cocchi, Westin, Bullmore and Pantelis2011). Although these cognitive variables are highly correlated, some researchers have emphasized psychometric and neural differences among these and related measures (Blair, Reference Blair2006; Haier et al., Reference Haier, Colom, Schroeder, Condon, Tang, Eaves and Head2009). Second, our results emerge from structural analysis of diffusion-weighted imaging, rather than functional data, so some difference in results between the two approaches might be anticipated. Nonetheless, a broad consensus has emerged across both structural and functional network studies that both overall connectivity and shorter characteristic path length are significant predictors of GCA (e.g., van den Heuvel, Stam, Kahn, & Hulshoff Pol, Reference Van den Heuvel, Stam, Kahn and Hulshoff Pol2009). Although the characteristic path length and global efficiency measures used here are correlated, the former captured more variance, suggesting that the longer network connections preferentially tapped by characteristic path length were relatively more important (Rubinov & Sporns, Reference Rubinov and Sporns2010). Clustering and modularity did not emerge as important for GCA, consistent with earlier functional studies (van den Heuvel et al., Reference Van den Heuvel, Stam, Kahn and Hulshoff Pol2009), but in contrast to other structural studies (Li et al., Reference Li, Liu, Li, Qin, Li, Yu and Jiang2009; Zalesky et al., Reference Zalesky, Fornito, Seal, Cocchi, Westin, Bullmore and Pantelis2011). Zalesky et al. (Reference Zalesky, Fornito, Seal, Cocchi, Westin, Bullmore and Pantelis2011), however, did not identify any significant network predictors among patients, but this might reflect their use of a measure tapping premorbid, rather than current GCA. The absence of interactions of network metrics with group demonstrates that the basic design principles conferring greater GCA do not differ across healthy controls and individuals with schizophrenia.
Not all types of connectivity were equally important. Greater connectivity among RC nodes and among local nodes predicted higher GCA, but connectivity between RC and local nodes (feeder connections) did not. As the RC is thought to facilitate efficient information transfer via the large proportion of network connections that pass through RC hubs (van den Heuvel and Sporns, Reference Van den Heuvel and Sporns2011), these results directly link the connections between hubs as important to GCA. Furthermore, the RC connections are known to link resting state networks (van den Heuvel & Sporns, 2011), highlighting the role of these connections in integrating information across segregated networks. In addition to the RC connections, this study also found greater local connectivity as predictive of greater GCA. The local connections are likely involved in within network communication, enabling regional computation in specialized regions. To our knowledge, these are the first data to indicate directly the importance of the RC and local connections for GCA.
Although cognitive ability increases dramatically during childhood, the developmental trajectory may be established quite early (Raznahan, Greenstein, Lee, Clasen, & Giedd, Reference Raznahan, Greenstein, Lee, Clasen and Giedd2012; von Ehrenstein, Mikolajczyk, & Zhang, Reference Von Ehrenstein, Mikolajczyk and Zhang2009). Network features correlated with GCA (overall connectivity, path length) should show developmental increases that parallel, or anticipate, cognitive development. Between the ages of seven and 31, functional long-range connections strengthen and short-range connections weaken, but the “small world” nature of the network (i.e., a design allowing efficient local processing and long range connectivity) remains stable (Fair et al., Reference Fair, Cohen, Power, Dosenbach, Church, Miezin and Petersen2009). Small-worldness is defined by both clustering and characteristic path length. Although we found clustering was not related to GCA, path length did predict GCA. Perhaps the decrease in path length that facilitates broad cognitive development occurs earlier in life than age seven, influencing a developmental trajectory that continues through adolescence. In support of this notion Bathelt and colleagues reported that functional network analysis revealed decreasing path length in the two to five age range (Bathelt, O’Reilly, Clayden, Cross, & de Haan, Reference Bathelt, O’Reilly, Clayden, Cross and de Haan2013).
Group Differences
The brain networks of individuals with schizophrenia and healthy controls were significantly different, consistent with several prior studies (see van den Heuvel & Fornito, Reference Van den Heuvel and Fornito2014, for a recent review). Reduced global connectivity is probably the most central group difference. After taking global connectivity into account, we identified no group differences in clustering or efficiency, consistent with Zalesky et al. (Reference Zalesky, Fornito, Seal, Cocchi, Westin, Bullmore and Pantelis2011). Path length, however, differed across groups after covarying for global connectivity. Thus, we have obtained evidence for two independent network alterations in schizophrenia, and, furthermore, each of these measures contribute to GCA. Overall connectivity was related to total white matter volume, but path length was not, suggesting that different developmental processes may contribute to these effects. Our results provide the most direct evidence to date that global network variations contribute to the GCA deficit of schizophrenia.
Genetics
Results indicated that the total burden of rare deletions, a genetic measure putatively linked with overall mutation load (Yeo & Gangestad, Reference Yeo and Gangestad2015) may influence characteristic path length. In prior reports on this same sample we have found that greater deletion burden predicts lower GCA in patients but not controls (Yeo, Gangestad et al., Reference Yeo, Martinez, Pommy, Ehrlich, Schulz, Ho and Calhoun2013; Yeo et al., Reference Yeo, Gangestad, Walton, Ehrlich, Pommy, Turner and Calhoun2014). As groups did not differ in deletion burden, however, we suggested that individuals with schizophrenia are especially vulnerable to the effects of this adverse genetic variation, just as they may be more sensitive to a variety of environmental stressors (e.g., low SES, Yeo, Martinez et al., Reference Yeo, Martinez, Pommy, Ehrlich, Schulz, Ho and Calhoun2013). One possible pathway by which deletion burden impacts GCA in schizophrenia may be by increasing characteristic path length early in development, leading to a less robust network, vulnerable to environmental and genetic stressors. Of interest, behavior genetic studies have shown that independent genetic factors contribute to white matter volume and network metrics (Bohlken et al., Reference Bohlken, Mandl, Brouwer, van den Heuvel, Hedman, Kahn and Hulshoff Pol2014). Consistent with this observation, the specific genetic factor of rare deletion burden was related to path length (this study), but not to white matter volume (Yeo, Gangestad et al., Reference Yeo, Martinez, Pommy, Ehrlich, Schulz, Ho and Calhoun2013). These preliminary observations suggest that network metrics may serve as endophenotypes and help to unravel the diverse genotype-phenotype mappings important for the syndrome of schizophrenia.
Limitations
Two important limitations must be considered in interpreting our results. Most importantly, DWI imaging parameters differed across sites. Although we statistically controlled for the impact of site in all analyses, and neither movement artifact nor variation in the number of gradient directions appeared to confound results, site differences may nonetheless impact our findings in subtle ways. Also, reliability of tractography-based measures of path length is less than optimal, even when data are acquired at a single site with 4T high-angular resolution diffusion (HARDI) scans (Dennis et al., Reference Dennis, Jahanshad, Toga, McMahon, de Zubicaray, Martin and Thompson2013). However, our results are generally consistent with studies using a single scanner, suggesting that these limitations may not have obscured identification of important relationships.
Conclusions
The network features of characteristic path length and overall connectivity were related to GCA, and these relationships did not differ across groups. Group differences in these two features were significant, but group overlap is substantial and these differences likely represent only a portion of the neuropathology underlying the disorder. Connectivity among RC and local nodes were most central to GCA. A specific genetic feature previously linked with GCA in patients with schizophrenia, the total burden of rare copy number deletions, was found to predict the most important correlate of GCA – characteristic path length. Thus, we have provided very preliminary evidence for a pathway from genomes to endophenotypes to cognition in schizophrenia. Our graph analyses were intentionally broad, aimed at characterizing global network features, as we thought these might best map onto a global cognitive variable, GCA. Future studies may profitably pursue more node-specific analyses with more discrete cognitive phenotypes.
Acknowledgments
The authors report no conflicts of interest. The first author gratefully acknowledges the training and mentoring provided by Drs. Edith Kaplan and Norman Geschwind. This work was supported by grants from the Department of Energy under Award Number DE-FG02-08ER64581, and the National Institute Health (grants 5P20RR021938, 1RC1MH089257, and R01EB005846. Authorship: R.A.Y. developed the manuscript concept. M.V.H., S.G.R., R.E.J., and M.D.R. provided graph theory expertise. J.P., A.R.M., S. E., S.C.S., E.R.M., D.M., B.C.H., S.R.S., and V.D.C. all contributed to study design. All authors contributed to and approved the final manuscript.
Supplementary Material
To view supplementary material for this article, please visit http://dx.doi.org/10.1017/S1355617715000867