


I. INTRODUCTION
Advanced nanoscale CMOS technologies have been largely used to meet the needs of millimeter-wave band applications such as WLAN (60 GHz) and automotive radar (77 GHz) for collision avoidance or microwave imaging, taking the advantages of low cost, low power consumption, compact layout size, and high-level integration into account [Reference Doan, Emami, Niknejad and Brodersen1, Reference Chan and Long2]. Meanwhile, these silicon-based integrated technologies (CMOS 65, 40, and 28 nm) provide the opportunity to integrate active functions such as power amplifiers (PA), thanks to the performance of active components with transition frequency f T and oscillation frequency f max both above 200 GHz [Reference Hongmei3, Reference Gogineni, Alamo and Putnam4]. The design of millimeter-wave submicron CMOS power amplifiers is, however, still challenging due to the low-voltage supply (1.2 V) and the significant losses in the passive elements such as transmission lines for matching issue, especially at millimeter-wave frequencies. The low-quality factor of conventional transmission lines at the operating frequency limits the power gain and saturated output power.
Recently, the Slow-wave Coplanar Waveguides (S-CPW) transmission lines have drawn special attention of scientific community because of its proved potential to obtain high-quality factors [Reference Cheung and Long5–Reference Yang, Qian, Coccioli and Itoh10], while providing a wide range of realizable values of characteristic impedances (typically 20–75 Ω). Consisting of a conventional coplanar CPW Transmission line (Tline) and a shielded plan formed by floating metallic strips, the S-CPW Tlines become a promising candidate for miniaturization and insertion loss improvement [Reference Kaddour6, Reference Franc9]. In 2008, the S-CPW Tlines were first implemented in a low-noise amplifier (LNA) design, demonstrating a good noise figure performance in the K-band range [Reference Sayag11].
This paper describes the potential of S-CPW Tlines for the design of millimeter-wave power amplifiers in an advanced 40 nm CMOS technology. In Section II, the optimization of the Tlines, including S-CPW and conventional Thin Film MicroStrip transmission lines (TFMS) will be carried out. Section III is devoted to discuss transistor layout considerations. Finally, in Section IV, two versions of a power amplifier designed with these two different types of Tlines are presented to highlight the contribution of S-CPW Tlines on the overall performance of Class-A power amplifiers.
II. PASSIVE STRUCTURE: TRANSMISSION LINES
A) TFMS transmission lines
TFMS (Thin Film MicroStrip) Tlines are widely used in the design of millimeter-wave power amplifiers in CMOS technologies [Reference Quemerais, Moquillon, Pruvost, Fournier, Benech and Corrao12–Reference Law and Pham18] because of their implementation simplicity. However, the improvement of performance which can be provided by this kind of Tlines is very limited because of its poor quality factor Q (e.g. Q < 10 in [Reference Quemerais, Moquillon, Pruvost, Fournier, Benech and Corrao12]), especially at high frequency. For comparison issue, microstrip Tlines presenting the state-of-the-art performance are simulated with the model developed in [Reference Quemerais, Moquillon, Fournier, Benech and Corrao19]. As shown in Fig. 1, the signal conductor strip of the simulated TFMS Tline is made of layer metal 7 and layer AP, the ground plane consists of metal 1 and metal 2 so as to shield completely the high-resistivity silicon substrate [Reference Quemerais, Moquillon, Fournier, Benech and Corrao20]. Figure 1(a) shows the cross-section of the 8-metal-layer 40 nm CMOS process from STMicroelectronics foundry used for the design of TFMS and S-CPW Tlines. The Back End Of Line (BEOL) consists of seven copper metals and an aluminum layer (AP). The structure of the classical TFMS Tline used to carry out the amplifiers’ matching network is shown in Fig. 1(b).
Schematic description of metal interconnects of 40 nm CMOS technology, (b) structure of a TFMS Tline.

B) S-CPW transmission lines
Figure 2 shows the structure of the proposed topology of slow-wave Tline implemented in CMOS technology. This S-CPW Tline consists of a conventional coplanar waveguide with patterned metallic strips located between the CPW plan and the silicon substrate. These shielding strips are arranged periodically and perpendicularly to the direction of propagation. To ensure the entire isolation from the nearby elements, a new kind of S-CPW Tlines topology, including isolation barriers to shield transversely the propagation structure, is proposed in this paper. The isolation ground planes are realized by stacking all available metal levels from Metal 1 to the top metallic level AP.
3D schematic view of the structure for S-CPW Tline in 40 nm CMOS technology (CPW line on the Metal 2 to Metal 7 + AP and floating strips on Metal 1).

1) PRINCIPLE
The effective relative permittivity denoted as ɛreff is defined in equation (1), with c 0 the speed of light in vacuum, L l and C l the inductance and capacitance per unit length of Tline, respectively.

The increase in the capacitance, due to the added capacitive effect between the CPW Tline and floating metallic strips, leads to a high effective relative permittivity. The electrical field is mainly confined between the conventional coplanar waveguide and the floating strips, while the spacing between the metallic strips allows the magnetic field going through the substrate, maintaining the value of inductance per unit length L l as that of a conventional CPW TLine. The increase in effective relative permittivity then implies an increase in the propagation constant β as described in equation (2), and causes a decrease in physical length of the Tline l for a given electrical length θ by equation (3).


Moreover, the quality factor Q (see equation (4)) reflecting the insertion loss of a Tline for a given phase shift is significantly improved.

2) OPTIMIZATION OF S-CPW TRANSMISSION LINES
In the S-CPW structure, in order to reduce the conductor losses, the CPW Tline including signal and ground conductor is achieved by stacking all available metal layers except for the layer Metal 1. The floating metallic strips are laid on Metal 1 because the extreme low thickness of layer M1 reduces the losses due to the eddy current. The width of signal strip W, signal-to-ground gap G, width of ground planes W g, total length of each floating strip W t of the measured S-CPW line are 7, 19.5, 27, and 66 µm, respectively. The floating strip length and spacing, respectively, denoted as SL and SS, have been chosen as the minimum values allowed by the technology (SL = 0.1 µm, SS = 0.55 µm). Previous studies carried out in [Reference Kaddour6, Reference Franc9] have indicated that the insertion loss can be reduced by applying the minimum metal density of the floating strips.
C) Performance comparison of transmission lines
Slow-wave Tlines were simulated with the 3D EM simulation tool ANSOFT HFSS. To simplify the EM simulation structure and to save the computing time and memory, a method for calculating the equivalent relative permittivity of the multi-layer dielectric developed in [Reference Siligaris, Mounet, Reig and Vincent21] was applied.
Figure 3 shows the comparison of the characteristics of Tlines used to design the power amplifiers presented in this paper. For S-CPW Tline, measurements are compared to electromagnetic simulations. Concerning TFMS Tline, the characteristics come from a proposed model [Reference Quemerais, Moquillon, Fournier, Benech and Corrao19] based on previous measured TFMS TLines. The geometric dimensions of the S-CPW Tline have been given in the previous section. The width (W = 13 µm) of the microstrip Tline was chosen in order to target the same characteristic impedance as the S-CPW Tline (Z c ≈ 25 Ω). Measurements of the S-CPW Tlines were carried out up to 110 GHz with a LRRM (Line Reflect Reflect Match) calibration carried out on a network analyzer ANRITSU ME7808C. The characteristic parameters such as the effective relative permittivity ɛreff, attenuation coefficient α and quality factor Q were extracted using the method described in [Reference Ferrari, Flechet and Angenieux22], while the characteristic impedance Z c was obtained applying another method developed in [Reference Mangan, Voinigescu, Ming-Ta and Tazlauanu23].
Performance comparison of the S-CPW and microstrip Tlines: (a) characteristic impedance Z c, (b) effective relative permittivity ɛreff, (c) attenuation constant α, and (d) quality factor Q.

The S-CPW shows a measured effective relative permittivity about 12 times greater than that of the TFMS at 60 GHz (ɛreff = 48 for S-CPW against 3.9 for TFMS), resulting in a reduction factor of Tline length greater than 3.5. Thanks to the increased effective relative permittivity (see Fig. 3(b)), the measured quality factor Q of the S-CPW Tline, shown in Fig. 3(d), is significantly improved compared to the microstrip Tline (about twice at 60 GHz), despite of a higher measured attenuation loss per unit length α (about 50% higher at 60 GHz).
Let us note the difference between measured and simulated characteristics of the S-CPW TLine. The characteristic impedance exhibits a significant dispersion, a discrepancy of about 20% is observed for the relative effective permittivity of S-CPW, and the simulated attenuation constant is underestimated. These discrepancies are currently under investigation. Concerning the relative effective permittivity, two causes seem to be at the origin of this difference. First of all, as explained above, to simplify the EM simulation of the S-CPW structures, an equivalent relative permittivity was considered for the dielectric layers by using the method developed in [Reference Siligaris, Mounet, Reig and Vincent21] for multi-layer dielectric TFMS structures. Secondly, since the thickness separating the CPW and the floating strips, in between layers M2 and M1, is very thin in this technology node, the absolute precision of oxide deposition greatly impacts this thickness precision and consequently the one of the effective relative permittivity. Concerning the attenuation constant discrepancy, via holes were not taken into account in the EM simulations to model the stack of the CPW put on the shielded plan of S-CPW. This could explain the underestimation of the attenuation constant.
For the sake of clarity, the measurement results of the S-CPW-based PA are compared in Section IV to both EM simulation, and post-simulation taking into account the S-CPW-measured characteristics.
III. MILLIMETER-WAVE TRANSISTOR LAYOUT AND DESIGN RULES
The layout of the transistor used in the PAs is shown in Fig. 4. A multi-fingers topology was used to reduce the S/D junction area and the gate resistance. Each drain access of transistor is composed of three stacked metal layers (Metal 1, Metal 2 and Metal 3) to maximize the current flow per finger, meanwhile respecting electromigration rules at 105°C. The number of stacked layers is limited by the parasitic gate-drain capacitance C gd. The extrinsic model of the transistor taking into account access resistances and parasitic capacitances is obtained, thanks to the post-layout extraction tool (PLS).
2D view of transistor layout.

A) Determination of W f
To determine the optimum value of the width W f of each finger, two rules should be taken into consideration as in [Reference Quemerais24]. Firstly, the maximal current flow I max as shown in Fig. 4 should respect electromigration rules limit at 105°C, i.e. I max = 0.5 mA/finger. Meanwhile, the amplifier is biased at a current density corresponding to the maximum transition frequency f T (i.e. 0.35–0.4 mA/µm) [Reference Chalvatzis, Yau, Aroca, Schvan, Ming-Ta and Voinigescu25–Reference Boots, Doornbos and Heringa27] to improve the linearity and maximize the saturated output power. The two previous conditions lead to an optimal width W f = 1.3–1.5 µm (=(0.5 mA)/(0.35–0.4 mA/µm)). Finally, the finger was chosen as 1.5 µm.
B) Determination of R L
The value of quiescent current for a class-A power amplifier (equation (5)) is V dd/R L, where R L is the real part of load impedance of the transistor as shown in Fig. 5:

Simplified schematic for the description of R L.

The power gain G p is defined by equation (6), with gm the transconductance of transistor and Re(z in) the real part of the input impedance of the MOS, and is proportional to the load impedance R L, while the output power P out (equation (7)) scales with 1/R L.


where V ds,sat is the saturated drain–source voltage.
The determination of optimal value of the load impedance is important to find a targeted trade-off between the power gain and maximum output power of amplifier. Furthermore, load impedance value is limited according to the electromigration rules’ constraints. As in [Reference Quemerais24], Fig. 6 shows the simulated power gain G p and the 1 dB output compression point OCP1dB plotted versus the load impedance value for a 60-µm transistor (finger width W f = 1.5 µm and number of fingers = 40).
Simulated G p and OCP1dB versus R L for 60 µm wide transistor.

For each value of R L, the input and output matching are achieved and the class-A behavior of the amplifier is guaranteed. For load impedance smaller than 50 Ω, the electromigration rules at 105°C are not respected anymore since the flowing current is greater than 20 mA (i.e. maximum value for a 40-finger transistor). To obtain a reasonable gain and a good linearity, the best choice is R L = 50 Ω, corresponding to the limit of electromigration constraint zone (shaded region in Fig. 6). For R L = 50 Ω, a simulated power gain of 7 dB and output compression point of 8 dBm can be achieved.
IV. MILLIMETER-WAVE POWER AMPLIFIERS DESIGN
A) PA topology
For performance comparison, two versions of a one stage class-A common source power amplifier operating at 60 GHz were designed. One version is implemented with S-CPW Tlines and another with TFMS Tlines as matching networks. Figure 7 shows the simplified schematic of a single-stage power amplifier using the S-CPW Tlines, including the biasing circuits.
Simplified schematic of single-stage PA using S-CPW Tlines.

The same transistor (W = 60 µm) with gate length L = 40 nm was used for both PA versions. The transistor consists of 40 gate fingers (N f = 40), each 1.5 µm wide (W f = 1.5 µm). It was biased at V gs = 0.9 V and V dd = 1.2 V, driving a current I ds (≈22 mA) corresponding to the maximum transition frequency f T (≈0.35–0.4 mA/µm) and a load impedance R L about 50 Ω for class-A biasing.
The DC blocking capacitors are 3D multifinger MOM (Metal-Oxide-Metal) structures, the value of which is 200 fF. In this case, the S-CPW Tlines with a characteristic impedance of 25 Ω were used as stubs for both input and output matching of amplifier. A low value of characteristic impedance was chosen to obtain a high Q factor, thereby minimizing the total losses in the amplifier. The length of these stubs was calculated to cancel both the imaginary part of input impedance and the output parasitic drain-bulk capacitance. In this way, inputs of the amplifiers are matched to 50 Ω and outputs are matched to R L determined previously (i.e. R L = 50 Ω). To facilitate the layout connection between the stubs and the transistor of amplifier using S-CPW Tlines, T-shaped junctions were made with the microstrip Tlines. Besides, the extrinsic MOS transistor modeling previously described and the capacitances due to the RF pads for measurement were taken into account in the simulation.
B) Simulation and experimental results
The simulation results were obtained by using the Cadence software and the simulator tool Eldo from Mentor Graphic. Figure 8 compares the simulated, measured, and post-simulated S parameters of the S-CPW-based PA. As explained above, the simulation considers the electromagnetic model of S-CPW Tline, whereas the post-simulation takes the measured performance of S-CPW Tlines into account.
Comparison of measured and simulated S-parameters of PA using stubs based on S-CPW Tlines.

The maximum simulated gain of this PA is around 6.5 dB at 59 GHz, which is 0.9 dB higher than the measured value. This can be explained by the underestimation of the simulated attenuation loss for S-CPW Tlines, as mentioned in Section II. Moreover, the 1-GHz working frequency shift between measurement and simulation results is mainly due to the EM modeling of the S-CPW Tline. Indeed, by considering the measured characteristics of the S-CPW Tlines instead of the EM model, post-simulation of the amplifier is in very good agreement with measurement: the difference in maximum power gain at 60 GHz is only 0.2 dB (5.6 dB measured), and the measured reflection parameters S 11 and S 22 are both below −10 dB between 59 and 62 GHz. This good agreement between post-simulation and measurement allows validating the extrinsic model of the transistor.
Figure 9 shows the S parameters of the TFMS-based PA. The measured maximum gain reaches 3.3 dB at 65 GHz. In comparison with simulated results, the frequency shift is due to the no-accurate simulated value of the phase coefficient β of TFMS Tlines, which were not fabricated and measured in the same run (limited by the fabrication cost). This amplifier is also broadband and the measured reflection parameters S 11 and S 22 are both below −10 dB between 59 and 65 GHz.
Comparison of measured and simulated S-parameters of PA using stubs based on microstrip Tlines (TFMS).

Figure 10 shows the measured performance difference between these two amplifiers with an increase in favor of the S-CPW-based PA with a 3.3 dB improved gain compared to TFMS-based PA. One can observe that resonances appear at low frequencies for both amplifiers. This is due to parasitic inductance of decoupling capacitors at the end of stubs in the drain access, but these resonances magnitudes are smaller than −17 dB.
Comparison of gain performance of the two power amplifiers.

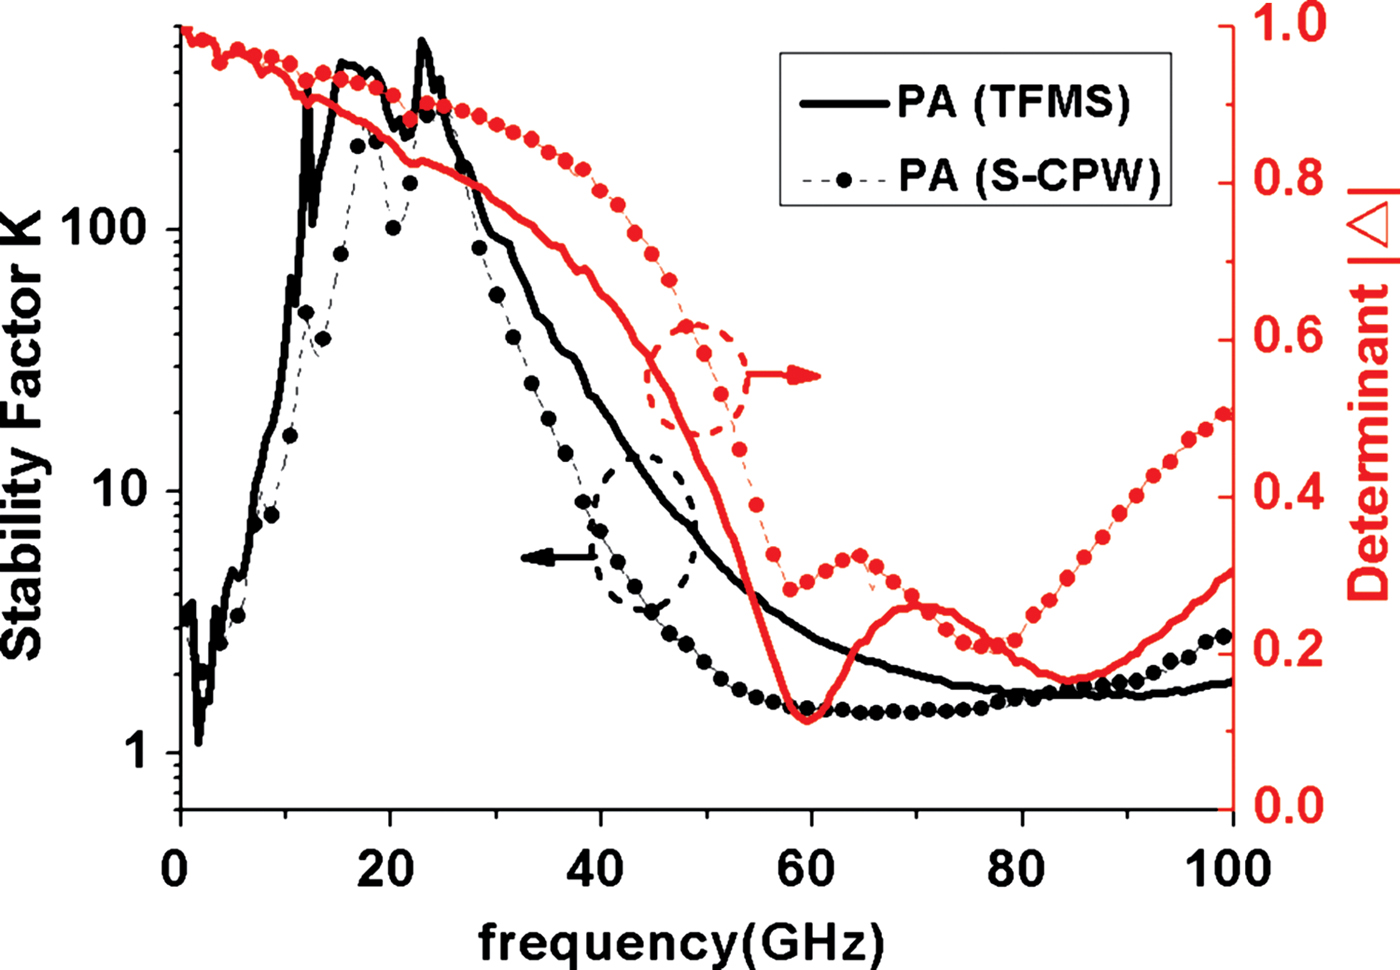
As shown in Fig. 11, the amplifiers are both unconditionally stable over the entire measured frequency range, from 40 MHz to 110 GHz, with stability factor k (equation (8)) greater than unity and absolute value of determinant |Δ| of S parameters (equation (9)) smaller than unity.


Measured stability factor and determinant of S-matrix of amplifiers.
The measured and simulated large signal results of the two amplifiers are shown in Fig. 12, showing a very good agreement for both amplifiers. At 60 GHz, the amplifier using the S-CPW Tlines presents a measured 1-dB output compression point OCP1dB of 7 dBm, only 0.4 dB lower compared to the simulation. For the amplifier using microstrip Tlines, the measured OCP1dB at 65 GHz is 5 dBm (6.5 dBm simulated). The output power at saturation (P sat) is greater than 10 and 8 dBm, respectively. The measured Power Added Efficiency (PAE) is plotted in Fig. 13. The PAE of the amplifier using the waveguides-CPW Tlines reaches 16%, while the one using microstrip Tlines is limited to 6%.
Comparison of measured and simulated OCP1dB and P sat of PA using S-CPW Tlines (@ 60 GHz) and PA using TFMS Tlines (@ 65 GHz).

Measured power-added efficiency of both amplifiers.

The performance of both 60 GHz class-A PAs are summarized and compared in Table 1.
Comparison of measured performance of the two PAs.

Another aspect of the contribution of S-CPW Tlines is shown in Fig. 14. The active area of the amplifier without PADs achieved with the S-CPW Tlines is about 20% less than that based on the microstrip Tlines. The active surfaces S die are 0.059 mm2 (S-CPW) and 0.069 mm2 (TFMS), respectively.
Die photomicrograph of the PA using TFMS Tlines (230 × 300 µm, left) and S-CPW Tlines (185 × 320 µm, right).

V CONCLUSION
S-CPW Tlines showing high-Q factor (≈18 at 60 GHz) have been used in a 40 nm bulk CMOS technology to improve the performance of power amplifiers. The performances of these S-CPW Tlines compared to conventional microstrip Tlines have been highlighted, in terms of quality factor Q and miniaturization factor since a reduction factor of 3.5 was obtained with the S-CPW Tlines. Hence, to show the contribution of these Tlines, two single-stage common-source 60-GHz power amplifiers using, respectively, S-CPW Tlines and classical TFMS Tlines were implemented in the same technology for comparison. The measured results show that the integration of S-CPW Tlines in the design of power amplifiers provides an overall improvement in performance, in terms of power gain G (5.6 dB against 3.3 dB), 1 dB output compression point OCP1dB (7 dBm against 5 dBm), PAE (16% against 6%), saturated output power P sat (10 dBm against 8 dBm) and layout size (0.059 mm2 against 0.069 mm2). Besides, the EM simulation tools and design methodology taking the extrinsic model of the MOS into account have also been validated.
ACKNOWLEDGEMENTS
The authors would like to acknowledge the “Advanced Design & Device ESD Solutions team” of STMicroelectronics for technology access and M. Nicolas Corrao for measurement support.
 Xiao-Lan Tang received the double B.Eng. degrees in 2007, respectively, in telecommunication and information engineering from Hohai University, Nanjing, China, and in electronic engineering from University of Science and Technology of Lille, France, where she received later in 2009 the M.S. degree in communication engineering. She is currently working toward a Ph.D. degree at the Institute of Microelectronics Electromagnetism and Photonic (IMEP-LAHC), Grenoble, France. Her current research interests include the design of CMOS mm-wave integrated circuits for wireless applications.
 Emmanuel Pistono received the Electronics and Microwaves Engineer degree and M.Sc. degree from the Polytechnical National Institute of Grenoble, France, in 2002 and 2003, respectively. He received a Ph.D. degree from the Polytechnical National Institute of Grenoble, France, in 2006. From 2003 to 2006, he was involved with the Microwave and Characterization Laboratory (LAHC), Le Bourget-du-lac, France. Since October 2007, he has been an Assistant Professor in Electronics with the University Joseph Fourier, Grenoble, France. He gets involved in research with the Institute of Microelectronics Electromagnetism and Photonic (IMEP-LAHC), Grenoble, France. His research interests include miniaturized tunable and passive circuits, and the integration of high-Q transmission lines in standard microelectronic technologies for mm-W applications.
 Philippe Ferrari was born in France in 1966. He received an M.Sc. Degree in Electrical Engineering in 1989 and Ph.D. degree from the “Institut National Polytechnique de Grenoble” (INPG), France, in 1992. In 1992, he joined the laboratory of microwaves and characterization of the University of Savoy, France, as an Assistant Professor in electrical engineering, and was involved in the development of RF characterization techniques. From 1998 to 2004, he was the head of the laboratory project on non-linear transmission lines and tunable devices. Since September, 2004, he has been a Professor at the University Joseph Fourier at Grenoble, France, and he continues his research at the Institute of Microelectronics Electromagnetism and Photonic (IMEP, IMEP-LAHC since 2007). His main research interest concerns tunable and miniaturized devices, such as filters, phase shifters, matching networks, power dividers, and new circuits based on slow-wave TLines. He is the author or co-author of 109 papers published in international journals or conferences. He is a member of the Editorial Board of the International Journal on RF and Microwave Computer-Aided Engineering (Wiley), of the International Journal of Microwave and Wireless Technologies (EuMA), and member of the EuMW conference Topical Program Committee.
 Jean-Michel Fournier graduated in Electronic engineering from the National Engineer School (ENSEEIHT) of Toulouse France, in 1974. He received M.S. and Ph.D. degrees from the Department of Solid-State Physic, University Claude Bernard, Lyon, in 1975 and 1979, respectively. In 1979, he joined the R&D in Microelectronic Department of France Telecom, Grenoble, where he worked on analog MOS ASIC development (High-speed video amplifiers, Gmc filters, device modeling). Between 1992 and 1996, he was in charge of the analog design group, and he focused his interest on BiCMOS process for RF applications. From 1996, he is a Professor at PHELMA (School Electronic and Physic of INPG). At IMEP-LAHC laboratory, his main research interest is the design of analog RF and millimeter wave integrated circuits in CMOS and BiCMOS technologies.



