Implications
Over the last 20 years, the continual expansion of beef-cattle farm size and the continual drive for greater labour productivity have led, for the same outputs, to greater use of off-farm resources (inputs and capital) to the detriment of better use of value-adding on-farm resources. This loss in technical production-system efficiency, correlated to the increase in farm size, should prompt a critical top-to-bottom reappraisal of the sector’s business model and of the concept of economies of scale.
Introduction
Over the last 50 years, agriculture has outstripped every other sector of the French economy in terms of increasing labour productivity (Guihard and Lesdos, Reference Guihard and Lesdos2007). Over this same period, the share of the working-age population in agricultural work has decreased considerably from 31% to 3.4%. Nevertheless, since the late 1990s, even though the productivity of labour continues to climb, commercial farm businesses have struggled to maintain revenue and the productivity of all other resource factors (capital, land, intermediate consumption (IC)) is declining (Butault, Reference Butault2006).
The increase in farm sizes – and consequently herd sizes – at constant labour levels has made work organization a central concern for livestock farmers (Madelrieux and Dedieu, Reference Madelrieux and Dedieu2008). Most livestock farmers tend to address these work organization problems by simplifying farm management practices. For beef cattle farms, this essentially means simplifying feed and herd reproductive management (Hostiou and Fagon, Reference Hostiou and Fagon2012). A streamlined on-farm work organization can affect livestock performances (Martel et al., Reference Martel, Dourmand and Dedieu2008), and simplification can lead to underuse of the nutritional value of feed ration components (Agabriel et al., Reference Agabriel, Farrie, Pottier, Note and Pomies2012).
In the context of rising energy prices, this heightened dependence on inputs can leave farm production systems economically vulnerable. This potential economic fragility pushes livestock farmers to aim for more sustainable, resilient and self-sufficient production systems (Lebacq et al., Reference Lebacq, Baret and Stilmant2014), chiefly via strategies for farm-scale feed self-sufficiency (Ryschawy et al., Reference Ryschawy, Choisis, Choisis and Gibon2013; Coquil et al., Reference Coquil, Beguin and Dedieu2014; Havet et al., Reference Havet, Coquil, Fiorelli, Gibon, Martem, Roche, Ryschawy, Schaller and Dedieu2014). Feed self-sufficiency is widely associated with livestock systems that are low-input with a high profitability (Ripoll-Bosch et al., 2014) and that create value added (Garambois and Devienne, 2012), including grass-based farm systems.
At this juncture between structural expansion, herd management simplification and sufficiency-driven economic sustainability, it is important to stop and question the rationality of the management system and the technical efficiency of the production system. The objective of this paper is to define the concept of technical efficiency of the production system via the construct of wealth – or value added – created. We analyze the 23-year (1990 to 2012) macrotrends in the productivity figures, IC, capital consumption, value added and incomes–revenues of commercial beef cattle farms. To gain a sharper picture of the technical management practices and performances, we co-analyze the performances of a subsample population of 43 farms in the Charolais beef cattle area.
Material and methods
Suckler cattle farming is a major feature of French agriculture, accounting for more than one-third of all European suckler cows and supplying 65% of the beef produced and consumed in France. French beef farmers are breeders (farmers with suckler cows not fattening their calves) and breeders-fatteners (they fatten the calves born on their farms). Cull cows are generally fattened on-farm, and 60% of the males are exported as store cattle to the Italian fattening enterprises. French weanlings for the Italian market are the main activities of the Europeans exchange of live animals.
The national beef herd, 4.1 million suckler cows, is mainly composed of various pure breeds, and these breeds are maintained as regional particularities. With its 1.5 million cows, Charolais is the main breed. The Charolais area, located in the North Massif Central (a grassland and less-favoured area in the Centre France), counts 41% of the French Charolais-breed cows, that is to say 20% of the total French suckler cows.
Beef cattle farm networks
Beef cattle farms, the Farm Accountancy Data Network (FADN)
The FADN is an EU-wide harmonized network that sources and publishes statistics on farming business accounts, revenues and economics (European Commission, 2015). FADN–France is representative of the French mainland population of what are termed ‘commercial’ farm businesses. A commercial farm is defined as a farm which is large enough to provide a main activity for the farmer and a level of income sufficient to support his or her family. In practical terms, in order to be classified as commercial, a farm must exceed a minimum economic size, measured by the total standard output (SO) of the holding. Farms in the FADN-scope field of survey are classed by region under a typology scheme based on their type of farming (TF). Types of farming are defined in terms of the relative importance of the different enterprises on the farm (proportion of each enterprise’s SO to the farms’ total SO). To be classified as specialized beef cattle farm, TF46, the SO from bovine product must contribute >2/3 of the total farm’s SO, and the SO from milk <1/10. The FADN farms are a subsample population of farms that are surveyed every year and weighted by an extrapolation factor to make them representative of the TF-based subset of commercial farms (European Commission, 2015). Thus, under TF46, the 566 farms surveyed in 1990 represent a 33 362-farm population, and the 719 farms surveyed in 2012 represent a 33 098-farm population. A total of 98% of the 719 farms surveyed in 2012 have suckler cows (breeders and breeders-fatteners), only 2% of them are specialised fatteners without suckler cows.
The INRA network of Charolais suckler beef farms
In order to understand the drivers and determinants of macrotrends in suckler cattle system farms and capture and analyze the technical and economic potentials of their production systems, an Economics team from INRA–Clermont-Theix set up a Charolais-region farm network for long-term observational statistics that has been running since the 1970s.
Each farm in the network is sample-surveyed every year. Data is collected on labour, structure, hectarage and land allocation scheme, herd, aggregated IC, sales, aids and subsidies, investments and borrowing. Of the 52 farms performance-monitored from 1990 to 2012, we formed a constant subsample population of 43 conventional farms, all located in the Charolais-area pool. In order to compare the year-on-year results in terms of technical efficiency, any farms appropriating (or abandoning) a secondary sideline (landless) activity or converting to organic farming (OF), over this time period were excluded from our subsample population. Thus, three farms were excluded due to a conversion to OF, three due to the cessation of a pig production activity, one due the creation of a poultry production activity with direct selling and two due to a huge expansion of a meat sheep flock (beef production became minority).
Efficiency of the system
The efficiency of a holding is its capacity to obtain good performances with a given quantity of production factors. This efficiency can be connected up to the productivity of the business’s factors of production (Latruffe, Reference Latruffe2010). One definition of productivity is the capacity of production factors to produce goods and services. One measurement solution for productivity is an indicator of partial productivity, that is, a ratio of output to an input. High productivity (high volume of a good produced for a low amount of input consumed) can be considered as high efficiency of this input. The aggregate of all outputs with the aggregate of all inputs makes it possible to calculate the wealth – or value added – created by the business in a more dynamic trend analysis of productivity (Latruffe, Reference Latruffe2010), that is, the technical efficiency of the production system.
The concept of value added
Value added is the difference between the goods and services produced as outputs by the business (excluding aids and subsidies) over the accounting period, and external expenditure (IC), that is, goods or services consumed as inputs to achieve this output and depreciation, that is, annual fixed capital consumption (FCC). Value added is a metric that expresses how much wealth the production system creates. Value added per unit of labour or hectare (ha) of land can be used as a metric to compare the economic efficiency of farming systems excluding subsidies (Cochet and Devienne, Reference Cochet and Devienne2006).
Technical efficiency of the production system
Efficiency will be evaluated through the productivity of variable factors used to observe whether the beef farms were able to create wealth over the years. According to the concept of value added, the product is the farm product excluding aids (Prod) and the variable factors (or resources used) are ICs plus FCC. The technical efficiency (Eff) will be represented by the evolution of the ratio:
 $${\rm Eff{\equals}}={{{\rm Prod}} \over {({\rm IC{\plus}FCC})}}$$
The curve of this efficiency metric is dependent on how commodity prices and factor prices diverge over time (price squeeze). The measure of technical system efficiency thus has to aggregate the volume of all production output streams (meat, cereal crops, etc.) and the various production factors (fertilizers, feeds, fuel, services, equipment and building depreciation, etc.). Volumes and unit prices should therefore be split and broken down for each unit of output/input (Butault et al., Reference Butault, Delame and Rousselle1995), which is always going to prove a relatively complex task. However, year-to-year trends in volumes of each unit of output/input can be teased out if we know the respective price index of each input/output against a base-year point of reference.
Price indices (Eurostat, 2015)
The index of producer prices of agricultural products (PPAPI) is designed as a metric of changes in prices paid to farmers. Each farmed commodity price gets valued at successive intervals, and Eurostat publishes the updated index. The latest index figures published work to 2010=100. The annual values of each FADN-surveyed product farmed under TF46 (cereal crops, industrial crops, other crop products, product from cattle, sheep, pigs, poultry, other animals, other products) have been reweighted with their own PPAPI where clearly identified (cereal crops, product from cattle, sheep, pigs, poultry, other animals). Industrial crops and other crop products (which account for just 2% to 5% of annual agricultural product) have been reweighted with the ‘oilcrops’ PPAPI, on the rationale that rape is often rotated into the cropping system with wheat on mixed crop–beef farms. The ‘other products’ subaggregate, which also accounts for 2% to 5% of annual agricultural product, has been reweighted with the general commodity index excluding fruit and vegetables. For the INRA–Charolais network, annual products have also been reweighted with their own PPAPI but farm-by-farm rather than across the annual mean of the sample population.
Eurostat also tracks the unit prices that farmers pay for goods and services needed for their farming activity, in order to calculate the ‘index of purchase prices of the means of agricultural production’ (PPMAPI). The PPMAPI covers nine investment and IC expenditures (seed, fertilizer and soil amendments, veterinary supplies, pest control products, cattle feed, light tools, energy, equipment assets, consultancy and overheads) that, together, cover over 70% of the real expenditure of a livestock farm. PPMAPI also works to 2010=100. In the same way as for farm products, the annual mean values of each expenditure in the FADN-surveyed sample and each expenditure of each farm in our INRA–Charolais sample were reweighted with their own respective PPMAPI. Non-PPMAPI-aggregated expenditures were aggregated with other known PPMAPI expenditures (for example, livestock farming expenditures such as artificial insemination are aggregated with veterinary expenditures).
We used the same index, determined at national level, on both networks and for all Charolais farms. We did not take into account the possible negotiation capacity of a farm or its business opportunity, and thus a potentially differentiated evolution of the index between farms. We can make this hypothesis considering that farms are numerous and independent and therefore they have no individual weight on the annual prices evolutions. Once reweighted to correct for pure price effects, year-on-year trends in products and ICs mirror the trends in volumes produced and consumed.
Feed self-sufficiency
Feed self-sufficiency is defined as the ratio of feed produced to feed consumed. To account for the energy value of the various different feed ration components, feed self-sufficiency is expressed in feed units (one FU being equivalent to the average energy produced by 1 kg of barley; INRA, 2007). FU feed self-sufficiency is thus the fraction of the herd’s FU needs covered by FU produced on-farm. The annual FU needs of the Charolais-region suckler beef herd are estimated at 3660 FU/livestock unit (LU) (according to INRA equations, INRA, 2007). This data set thus makes it possible to calculate:
Forage FU feed self-sufficiency. Share of the herd’s annual FU needs covered by FU from forages produced on the farm (pasture, haylage and other annual forages)=1−[(FU value×kg dry matter (DM) forage purchased+FU value×kg total concentrates)/3660×LU].
Total FU feed self-sufficiency. Share of the herd’s annual FU needs covered by FU from all feed produced on the farm (self-supplied forages and concentrate)=1−[(FU value×kg DM forages purchased+FU value×kg concentrates purchased)/3660×LU].
Expression and variability of the results
As land and workforce were limiting factors, the volumes produced (agricultural products) and consumed (variable factors of production) were expressed per ha of utilized agricultural area (ha UAA) and per worker (annual work unit, AWU). The evolution of land and labour productivity was captured by the volume of wealth created (value added), and its components, per ha UAA and per AWU.
The presented results were the respective annual average values of all farms constituting the two samples. Unlike the FADN network, we had, for the INRA–Charolais network, values of all structural, technical and economic variables for each farms year by year. A principal component analysis (PCA) on all observations (43 farms×23 years=989 observations) allowed us to summarize the variability of inter-farm results. By projecting on the PCA axes the production variables, IC and fixed capital, added value and technical efficiency, we observed their correlations with the axes characterizing the variability of our INRA–Charolais sample. These data analysis were conducted with XLSTAT, a statistical add-in for Microsoft Excel.
Results
Main structural trends observed on beef cattle farms networks.
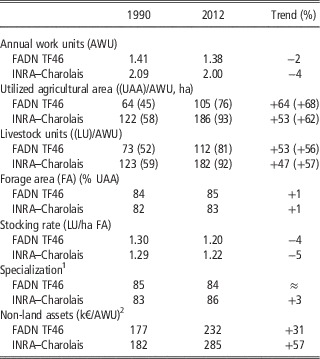
The main structural trends marking beef cattle farms over the 1990 to 2012 period (Table 1) were as follows:
-
∙ large increase in hectarage, herd size and labour productivity (hectarage and number of LUs per worker unit, respectively +56% to +68%),
-
∙ continued reliance on grassland systems, with extensification,
-
∙ considerable capital investment (capital per worker +31% to +57% in constant-euro values).
Main structural characteristics of the Farm Accountancy Data Network subsample type of farming beef cattle farms (FADN TF46) and the constant INRA–Charolais-network sample of 43 beef cattle farms: 1990 v. 2012

Average values of each variable for each sample.
1 Specialization=gross revenue on cattle (excluding aids)/gross operating revenue (excluding aids).
2 Non-land assets: constant-euro values for 2012 (deflator: national consumer price index).
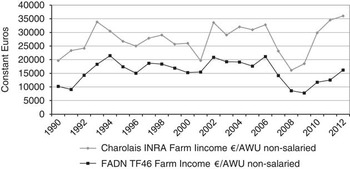
The 43 farms in the INRA–Charolais network were bigger in 1990 and still significantly bigger in 2012 than the FADN-sample farms, but with more labour employed. However, the trends seen in the two networks occurred in parallel and in perfectly comparable patterns. Both networks show a shift towards de-intensification of the forage area, where stocking rates were on a par between networks. Despite this strong increase in labour productivity, revenue per worker has remained relatively stable in both networks, with strong interannual variability (Figure 1). The trends ran parallel between the two networks – the revenue differential between the FADN TF46 sample and the INRA–Charolais sample was due to difference in structures, breeds and regions. An in-depth description of the structural, technical and economic productivity trends and determinants in the INRA–Charolais network farms over this period can be found in the study by Veysset et al. (Reference Veysset, Benoit, Laignel, Bébin, Roulenc and Lherm2014a).
1990 to 2012 trend in beef cattle farm income in constant-euro values per non-salaried worker (annual work unit non-salaried). Income in constant-euro values for 2013 (deflator: national consumer price index). FADN TF46: Farm Accountancy Data Network subsample type of farming beef cattle farms. Charolais-INRA: constant sample of 43 Charolais beef cattle farms.

Value added and its components: land and labour productivity
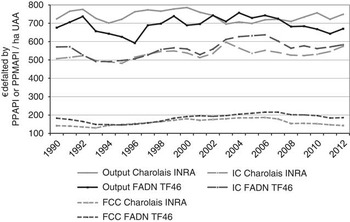
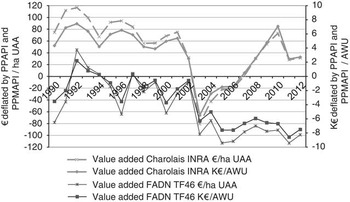
Beef cattle farms: FADN, TF46 (mean values of structural and economic variables for each year are given in Supplementary Table S1). Volume of French beef cattle farm output per ha UAA stayed flat over the last 23 years (Figure 2). This flatlined land-asset productivity was linked to the de-intensification of forage area (fewer animals produced per ha of forage area), which was itself associated with less intensive consumption (in volume terms) of fertilizer (−54%), seed (−23%) and pest control products (−17%). However, these costs were the only expenditures to have decreased in volume terms over the period studied. Amounts used per ha UAA increased across the board for all other IC expenditures, including: cattle feed +21%, veterinary supplies +14%, fuel +29%, equipment maintenance and repair +33%, water, gas, administrative and other services +17%. In global trend terms, aggregate volume of IC per ha UAA increased 0.64%/year. Despite the increase in farm size, annual FCC per ha UAA also increased, growing at a rate of 1.25%/year. Equipment expenditure was the main cause of this increase, accounting for 68% of annual FCC per ha UAA. The dynamic of the evolutions of the volumes produced (agricultural output) and consumed (IC and fixed capital) per ha UAA had the same profile: a slight decrease from 1990 to 1995, indicating a wait-and-see attitude face the new 1992 Common Agricultural Policy (CAP) reform (Veysset et al., Reference Veysset, Benoit, Laignel, Bébin, Roulenc and Lherm2014a), to return to the 1990 value in 2001; then a rise in consumption until 2007 with stagnating production, a sign of confidence related to the level of aid received and stability of the whole of price of meat sold plus aids and subsidies; and finally a slight decrease since 2007 certainly related to the slow erosion of the whole of prices+aids. Value added per ha UAA thus dropped with an average rate of −1.08%/year (Figure 3). From 1990 to 2001, consumed volumes of variable factors increased slightly faster than those produced by ha UAA, resulting in a downward trend in value added per ha UAA. From 2001 to 2007 with a production stagnation and a still higher variable factors consumption, the value added per ha UAA fell sharply, and finally, since 2007, the volume of wealth created per ha UAA stagnated.
Year-on-year trends in output volumes, intermediate consumption (IC) and fixed capital consumption (FCC) per ha agricultural area (UAA). 2010=100. Figures in euros deflated by index of producer prices of agricultural products (PPAPI) and index of purchase prices of the means of agricultural production (PPMAPI). FADN TF46: Farm Accountancy Data Network subsample type of farming beef cattle farms. Charolais-INRA: constant sample of 43 Charolais beef cattle farms.

Year-on-year trends in value added per ha agricultural area (UAA) and per worker (annual work unit, AWU). 2010=100. Figures in euros deflated by index of producer prices of agricultural products (PPAPI) and index of purchase prices of the means of agricultural production (PPMAPI). FADN TF46: Farm Accountancy Data Network subsample type of farming beef cattle farms. Charolais-INRA: constant sample of 43 Charolais beef cattle farms.

The strong increase in physical labour productivity drove a 67% increase in output per worker (AWU) between 1990 and 2012. However, over the same period, beef cattle farms registered strong increases in volume of IC and FCC per AWU (+72% and +70%, respectively), with the result that value added per AWU fell 113%. Net gains in labour productivity did not lead to net increase in value added per worker. Dynamics of evolution of the land and labour productivity were parallel (Figure 3).
INRA–Charolais network: technical performance analysis (mean values of structural, technical and economic variables for each year are given in Supplementary Table S2). Year-on-year trends in output, IC and FCC per ha UAA in the INRA–Charolais-sample farms occurred in parallel and perfectly comparable patterns to those on FADN-universe farms (Figure 2). The farms in this network remained strongly specialized over the wider period. Beef product accounts for 83% of total gross product excluding aids, way ahead of cereal crops at 9% and oil crops at 4%, with the remaining 4% scattered between sheep, other livestock and other product.
Numerical productivity (number of calves weaned per 100 cows serviced) decreased by 1.9 percentage units in 23 years (86.4% in 2013 v. 88.3% in 1990). This numerical productivity decrease was related to lower pregnancy rate (from 94% to 91%) and a slight increase in calf mortality: 7.5% to 9.5%, trends observed in large herds (Veysset et al., Reference Veysset, Bébin and Lherm2004). Given the strong and constant demand from Italian fatteners for young and heavy weanlings, the share of animals finished on-farm for slaughter has dropped: in 2012, only 26% of males sold to market were finished on-farm, against 42% back in 1990. However, the drop in numerical productivity and finishing was offset by the genetics gains and feeding practices (more concentrates, see below) leading an increase in body size (carcass weight of cull cows has gained 50 kg, i.e. +13%), and beef live-weight output per LU (kglw/LU: weight productivity) increased from 295 kg in 1990 to 327 kg in 2012, that is, a 10% gain.
Stocking rate held stable at a steady 1.30 LU/ha of main forage area (MFA) until 2001. The increase in extensification premiums with Agenda 2000 (the 2000 CAP reform package) was a strong incentivizer – mean stocking rate dropped below the 1.25 LU/ha MFA mark in 2002 and has stayed there ever since. This decrease in stocking rate practically cancelled out the increases in average weight productivity, with beef live-weight output per ha of forage area increasing by a modest 15 kg in 23 years (+5%) when beef live-weight output per LU gained 32 kg.
The de-intensification of forage area has not slowed efforts to improve the quantity and quality of forage harvested: the proportion of grassland mowed every year increased from 38% in 1990 to 47% in 2012, and the proportion of this mowed grasslands bale-wrapped climbed from 7% to 21% to the detriment of hay (due to an earlier cutting date, the nutritive value of bale-wrapped is theoretically better than hay). The fraction of forage area used for maize forage – which remains minor – fell from 6% to 3%. Despite less on-farm fattening and more conserved forages available, the amount of concentrate distributed per kg of live-weight have increased substantially: +33% in 24 years (1.63 kg concentrate/kglw in 1990 v. 2.17 in 2012). Note that to produce 1 kg of beef live-weight, concentrate produced on-farm (self-supplied) and concentrate bought off-farm have co-increased in use in the same proportions. The net result over 22 years was a 6 percentage unit drop in forage FU feed self-sufficiency (88% in 1990 v. 82% in 2012) and a 3 percentage point drop in total FU feed self-sufficiency (94% in 1990 v. 91% in 2012). The use of self-supplied concentrate attenuated the loss of total feed self-sufficiency, but the flipside is that it also ran counter to better forage value use.
Over the period as a whole, cereal crop yield remained stable at around 4.7 tones/ha (whereas in the FADN sample, cereal crop yield rose from 5.0 to 6.0 tones/ha). The fact that forageland productivity and cropland productivity have stayed stationary explained why the volume of total farm output per ha UAA has not changed in 23 years. This flatlined land-asset productivity was somewhat offset by less intensive consumption of fertilizer per ha UAA: mineral nitrogen fertilizer decreased from 50 to 41 kg N/ha, that is, a −18% drop. The net consumption of crop expenditure (fertilizer, seed, crop protection) has dropped 35%. However, volume amounts used per ha UAA increased across the board for all other IC expenditures: purchased cattle feed (+38%), energy (+55%), light tools and equipment maintenance (+65%), overheads (+12%), veterinary expenditure and other livestock expenditures (+12%). On aggregate, the volume of IC expenditure per ha UAA has increased by 13% (Figure 2).
After rising until 2006, annual FCC per ha UAA has since tended to drop (Figure 2). The increase in FCC between 1990 and 2006 can be attributed to the investments into farm-building assets (modernization, retrofitting or new builds) in an effort to comply with national agricultural non-point-source pollution control program policy (from 1994 to 2007). This farm building modernization effort also pulled along investments into new equipment-asset resources such as bedding machines, forage and concentrate feeders. Bale-wrappers arrived in the early 1990s, followed by high-density round balers, prompting a revamp of the entire forage harvesting–storage–distribution chain over the course of the 1990s. On aggregate, the volume of FCC per ha UAA has increased by 1.5% (Figure 2). Volume of outputs per AWU increased by 67% and volume of IC and FCC per AWU increased by 83% and 66%, respectively. Value added per ha UAA and per AWU has decreased by 58% and 37%, respectively (Figure 3).
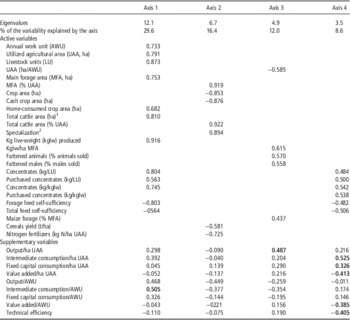
INRA–Charolais network: results variability. Four axes summarized 67% of the total variability of our sample. (Table 2. Results of the PCA and figures are given in Supplementary Material S1.) The variables contributing to the first axis (30% of the total variability) were those expressing the size of the farm and of the herd. Amounts of concentrates used per animal and per kg of live-weight produced were positively correlated to this axis, feed self-sufficiency was negatively correlated. This axis discriminated the large beef cattle farms that use lots of concentrates to produce a large amount of live-weight. The second axis (16% of the variability) was constituted by the variables expressing the specialization. In positive coordinates we found beef specialization; in negative coordinates were the cash crop area, the yield of grain and the amount of mineral nitrogen per ha UAA. Variables expressing the percentage of on-farm fattened animals contributed to the construction of the third axis (12% variability). In negative coordinates, on this third axis, was the farm size per worker. This axis discriminated intensive breeders-fatteners with a limited UAA per worker. The fourth axis (9% of the variability) discriminated farms according to their level of feed self-sufficiency and thus concentrates purchased. The two axes affecting the components of the value added were the size axis and the feed self-sufficiency axis (Table 2). The volumes of outputs and ICs per ha UAA and AWU, were positively correlated to the size axis. Large farms were more productive per ha UAA and per AWU, but with a high amount use of inputs. FCCs per ha UAA were independent of the size (whereas, according to the concept of economy of scale, one would expect a negative correlation); expressed by AWU, they are positively correlated to the size. The volume of wealth created (value added) per ha UAA and AWU was not related to the size: the volume of variable factors consumed was just offset by production volume; there was no economy of scale. Value added by ha UAA and per AWU, was strongly linked to the feed self-sufficiency. The feed self-sufficiency allowed to limit ICs per ha per AWU, without negative impact on volumes produced.
Results of the principal component analysis

Correlations of the main active variables (i.e. active variables that contribute the most to the construction of each axis), and of the supplementary variables, with the four identified axes.
Values in bold: values for which the squared cosine is the highest (the greater the squared cosine, the greater the link with the corresponding axis).
1 Total cattle area=area dedicated to the cattle herd=MFA+area of annual on-farm crop sidelined for cattle feed.
2 Specialization=gross revenue on cattle (excluding aids)/gross operating revenue (excluding aids).
Technical farm system efficiency, feed self-sufficiency and income per worker
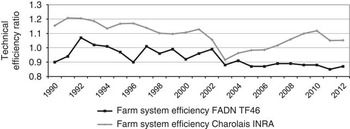
Stable volume of farm output per ha even at heavier intermediate and FCC per ha meant that technical farm system efficiency has declined over the last 23 years, in parallel across both subsample populations surveyed (Figure 4). Annual decline in technical efficiency was −0.7%/year for FADN-sample beef cattle farms and −0.8%/year for INRA–Charolais-sample beef cattle farms.
Time course of technical farm systems efficiency: farm product excluding aids in euros deflated by index of producer prices of agricultural products (PPAPI)/intermediate consumptions plus fixed capital consumed in euros deflated by index of purchase prices of the means of agricultural production (PPMAPI). FADN TF46: Farm Accountancy Data Network subsample type of farming beef cattle farms. Charolais-INRA: constant sample of 43 Charolais beef cattle farms.

Both networks showed a low-point in 2003 – a year that marked the hottest and driest summer on record in Europe. The low-point was equally visible in the figures for value added (Figure 3). The 2003 European heatwave did not hit beef output, as farmers bought in forage and concentrate to keep animal weights up (Veysset et al., Reference Veysset, Lherm and Bébin2007), hence a peak in IC expenditure. After 2003, the technical efficiency of FADN-sample farms stagnated and never recovered to pre-2003 values, whereas the technical efficiency of INRA–Charolais-sample farms dipped strongly but then tended to bounce back, although again never recovering to pre-2003 values. The fact that the 2003 collapse was much sharper for INRA–Charolais-sample farms may be explained by the fact that they are bigger than FADN-sample farms. The fact is that big farms have high fixed infrastructure costs that amplify their income losses in bad years (Veysset et al., Reference Veysset, Lherm and Bébin2005).
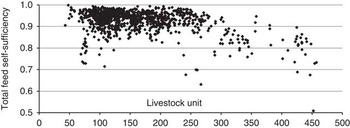
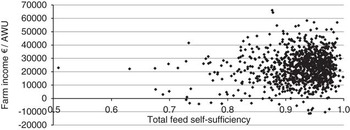
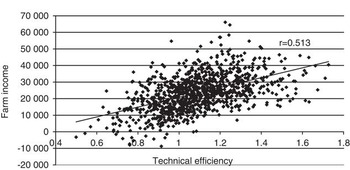
The projection of the technical efficiency ratio on the PCA axes (Table 2) showed a slight depressive effect of the size (low negative coordinate on the first axis) and a slight positive effect of fattening animals (low positive coordinate on the third axis). However, the axis that is strongly positively linked to this efficiency was that of feed self-sufficiency. The variable factors productivity was positively correlated to the feed self-sufficiency, itself negatively correlated with the farms size. Feed self-sufficiency was directly linked with the amount of purchased concentrates used per LU. Charolais suckler cattle farmers were self-sufficient for the quantity of forages, they did not buy forages (except in 2003, due to the exceptional drought). As >80% of the annual herd’s FU needs were covered by the forages produced on-farm, and as 10% of these needs were covered by the on-farm produced concentrates, the total feed self-sufficiency ranged between 91% and 96% for 50% of the studied population. Despite this relative low variability in the total feed self-sufficiency, the largest herds (>250 LU) posted systematically low results (Figure 5). We also observed that the farms with the lowest feed self-sufficiency (<82%) posted systematically low farm income per worker (Figure 6). Anyway, the technical efficiency is a positive determinant of income per worker (Figure 7).
Total feed self-sufficiency – livestock unit linkage, 43 farms (INRA–Charolais constant sample) over 23 years=989 observation points.

Farm income per worker – total feed self-sufficiency linkage, 43 farms (INRA–Charolais constant sample) over 23 years=989 observation points. Income in constant-euro values for 2013 (deflator: national consumer price index). AWU=annual work unit.

Farm income per worker – technical efficiency linkage, 43 farms (INRA–Charolais constant sample) over 23 years=989 observation points. Income in constant-euro values for 2013 (deflator: national consumer price index).

Discussion
In grazing livestock farming, an increase in physical labour productivity does not necessarily equate to an increase in the main indicators of economic performance (Charroin et al., Reference Charroin, Veysset, Devienne, Fromont, Palazon and Ferrand2012).
Economies of scale and economies of scope?
Over the 23-year period studied, direct aids to farmer and big increases in labour productivity have ultimately only served to maintain income per worker on beef cattle farms. Productivity gains have been ‘redistributed’ (Boussemart et al., Reference Boussemart, Butault and Ojo2012) further downstream (drop in farmed commodity prices) and further upstream (farming supplies and machinery). The size increase has not therefore produced economies of scale. FCC did not get spread and diluted with increasing number of hectares – indeed, it even increased due to the new mechanization needs generated by the increase in farm size (hectarage and herd size). There is still no consensus over the linkages between farm size and farm system efficiency. Some authors reported scale efficiencies with increasing farm size (Morrison Paul et al., Reference Morrison Paul, Nehring, Banker and Smwaru2004; Mosheim and Knox Lovell, Reference Mosheim and Knox Lovell2009) whereas others showed that the linkage was not necessarily linear and that efficiency may even fall (scale inefficiency) after a certain size threshold (Jaforullah and Whiteman, Reference Jaforullah and Whiteman1999; Helfand and Levine, Reference Helfand and Levine2004). A factor productivity can be improved by its scale of use (economies of scale), but the increase in farm size may also unlock opportunities to capitalize on new techniques, technologies and practices that can improve productivity (economies of size). This distinction between economies of size and economies of scale (Hallam, Reference Hallam1991) supported the rationale that smaller farms were more likely to gain competitiveness by investing to improve their technical efficiency (adopting good technologies and/or practices) rather than by increasing their size (Sheng et al., Reference Singbo and Larue2014; Singbo and Larue, Reference Sheng, Zhao, Nossal and Zhang2014). The evidence from our beef cattle farms suggested that the increase in size had entailed taking on equipment and organizational practices (fully mechanized forage harvesting and distribution chain) that had no effect on productivity (no economies of size), which had incentivized the farmers to grow bigger in a move to amortize these new technologies (economies of scale). In much the same way, diversifying into mixed crop–livestock farming did not necessarily bring about economies of scope (Perrot et al., Reference Perrot, Caillaud and Chambaut2013; Veysset et al., Reference Veysset, Lherm, Bébin and Roulenc2014b). Farm operations with more cereal crop hectarage used more concentrates per kg beef live-weight produced (negative correlation between forage feed self-sufficiency and crop hectarage).
The net result for these farms was that technical efficiency and wealth created/value added has been in decline for at least 20 years, alongside a parallel trend in which farm size was continually expanding yet farm income increasingly reliant on aids and subsidies. Size has long been a major driver in protecting livestock farmer income levels, initially through the increase in output volumes and then, from the mid-1990s, through the aid support granted to farms without size limit (Veysset et al., Reference Veysset, Lherm and Bébin2005).
Feed strategies, feed self-sufficiency, efficiency
Feed self-sufficiency was a key factor in the technical efficiency of suckler beef production systems and the value added they created. However, all these variables were significantly negatively correlated to farm size. One of the objectives of the 1992 Common Agricultural Policy reforms (the ‘MacSharry reforms’) was to use incentivization mechanisms to promote the incorporation of EU-farmed cereals into animal feed as a substitute for imported cereal-crop by-products. This incentivization policy manifested as a sharp drop in cereal crop prices (−50% in constant-euro values between 1992 and 2005). Livestock farmers were consequently able to increase herd size and simplify the feed work burden by distributing more concentrates (easy to store and distribute, and with known and reliably stable nutritional value) with only small increases in expenditure on feed.
The advent of bale-wrapping brought a minor technological revolution in the way grass forage was harvested. This forage harvesting and conservation technology had a substantial impact on fuel consumption levels whether indexed to LU or to ha of forage area (Devun et al., Reference Devun, Bébin, Moreau, Roulenc, Manneville, Chassaing and Lherm2014) and partly explained the surge in energy consumption per ha at farm scale. These new feed management practices, which tended towards improved energy density of feed rations but at a cost of greater use of non-renewable fossil fuels, did not appear to fit with the fact that beef output per ha had flatlined and ran counter to value-adding on-farm forage resources.
Conclusion
Feed self-sufficiency is a critical issue for livestock farmers today – especially with the added pressure from rising prices on cereal crops and the knock-on effect on concentrate feed prices since 2007. The quest for feed self-sufficiency is unlikely to find solutions through new technological advances or new knowledge capital, but ‘simply’ through improving feed practices and herd management strategies, and – crucially – the way on-farm resources are valued. The continual expansion of farm size–scale and the continual drive for greater labour productivity have led to heavier use of off-farm resources (inputs and capital) to the detriment of better use of value-adding on-farm resources (genetic potential of livestock and plant resources), yet without increasing the productivity of farmland utilized. This drop in productivity of its production factors – and thus in wealth created by the beef cattle farming activity – should prompt a critical top-to-bottom reappraisal of the sector’s business model and how we should make better use of 20 years of genetic, technical, technological and knowledge progress.
Acknowledgement
The authors would like to thank the farmers who kindly provided the yearly data from their registers to complete this study.
Supplementary Material
To view Supplementary material for this article, please visit http://dx.doi.org/10.1017/S1751731115002013