People's perception of their physique is a central aspect in research of exercise psychology (Hart, Leary, & Rejeski, Reference Hart, Leary and Rejeski1989). Research has obtained empirical evidence about the effects of others' appraisal and one's own perception of one's body on participation and enjoyment of physical exercise programs (Crawford & Eklund, Reference Crawford and Eklund1994; Gammage, Martin, & Hall, Reference Gammage, Martin and Hall2004; Leary, Reference Leary1992). In fact, satisfaction with one's physique and others' perception of it are considered a main motivator for exercise; concern about one's physical aspect can dissuade a person from engaging in exercise programs (Spink, Reference Spink1992). Within this field, the affective response reflecting concern about how others may judge one's body has been called social physique anxiety (Leary, Reference Leary1992). Considered as a type of social anxiety, this kind of response has been defined by Hart et al. (Reference Hart, Leary and Rejeski1989) as anxiety felt by people in response to others' appraisals of their physique, that is, their body structure (e.g., height, weight, muscle tone).
Initial research began by studying body image alterations in clinical populations, such as patients with neural or physical deficiencies (Hart et al., Reference Hart, Leary and Rejeski1989; Leary & Kowalski, Reference Leary and Kowalsky1990). However, since the ’60s, research has shown that distortion of one's physical aspect also occurs in nonclinical populations, such as students. In fact, social physique anxiety is clearly visible in adolescence, given that this stage is considered as a vulnerable period for body image distortion (Sabiston, Sedgwick, Crocker, Kowalsky, & Mack, Reference Sabiston, Sedgwick, Crocker, Kowalski and Mack2007). Moreover, the construct of social physique anxiety has been linked to notable health-related behavioral and psychological factors, such as self-esteem (Gargari, Khadem-Haghighian, Taklifi, Hamed-Behzad, & Shahraki, Reference Gargari, Khadem-Haghighian, Taklifi, Hamed-Behzad and Shahraki2010; Kowalski, Crocker, & Kowalski, Reference Kowalski, Crocker and Kowalski2001), self-concept (Hagger et al., Reference Hagger, Stevenson, Chatzisarantis, Pereira Gaspar, Leitão Ferreira and González Ravé2010), dissatisfaction with one's appearance and body image (Crawford & Eklund, Reference Crawford and Eklund1994; Sabiston et al., Reference Sabiston, Sedgwick, Crocker, Kowalski and Mack2007), eating disorders (Haase & Prapavessis, Reference Haase and Prapavessis1998; Hausenblas & Mack, Reference Hausenblas and Mack1999; Thompson & Chad, Reference Thompson and Chad2002), and motivation associated with health-related behaviors, such as physical exercise (Brunet & Sabiston, Reference Brunet and Sabiston2009; Hausenblas, Brewer, & Van Raalte, Reference Hausenblas, Brewer and Van Raalte2004; Thompson & Chad, Reference Thompson and Chad2000). In order to understand and treat social physique anxiety, and in view of its importance for physical activity and other health habits, we need to develop instruments to measure it.
The Social Physique Anxiety Scale (SPAS) was originally developed by Hart et al. (Reference Hart, Leary and Rejeski1989) to measure the degree of anxiety people experienced when feeling that their bodies were being assessed by others. To develop the scale, the authors started out with 30 items to measure perceived anxiety (e.g., nervous, tension) and the opposite perception (e.g., relaxation, comfort) experienced by people as a consequence of perceived assessment of their bodies. After various revisions, the authors reduced the instrument to a 12-item unidimensional version. This unidimensional structure was assessed and supported by the authors in a second sample of university students, using item correlations, confirmatory factor analysis (CFA), and reliability analysis.
The unifactorial structure of the 12-item SPAS has subsequently been assessed using CFA. Some of these studies have suggested possible problems with the structure, item drafting, and the stability of the instrument (Crawford & Eklund, Reference Crawford and Eklund1994; McAuley & Burman, Reference McAuley and Burman1993). The unifactorial structure of the scale was initially questioned because it differentiated two factors for the 12 items: feelings of comfort about the presentation of one’s physique, and expectations of a negative evaluation of the physique by others (Eklund, Mack, & Hart, Reference Eklund, Mack and Hart1996; Petrie, Diehl, Rogers, & Johnson, Reference Petrie, Diehl, Togers and Johnson1996). Nevertheless, subsequent evolution of research has presented conceptual and empirical arguments to maintain the unidimensionalality of the SPAS (Eklund, Reference Eklund1998; Motl & Conroy, Reference Motl and Conroy2000, Reference Motl and Conroy2001; Smith, Reference Smith2004). Of the two factors suggested for the 12-item SPAS, only the second factor (expectations of a negative assessment of one's physique) is conceptually close to the original definition of the construct (Hart et al., Reference Hart, Leary and Rejeski1989). In fact, as argued by Motl and Conroy (Reference Motl and Conroy2000), the two-factor model proposed for the SPAS–12 was the product of a methodological artifact ocurring when separating the items drafted negatively (i.e., factor expectations of a negative assessment of one's physique) and positively (i.e., factor comfortable about physical presentation of the body). Thus, the most recent studies have worked on a model generated from the suggestion of McAuley and Burman (Reference McAuley and Burman1993) that the fit of a unidimensional model for the SPAS could be improved by modifying or eliminating items from the scale.
In an attempt to improve the validity of the instrument and overcome structure problems, Martin, Rejeski, Leary, McAuley, and Bane (Reference Martin, Rejeski, Leary, McAuley and Bane1997), proposed a one-factor model with 9 items for the SPAS. Specifically, on the basis of conceptual and statistical arguments, the authors proposed the suppression of 3 out of the 12 original items. According to the authors, two of the original items (Items 1 and 5) did not seem to have social assessment components, essential in the conceptualization of the SPAS, and also, these items correlated strongly with measures of body satisfaction. As subsequent studies have supported, Items 1 and 5 apparently reflect a positive self-description or an assessment more typical of physical self-concept (Hagger et al., Reference Hagger, Asçi, Lindwall, Hein, Mülazimoglu-Balli, Tarrant and Sell2007; Kowalski et al., Reference Kowalski, Crocker and Kowalski2001). However, Item 2 has repeatedly been shown to have a weak factor loading (Eklund, Kelley, & Wilson, Reference Eklund, Kelley and Wilson1997; Eklund et al., Reference Eklund, Mack and Hart1996; McAuley & Burman, Reference McAuley and Burman1993; Petrie et al., Reference Petrie, Diehl, Togers and Johnson1996). From the study with data from four different samples of young women, Martin et al. (Reference Martin, Rejeski, Leary, McAuley and Bane1997) have shown that the 9–item unidimensional model does not compromise the validity and reliability of the SPAS and produces a simpler, more parsimonious model with a clearer definition. Nevertheless, given the consistent evidence that social physique anxiety tends to be higher in women than in men (Eklund et al., Reference Eklund, Kelley and Wilson1997; Haase & Prapavessi, Reference Haase and Prapavessis1998), the study of Martin et al. (Reference Martin, Rejeski, Leary, McAuley and Bane1997) was based on women's self-reported measure, so gender invariance could not be analyzed in the model proposed by these authors.
In line with the research of Martin et al. (Reference Martin, Rejeski, Leary, McAuley and Bane1997), later studies have supported the unidimensional structure of the SPAS, reducing the unidimensional model to seven items, and showing its gender invariance (Isogai et al., Reference Isogai, Brewer, Cornelius, Komiya, Tokunaga and Tokushima2001; Lindwall, Reference Lindwall2004; Motl & Conroy, Reference Motl and Conroy2000, Reference Motl and Conroy2001). Using a sample of North American university students of both sexes, Motl and Conroy (Reference Motl and Conroy2000) acknowledged that the 9–item unidimensional model proposed by Martin et al. (Reference Martin, Rejeski, Leary, McAuley and Bane1997) presented acceptable factor validity and gender invariance, but several items had high standardized residual values. Thus, Motl and Conroy proposed the elimination of two items, as one was redundant and the other was more relevant for women than for men. The 7–item model proposed by these authors has shown stronger factor validity than the 9–item model, and is also gender invariant.
Subsequently, Motl and Conroy (Reference Motl and Conroy2001) have used independent samples of university students, replicating the structure of this model and its gender invariance, concluding that researchers can use the SPAS–7 with confidence. Scott, Burke, and Joyner (Reference Scott, Burke and Joyner2004) conducted a test-retest design with a sample of university students of both sexes to assess reliability of the 7–item SPAS. The analysis yielded an intraclass correlation coefficient (ICC) of .94, in support of the reliability of the instrument. Moreover, the model of Motl and Conroy has also been confirmed with adolescents, with satisfactory results (Smith, Reference Smith2004).
Therefore, research of the validation of the SPAS seems to coincide that the 12–item model originally proposed by Hart et al. (Reference Hart, Leary and Rejeski1989) can be reduced to a 7–item model that more clearly reflects the unidimensionalality of the construct social physique anxiety, presenting strong structural validity. In the literature, the 7–item model proposed by Motl and Conroy has provided more evidence of validity, especially in western countries (Hagger et al., Reference Hagger, Asçi, Lindwall, Hein, Mülazimoglu-Balli, Tarrant and Sell2007; Isogai et al., Reference Isogai, Brewer, Cornelius, Komiya, Tokunaga and Tokushima2001; Lindwall, Reference Lindwall2004; Smith, Reference Smith2004; Scott et al., Reference Scott, Burke and Joyner2004). But some works have also found adequate fit indexes by varying some items (Hagger et al., Reference Hagger, Asçi, Lindwall, Hein, Mülazimoglu-Balli, Tarrant and Sell2007; Isogai et al., Reference Isogai, Brewer, Cornelius, Komiya, Tokunaga and Tokushima2001), arguing possible cultural differences in diverse countries. Thus, with a view to having a valid instrument at our disposal to measure social physique anxiety in Spain, and enabling comparisons of this measure with those from other countries from our environment, it is relevant to analyze the factor structure and temporal stability of the model proposed by Motl and Conroy.
Another important aspect in the validation process of the SPAS–7 is that research has mainly been conducted with university samples. Research with adolescent samples is scarce (Hagger et al., Reference Hagger, Stevenson, Chatzisarantis, Pereira Gaspar, Leitão Ferreira and González Ravé2010; Martin, Reference Martin1999; Smith, Reference Smith2004; Thompson & Chad, Reference Thompson and Chad2002), in spite of the apparent importance of this construct at these ages. Adolescence is a period of rapid biological changes. The accompanying changes in adolescents' bodies, especially height and weight, can cause such physical aspects to become a defining characteristic at these ages. Specifically, early physical maturation with regard to one's group has been observed to be more important for boys than for girls (Thompson & Chad, Reference Thompson and Chad2002). This association is probably related to the messages transmitting the social value of thin bodies for women and muscular bodies for men. Research suggests that adolescents have high expectations of being assessed in the physical domain, although with gender differences; hence, research of the SPAS in adolescents could further our understanding of psychological aspects and help to maintain exercise at these ages. The scarce research of social physique anxiety in adolescents may be due to the lack of measures of social physique anxiety for these ages. For the SPAS to continue to develop, it should be examined with samples other than adult populations, because instruments used with adults cannot be assumed to be appropriate for youngsters who are still developing.
Considering all these aspects, this research had two goals. The first goal was to confirm the factor structure of the version of Motl and Conroy (Reference Motl and Conroy2000, Reference Motl and Conroy2001) of the Social Physique Anxiety Scale (SPAS–7) in a sample of adolescents in the Spanish context. For this purpose, confirmatory factor analysis was conducted, and item correlations, internal consistency, temporal stability, factor invariance across gender and body mass index (BMI) were analyzed.
The second goal was to obtain evidence of structural validity from the differential effects of gender and BMI on the SPAS–7. Works that have investigated differences in body image show that gender and BMI affect adolescents' perception of and satisfaction with their bodies (Caglar, Bilgili, Karaca, Ayaz, & Asci, Reference Caglar, Bilgili, Karaca, Ayaz and Asci2010; Chu, Bushman, & Woodard, Reference Chu, Bushman and Woodard2008; Hagger et al., Reference Hagger, Stevenson, Chatzisarantis, Pereira Gaspar, Leitão Ferreira and González Ravé2010; Lodewyk, Gammage, & Sullivan, Reference Lodewyk, Gammage and Sullivan2009). On the basis of prior research, we hypothesize that girls will display higher levels of social physique anxiety. Likewise, we hypothesize that students with higher BMI will have higher mean scores in the SPAS.
Method
Participants
Participants in this study were 398 secondary education students (220 boys and 178 girls), aged between 12 and 19 years (M = 15.08, SD = 1.94) from the city of Almería (Spain). Participants' BMI ranged between 12.76 and 30.74 (M = 20.84, SD = 3.09), although 15 students did not indicate their height or weight and were therefore excluded from the analyses that considered this variable.
Measures
Social Physique Anxiety Scale (SPAS; Motl & Conroy, Reference Motl and Conroy2000, Reference Motl and Conroy2001). We used the Spanish version (see Appendix) of the unidimensional model of the Social Physique Anxiety Scale established by Motl and Conroy (Reference Motl and Conroy2000, Reference Motl and Conroy2001). This instrument is made up of seven items (e.g., “I am sometimes annoyed because I think that others are judging my weight or physical fitness negatively”). The participants responded on a Likert scale ranging from 1 (never) to 5 (always). Higher scores are related to symptoms of social physique anxiety, except for Item 5, which is redacted inversely (e.g., "I feel comfortable about how others appraise my body”).
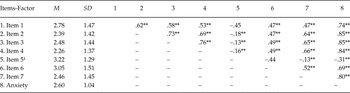
Descriptive Statistics and Correlations of all the items of the SPAS–7

** p < .01/¹ Drafted inversely.
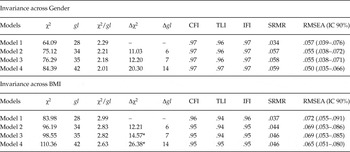
Multi-Group Invariance Analysis across Gender and BMI

* p < .05
Body Mass Index (BMI). Although weight and height can be obtained by direct measurement following anthropometric protocols, recent research has shown that there are no important differences between directly obtained and self-reported data (Gay, Monsma, & Torres-McGehee, Reference Gay, Monsma and Torres-McGehee2009). Therefore, as self-reported weight and height are usually sufficient to calculate BMI, thereby saving time and money, we asked participants to report their weight and height. BMI was calculated by means of the formula: BMI = weight (kg)/height² (m).
Procedure
Specialists in psychology of physical activity selected the SPAS–7 (Motl & Conroy, Reference Motl and Conroy2000, Reference Motl and Conroy2001) for use in the Spanish context. It was considered a simple and useful instrument to measure social physique anxiety in Spain, taking into account the psychometric properties of the original version and its possible comparison with measures from other countries of our cultural environment. First, we translated the scale using the backward translation strategy (Hambleton, Reference Hambleton and Muñiz1996). During this process, the original scale was translated into Spanish by a group of translators and subsequently, another group of translators translated it back into English. The accuracy of the translation was judged according to its degree of coincidence with the original version. The version obtained was analyzed by three experts in physical activity (Lynn, Reference Lynn1986) to guarantee that the items were appropriate to measure the intended construct and that they retained the original meaning. Based on the ensuing debate, only minor changes were carried out.
After translating the scale, the boards of directors of various schools were contacted, requesting their collaboration. The school directors reported our intentions to the Physical Education Departments, and these teachers agreed to collaborate. As the students were minors, we requested their parents' authorization to participate in this research.
Before this study, the scale was administered to a small group of Compulsory Secondary Education students, aged between 12 and 16 years, to confirm their comprehension of the items. The students reported understanding all the items perfectly.
The scale was administered in class in presence of the main investigator, who briefly explained the relevance of the study and gave instructions to complete the instrument. The main investigator also clarified any doubts about the meaning of the items during the administration of the scale. In one case only, it was necessary to clarify that Item 3 referred to any social situation where participants had felt nervous about their physique; also, the ascending scale range (1 to 5) was clarified twice. As they completed them, the students handed in the instruments individually, to enable detection of errors and verify that that no responses were missing.
Data Analysis
An initial analysis of the psychometric properties of the SPAS–7 was conducted to determine its validity and reliability in the Spanish context. For this purpose, first, descriptive and correlational analyses of the items were conducted. Second, to assess the reliability of the scale, we calculated internal consistency with Cronbach's alpha coefficient and analyzed temporal stability using test-retest with a different sample of students. Next, confirmatory factor analysis and analysis of factor invariance across gender and BMI were performed. Lastly, we examined the differences in the means of the SPAS across gender and BMI using analysis of invariance. In each analysis, the means of a group (i.e., girls and overweight-obese) were freely estimated in comparison with the means of the other reference group (i.e., boys and normoweight and underweight), which had been fixed at zero. Thus, the analysis of differences of means in social physique anxiety across gender and BMI were observed through the parameter estimates in the comparison groups. Significant differences in each case were determined by the value of z of the latent mean (i.e., the parameter estimate of the latent mean divided by its standard error). The magnitude of the differences in the mean was expressed according to the scale units (1 to 5 for the SPAS–7).
As Mardia's coefficient was high (19.54), maximum likelihood method with bootstrapping procedure was used. This procedure provides a mean of the estimations obtained from the bootstrap resampling and its standard error. It also compares the values estimated without bootstrap with the means obtained through resampling, showing the level of bias. Considering the confidence intervals (difference between the highest and lowest estimated values in the diverse resamplings) of the regression weights and standardized regression weights, zero falls outside the confidence intervals, indicating that the estimated values were significantly different from zero. We can thus assume that the results of the estimations were robust and not affected by lack of normality (Byrne, Reference Byrne2001).
In order to accept or reject the model of the SPAS–7, we used a combination of various fit indexes: χ2/df, CFI (Comparative Fit Index), TLI (Tucker Lewis Index), IFI (Incremental Fit Index), RMSEA (Root Mean Square Error of Approximation) plus their 90% confidence interval and SRMR (Standardized Root Mean Square Residual). Given that χ2 is very sensitive to sample size (Jöreskog & Sörbom, Reference Jöreskog and Sörbom1993), we used χ2/df, which is considered acceptable at values lower than 5 (Bentler, Reference Bentler1989). Incremental indexes (CFI, TLI, and IFI) show good fit at values of .95 or greater, whereas error indexes are considered acceptable at values equal to or lower than .06 for RMSEA and .08 for SRMR (Hu & Bentler, Reference Hu and Bentler1999). Other authors consider values equal to or lower than .08 are acceptable for RMSEA (Browne & Cudeck, Reference Browne, Cudeck, Bollen and Long1993).
Results
Descriptive Statistics and Analysis of Correlations of the Items
Table 1 shows that the students scored moderately in social physique anxiety (M = 2.46), indicating that they do not feel high levels of concern about the pressure of others' assessment of their bodies. Pearson correlations analysis revealed a positive and significant association among all the items, except for Item 5, drafted inversely. The values were not very high, suggesting the inexistence of overlapping of items. The correlation between Item 5 and the remaining items was negative, presenting low and significant values with only 4 of the 6 items (Items 2, 3, 4, and 7). However, the correlations between each item and the global measure of social physique anxiety were significant in all cases: -.31 for Item 5, and between .69 and .85 for the remaining items.
Reliability Analysis
To determine scale reliability, we conducted analysis of internal consistency and temporal stability. Analysis of internal consistency yielded a Cronbach alpha value of .85 for the SPAS–7.
To analyze temporal stability of the scale, we used an independent sample of 114 students of Compulsory Secondary school, aged between 12 and 18 years (M = 14.38, SD = 1.35). We administered the SPAS–7 twice, with a 4–week interval between the first and second data collection. We then obtained the intra-class correlation coefficient (ICC) for the scale. The means for the SPAS–7 were 2.69 (SD = .93) and 2.58 (SD = .90) with an ICC of .82, CI = [.74, .87]. Therefore, temporal stability of the scale was high.
Confirmatory Factor Analysis
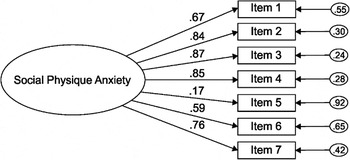
After reversing Item 5, the results of the 7–item model (Figure 1) yielded acceptable fit indexes: χ2(14, N = 398) = 45.91, p < .001; χ2/df = 3.28, CFI = .98; TLI = .96, IFI = .98, RMSEA = .076; 90% CI [.052, .101]; SRMR = .032. However, Item 5 had a factor loading value of .17 (p < .01). The factor loadings of the remaining items were higher, ranging between .59 and .87, and statistically significant (p < .001).
Confirmatory Factor Analysis of the SPAS–7. The ellipses represent the factors and the rectangles represent the diverse items. The residual variances are in the small circles.

Given the lower factor loading of Item 5, it was eliminated, and a 6–item model was tested. The fit indexes of this model were somewhat worse, albeit acceptable: χ2(9, N = 398) = 37.59, p < .001; χ2/df = 4.18; CFI = .98; TLI = .96; IFI = .98; RMSEA = .089; 90% CI [.061, .120]; SRMR = .030. In this model, there were hardly any changes in the standardized factor loadings, significant (p < .001) and ranging between .59 and .87.
Analysis of Invariance
Table 2 show the diverse fit indexes for the four models compared in the analysis of invariance across gender. No significant differences were found between Model 1 (unconstrained model) and Model 2 (invariant measurement weights), Model 3 (invariant structural variances and covariances) and Model 4 (invariant measurement residuals). The lack of significant differences between Model 1 and Model 2 entails a minimal criterion in order to accept the existence of the model's invariance across gender (Byrne, Shavelson, & Multen, Reference Byrne, Shavelson and Muthén1989; Marsh, Reference Marsh1993).
The cut-off value between the classification of normoweight and overweight in adolescents (23.45) was used to establish two groups of BMI and to analyze the model's invariance across these two groups (Cole, Bellizzi, Flegal, & Dietz, Reference Cole, Bellizzi, Flegal and Dietz2000). The first group was composed of 313 students with BMI between 12.76 and 23.44 (M = 19.78, SD = 2.61). The second group was made up of 70 students with BMI between 23.46 and 30.74 (M = 25.58, SD = 1.94). In Table 2 are shown the diverse fit indexes for the four models within the analysis of invariance across BMI. No significant differences were found between Model 1 (unconstrained model) and Model 2 (invariant measurement weights). But there were significant differences between Model 1 and Model 3 (invariant structural variances and covariances) and Model 4 (invariant measurement residuals). Therefore, the lack of significant differences between Model 1 and Model 2 showed that the SPAS–7 model was also invariant across BMI.
Analysis of Differential Effects
We compared the means for each variable of the two groups used for the analysis of invariance across gender and BMI. In the case of gender, the mean of the latent variable in the group of boys was fixed at zero, and the mean in the group of girls was freely estimated. The parameters obtained were positive and significant (M = .36, z = 3.17, p < .01), showing that girls scored higher in social physique anxiety than boys (M girls = 2.84, SD = 1.07; M boys = 2.41, SD = .97). For BMI, the mean of the latent variable in the normoweight and underweight group was fixed at zero, and the mean in the overweight and obese group was freely estimated. The parameters obtained were also positive and significant (M = .51, z = 3.10, p < .01), showing that students classified according to BMI as overweight and obese reported higher levels of social physique anxiety than students classified as normoweight and underweight (M Ow–Ob = 2.98, SD = 1.16; M No–Uw = 2.51, SD = .98).
Discussion
The goals of this work were to provide evidence of the factor validity, internal consistency, and temporal stability, and validity of the SPAS–7, based on the differential effects of gender and BMI on the scale (Motl & Conroy, Reference Motl and Conroy2000, Reference Motl and Conroy2001). The results show that the SPAS–7 is a valid and reliable instrument to assess social physique anxiety in adolescents. Moreover, the results of this research indicate that, despite gender and BMI differences in item responses, there is no reason to assume that the factor structure of the SPAS–7 is sensitive to these variables. Therefore, as the model of the SPAS–7 measures both sexes and students with different BMIs similarly, comparisons of social physique anxiety across gender and BMI are possible with the SPAS–7. Nevertheless, the results of the study suggest various issues that should be addressed in future works.
First, the results provide support for the factor validity of the SPAS–7 model. All items correlated significantly with the global measure of social physique anxiety. As in prior works exploring the SPAS–7 (Hagger et al., Reference Hagger, Asçi, Lindwall, Hein, Mülazimoglu-Balli, Tarrant and Sell2007; Isogai et al., Reference Isogai, Brewer, Cornelius, Komiya, Tokunaga and Tokushima2001; Motl & Conroy, Reference Motl and Conroy2000, Reference Motl and Conroy2001; Scott et al., Reference Scott, Burke and Joyner2004; Smith, Reference Smith2004), confirmatory factor analysis yielded acceptable fit indexes for this model, and internal consistency and temporal stability were adequate, with values greater than .70 (Nunnally, Reference Nunnally1978). Item 5, drafted positively and inversely to the remaining items, had lower correlations (nonsignificant with Items 1 and 6). This item also had a lower factor loading than the rest of the items. In spite of this, confirmatory factor analysis revealed acceptable fit indexes for the SPAS–7 model, with better indexes than a hypothetical reduced model obtained by eliminating Item 5. Hence, confirmatory factor analysis verified the structure of the SPAS–7 for adolescents, suggesting that this instrument measures the construct social physique anxiety according to the conceptualization established by Hart et al. (Reference Hart, Leary and Rejeski1989). Nevertheless, it is recommended to replicate this study with other samples to analyze the comprehension and fit of this item within the unifactorial model of the SPAS. The inverse and positive drafting of this item with regard to the rest of the items may have caused some problems of interpretation. In fact, as mentioned in the reduction process of the SPAS–12 (Eklund et al., Reference Eklund, Mack and Hart1996; Motl & Conroy, Reference Motl and Conroy2000), the positive form of the items (e.g., "I feel at ease about the way others appraise my body") could indicate a feeling of comfort about the presentation of one's body, which is conceptually far from the construct of social physique anxiety (Hart et al., Reference Hart, Leary and Rejeski1989). Therefore, future studies could compare the model of the SPAS–7 of Motl and Conroy with a model in which Item 5 was drafted negatively, consistently with the rest of the items and, certainly, more coherent with the negative meaning involved in the definition of social physique anxiety (Hart et al., Reference Hart, Leary and Rejeski1989). Furthermore, as the validation of SPAS to the Spanish context should be an ongoing process, future works could also use the original 12–item version proposed by Hart et al. (Reference Hart, Leary and Rejeski1989), or the 9–item version of Martin et al. (Reference Martin, Rejeski, Leary, McAuley and Bane1997) to analyze whether the substitution of Item 5 with one of the other items contemplated in former versions shows a better fit of the model to Spanish adolescent population.
Second, this study found evidence of validity from the analysis of the differential effects of gender and BMI on the SPAS–7. Multigroup factor analysis comparing the latent means showed that girls scored higher in social physique anxiety than boys. Likewise, students classified according to BMI as overweight and obese scored higher in social physique anxiety than those classified as underweight and normoweight. These results are consistent with prior research revealing a relation between gender and physique and social physique anxiety (Gargari et al., Reference Gargari, Khadem-Haghighian, Taklifi, Hamed-Behzad and Shahraki2010; Hagger et al., Reference Hagger, Stevenson, Chatzisarantis, Pereira Gaspar, Leitão Ferreira and González Ravé2010; Kowalski et al., Reference Kowalski, Mack, Crocker, Niefer and Fleming2006; Mülazimoglu-Balli, Koca, & Aşçi, Reference Mülazimoğlu-Balli, Koca and Aşçi2010). As detailed in research, women and people with more body fat usually distort their body image, overestimating their size and body weight (Gargari et al., Reference Gargari, Khadem-Haghighian, Taklifi, Hamed-Behzad and Shahraki2010; Mendelson & White, Reference Mendelson and White1985; Storch et al., Reference Storch, Milsom, DeBraganza, Lewin, Geffken and Silverstein2007; Thompson & Chad, Reference Thompson and Chad2002). This tendency has been associated with sociocultural factors, with emphasis on the influence of family, friends, and mass media (Petrie et al., Reference Petrie, Diehl, Togers and Johnson1996). Therefore, in view of the habitual emphasis in our society on thinness (Murray, Reference Murray2008), overweight or obese girls and people may be more inclined to overestimate their body size and feel dissatisfied with their body image, thereby explaining the association with higher values in social physique anxiety.
Although the results of this study provide psychometric support for the SPAS–7, some limitations should be addressed. First, one of the items (item 5) had a low factor loading in this model, so future studies should address adolescents' comprehension of this item. Second, invariance across BMI was only partial, as significant differences were found between the unconstrained model and some of the invariant models. Third, in this study, we analyzed the relation between social physique anxiety, gender, and BMI. Within this analysis, the data to calculate BMI were obtained from self-reports; it would be interesting to collect direct data in future research, if conditions and resources allow. Lastly, future studies should attempt to use more behavioral variables with a view to collecting evidence of criterion validity.
In summary, the SPAS–7 is shown to be a valid and reliable instrument to measure social physique anxiety in Spanish adolescents. Nevertheless, given the preceding variations in the validation process of the SPAS with adult population and possible interpretation problems with Item 5 in this study in the SPAS–7 model of Motl and Conroy (Reference Motl and Conroy2000, Reference Motl and Conroy2001), we suggest that future studies start with the 9– or 12–item structure until the validation process determines whether any SPAS models yield better fit indexes for adolescent populations. The validation of the model requires further steps in which the nomological network related to the construct can be studied. But, for this purpose, we first needed an instrument with a solid internal structure, and this work has contributed to this end.
This work was carried out with the aid of the research project entitled “Analysis of the influence of physical education classes in physical activity adherence and adoption of healthy lifestyle habits after concluding compulsory education” (Ref. DEP2010–17063), funded by the Ministerio de Ciencia e Innovación, Spain.
The authors would particularly like to thank the paper’s reviewers as well as Juan García García (Universidad de Almería) and Paula Elosua Oliden (Universidad del País Vasco) for offering constructive comments on this paper.
Appendix 7–item Social Physique Scale (SPAS–7)