1. Introduction
Recent empirical studies on industry-level exporting have documented a wide array of new and often unexpected sources of comparative advantage. For instance, it has been well established that patterns of specialization and trade can be explained by cross-country differences in the quality of institutions (Levchenko, Reference Levchenko2007; Nunn, Reference Nunn2007; Cuñat and Melitz, Reference Cuñat and Melitz2012; Manova, Reference Manova2013), demographic composition (Cai and Stoyanov, Reference Cai and Stoyanov2016), fiscal policies (Sharma, Reference Sharma2020), and natural resources (Debaere, Reference Debaere2014), among others. Consistent with the classic Heckscher-Ohlin theory, these findings have highlighted the importance of country-level factor endowments in explaining trade flows. While the impact of relative factor abundance has received considerable attention, the distributional characteristics of endowments are less understood but extremely important for unpacking determinants of comparative advantage.
In this paper, we explore the role of relative skill dispersion, which captures the degree of variability in skill levels among workers between exporters and importers, as an alternative force shaping the pattern of trade across industries. Our work builds upon and extends the seminal contributions of Grossman and Maggi (Reference Grossman and Maggi2000) and Bombardini et al. (Reference Bombardini, Gallipoli and Pupato2012, Reference Bombardini, Gallipoli and Pupato2014), who theoretically and empirically link skill dispersion to a country’s comparative advantage. Our key innovation lies in focusing on the difference in skill dispersion between exporters and importers, rather than the absolute skill dispersion of exporters.Footnote 1 Specifically, we posit that regions with a more diverse labor force relative to their trading partners may tend to specialize in sectors where workers’ talents are easily substitutable in production. On the contrary, regions having a more homogeneous working population are likely to have a comparative advantage in industries with complementary tasks. Importantly, we propose a novel link between relative skill dispersion and the characteristics of exported products. Our hypothesis suggests that regions with higher relative skill dispersion export higher-quality products and a more diverse range of goods in industries with lower skill complementarity. By explicitly considering the relative skill dispersion between trading partners and exploring underlying mechanisms, we provide a more comprehensive understanding of the relationship between skill distribution and trade specialization patterns.
To guide our empirical analysis on relative skill dispersion and regional trade flows, we develop a parsimonious multi-sector Ricardian trade model, which features worker heterogeneity in productivity across countries and industries. In the model, countries differ in the distribution of skills in the workforce, whereas sectors vary by the degree of substitutability of tasks in the production. With the assumption of log-normal distribution of skills across workers, we obtain analytical solutions for both regional trade flows and consumer welfare. The most basic and unambiguous prediction from the model is that countries with greater skill dispersion relative to trading partners export a higher volume of goods in sectors characterized by a less complementary production technology. Crucially, this theoretically explains why it is relative skill dispersion rather than absolute skill dispersion that matters for the pattern of trade. Our theoretical framework, while drawing on insights from Bombardini et al. (Reference Bombardini, Gallipoli and Pupato2014), provides an additional dimension: exporters with lower absolute skill dispersion can achieve comparative advantage in high skill substitutability sectors when trading with partners possessing even lower skill dispersion. Furthermore, our model also suggests that the interaction of relative skill dispersion and skill substitutability can improve consumer welfare of a country through an increase in its exposure to international trade.
In an effort to test the theory, we exploit data on Chinese provincial export flows to OECD countries. The Chinese context offers a complementary perspective to existing cross-country studies by providing an alternative way to examine the impact of skill distribution on trade patterns. While cross-country analyses have yielded valuable findings, they often struggle to disentangle the effects of skill dispersion from broader institutional environments. Our within-country approach addresses this challenge by creating a quasi-experimental setting that holds constant many slow-moving, country-level institutional factors. This strategy is informed by the work of Bombardini et al. (Reference Bombardini, Gallipoli and Pupato2012), who suggest that cross-country variations in skill distributions are influenced by institutional factors such as the degree of centralization in education systems, curricular control, and the shares of private and public schools. By focusing on provinces within China, we are able to control for these national-level institutional characteristics, potentially reducing some sources of confounding variables present in cross-country comparisons. The rich provincial-level data also allow us to investigate potential mechanisms, such as product quality and diversity, through which relative skill dispersion affects bilateral trade flows—an analysis that is often challenging in cross-country studies due to data limitations.
Despite the fact that China’s provinces share the same trading system and tariff barriers, two salient features of provincial trade warrant attention. Firstly, there are significant regional disparities in export volumes. In 2021, the eastern coastal region’s total export volume was four times that of the central and western regions combined. Secondly, the export structure varies remarkably across provinces. For instance, while the equipment manufacturing and chemical industries perform better in the eastern region, the central and western regions mainly specialize in the food processing and metal smelting industries. The diverse specialization within China’s borders parallels the varied export profiles observed across different countries globally. These intra-national variations in trade patterns not only provide the necessary sources of identification but also facilitate investigation of the determinants of export specialization within a relatively homogeneous institutional context.Footnote 2
To implement our empirical exercises, we employ multiple datasets from various sources, such as China’s Customs, the China population census, and nationally representative household surveys. These datasets offer diverse and valuable information relevant to our study. Specifically, we construct variables of provincial exports at the sector level based on data from China’s Customs, which elicits detailed information on the quantity and value of goods exported from each province in China. To measure the degree of substitutability of skills in each industry, we adopt two approaches following Bombardini et al. (Reference Bombardini, Gallipoli and Pupato2012). The first proxy is the dispersion of residual wages within industries. For this purpose, we rely on the China population census which collects data on individual employment status and wages. The second approach quantifies the significance of teamwork and communication in each industry using data from the Occupational Information Network (O*NET). We group O*NET occupations into the standard classification of Chinese industries using the occupational codes provided by the census. We utilize household survey data on test scores to calculate residual skill dispersion in the working population for each province. By combining these different data sources, we are able to examine how relative skill dispersion between exporting provinces and importing countries, interacted with sectoral skill substitutability, affects provincial trade flows in each industry.
Our results show that it is the relative skill dispersion between trading partners, rather than the absolute level of skill dispersion among exporters solely, that determines the pattern of specialization. Consistent with the theoretical prediction, we find that regions with a more dispersed skill distribution relative to their trading partners have a comparative advantage in sectors with a lower degree of skill complementarity. We also define several relative ranking indexes that reflect the relative position of skill dispersion between exporters and importers. Using these alternative measures also yields supportive evidence for the crucial impact of relative skill dispersion on export flows. However, in contrast to previous studies, we do not observe any significant relationship between export volume and exporters’ skill dispersion. Our findings complement the traditional theory of international trade by strengthening the argument that not only the aggregate level but also the distribution of factor endowments is indispensable for interpreting comparative advantages across regions.
We next investigate whether less developed regions are more sensitive to the influence of relative skill dispersion in forming exporting outcomes. Our analysis demonstrates that the interaction of relative skill dispersion and sectoral skill substitutability has a significantly more pronounced impact on trade flows among provinces located in the western area, those with a lower per capita GDP, or those with a lower volume of exports. These patterns suggest that relative skill dispersion plays a critical role in boosting trade for provinces facing greater economic challenges, such as those with lower levels of economic development and export activity. By specializing in sectors with substitutability across tasks, higher relative skill dispersion not only raises overall provincial export flows but also reduces disparities in exports across provinces.
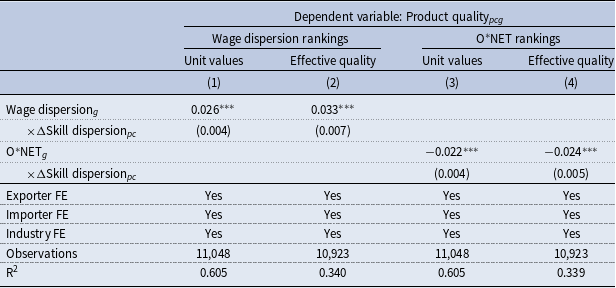
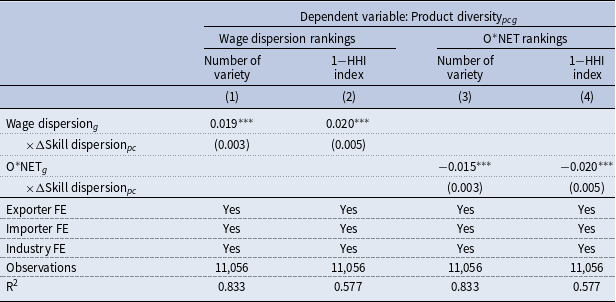
Examining the mechanisms that drive our results, we find evidence that the increased provincial exports may arise from enhanced product quality and diversity. Specifically, we show that provinces with a more dispersed skill distribution relative to their trading partners tend to export higher quality products in industries with lower skill complementarity. This improvement in product quality has increased their competitiveness in the international market, supporting the theoretical hypothesis in Alcalá (Reference Alcalá2016) that the average quality of exports in an industry rises with the comparative advantage in that industry. Additionally, we document that higher relative skill dispersion leads to an increase in export diversity among sectors with a higher degree of skill substitutability. This indicates that relative skill dispersion not only affects export volumes intensively but also generates an extensive margin effect through product diversity.
Our paper speaks to several specific bodies of literature. First, we contribute to a large and growing literature examining the impact of factor proportions on the pattern of trade. The central message within this line of work is that countries differ in the abundance of factor endowments, and industries vary by the intensity of factors needed for production. As such, comparative advantage emerges from interactions between country and industry characteristics (Chor, Reference Chor2010). Building on this insight, Romalis (Reference Romalis2004) empirically tests the Heckscher-Ohlin theory by quantifying the importance of capital and skilled labor in specialization using commodity trade data. In recent studies, there has been a shift away from such neoclassical focus towards institutional determinants of comparative advantage. Based on a similar empirical framework, these studies analyze how institutional factors, such as contract enforcement (Levchenko, Reference Levchenko2007; Nunn, Reference Nunn2007), financial development (Beck, Reference Beck2003; Manova, Reference Manova2013), and labor market flexibility (Helpman and Itskhoki, Reference Helpman and Itskhoki2010; Cuñat and Melitz, Reference Cuñat and Melitz2012), can affect global trade flows. In addition to institutional characteristics, Cai and Stoyanov (Reference Cai and Stoyanov2016) have also identified demographic structure as an important non-traditional factor of comparative advantage. We add to this literature by confirming the importance of the distribution of skills in shaping export composition. Although our study is closely related to Bombardini et al. (Reference Bombardini, Gallipoli and Pupato2012), we introduce a novel empirical focus on the interaction between relative skill dispersion of exporter to importer with the degree of substitutability between tasks. Importantly, our findings remain robust when tested on the cross-country data used by Bombardini et al. (Reference Bombardini, Gallipoli and Pupato2012), suggesting that our empirical strategy is consistent with established theory. Additionally, by using Chinese provincial export data, we are better able to separate the effect of relative skill dispersion from the effects of country-specific institutions.
Second, our analysis of underlying mechanisms links our study to others that empirically investigate the importance of product quality and diversity in export performance. While previous research has established the positive impact of product quality and diversity on export volumes (Hummels and Klenow, Reference Hummels and Klenow2005; Broda and Weinstein, Reference Broda and Weinstein2006, Reference Broda and Weinstein2010), we are the first to demonstrate that skill dispersion is a significant determinant of these product attributes. Our paper complements existing literature on export quality, particularly in relation to economic development (Fajgelbaum et al. Reference Fajgelbaum, Grossman and Helpman2011), firm productivity (Baldwin and Harrigan, Reference Baldwin and Harrigan2011; Crozet et al. Reference Crozet, Head and Mayer2012), and institutional environments (Fan et al. Reference Fan, Li and Yeaple2015). We also contribute to previous work on product diversity that recognizes it as a key component of comparative advantage (Gopinath and Neiman, Reference Gopinath and Neiman2014; Melitz and Redding, Reference Melitz and Redding2014; Halpern et al. Reference Halpern, Koren and Szeidl2015; Blaum et al. Reference Blaum, Lelarge and Peters2018; Baqaee et al. Reference Baqaee, Burstein, Duprez and Farhi2023). We not only empirically validate theoretical predictions regarding the influence of product characteristics in shaping trade patterns but also highlight the crucial role of human capital distribution in this process. Our findings reveal that the distribution of skills within a region, rather than just the average skill level, significantly influences export quality and diversity, thereby deepening our understanding of how human capital shapes international trade outcomes.
Our work is also connected with the literature on the structural upgrading of exports in developing countries. Export upgrading, typically achieved through diversification and increased product sophistication, has been shown to significantly enhance economic performance (Hausmann et al. Reference Hausmann, Hwang and Rodrik2007; Hesse, Reference Hesse2008; Jarreau and Poncet, Reference Jarreau and Poncet2012). However, developing countries often face obstacles such as high entry costs and limited institutional capacity when attempting to upgrade their export portfolio (Harrison and Rodríguez-Clare, Reference Harrison, Rodríguez-Clare, Rodríguez-Clare and Harrison2010; Sutton, Reference Sutton2012). Previous research has emphasized foreign direct investment as a potential catalyst for export upgrading, particularly through improved intermediate inputs and knowledge spillovers (Harding and Javorcik, Reference Harding and Javorcik2012; Zhu and Fu, Reference Zhu and Fu2013; Lectard and Rougier, Reference Lectard and Rougier2018). Complementing these findings, we show that aligning regional skill dispersion with sectoral skill substitutability presents an additional avenue for export upgrading. By allowing different regions to leverage their unique skill distributions, more targeted and efficient upgrading strategies can be developed across various sectors.
Finally, in terms of modeling, our study is related to an extensive literature that uses an industry-level Ricardian framework to understand the pattern of international trade and the gains from trade (Bombardini et al. Reference Bombardini, Gallipoli and Pupato2012; Costinot et al. Reference Costinot, Donaldson and Komunjer2012; Alcalá, Reference Alcalá2016; Burstein and Vogel, Reference Burstein and Vogel2017). In our model, worker productivity is allowed to differ depending on the distribution of talent in the labor force as well as the substitutability of skills across tasks. In doing so, we show that comparative advantage stems from productivity differentials across countries and industries. While Bombardini et al. (Reference Bombardini, Gallipoli and Pupato2014) also theoretically link specialization to the distribution of skills in the working population, this paper, to the best of our knowledge, is the first attempt to derive the implication of relative skill dispersion on international trade. In addition, following Dekle et al. (Reference Dekle, Eaton and Kortum2008) and Caliendo and Parro (Reference Caliendo and Parro2015), we provide a tractable framework for quantifying the welfare consequences from the interaction of relative skill dispersion and industrial skill substitutability.
The remainder of the paper is organized as follows. Section 2 provides a theoretical framework linking relative skill dispersion to comparative advantage. Section 3 describes our data and variables. Section 4 presents the empirical strategy and main results. In Section 5, we conduct several robustness checks regarding selection bias and potential omitted factor endowments. Section 6 explores the possible channels through which relative skill dispersion affects trade flows. Section 7 offers concluding remarks.
2. Theory
To develop a conceptual framework that can guide our empirical analysis, we build a parsimonious two-country multi-sector Ricardian trade model with worker heterogeneity in productivity across countries and sectors.Footnote 3 Throughout the model, markets are perfectly competitive. Labor is the only factor of production and each worker has a single unit of labor that is inelastically supplied. Our model closely resembles the setup in Bombardini et al. (Reference Bombardini, Gallipoli and Pupato2012, Reference Bombardini, Gallipoli and Pupato2014), except that we supplement it by incorporating relative skill dispersion into the analysis.Footnote 4 We depart from the usual Eaton-Kortum framework, avoiding the assumption of Fréchet distribution for productivity shocks. Additionally, we extend their model to explore the welfare consequences of strengthening the interaction of relative skill dispersion and skill substitutability. To do so, we follow Dekle et al. (Reference Dekle, Eaton and Kortum2008) and solve for the equilibrium in relative changes, which provides a tractable method for quantifying the welfare effects. More importantly, our model generates testable predictions on how relative differences in skill dispersion between trading partners—rather than the absolute skill dispersion of exporters—influence trade patterns.
2.1 Setup
The representative consumer in country
 $j$
enjoys goods produced by different sectors according to the following Cobb-Douglas utility function:
 \begin{equation*} U_{j}=\prod _{s\in \mathcal {S}}{Q_{j}^{s}}^{\alpha _{j}^{s}}\,, \end{equation*}
where
 $s$
indexes sectors,
 $Q_{j}^{s}$
is the consumption of sector
 $s$
goods, and
 $\sum _{s\in \mathcal {S}}\alpha _{j}^{s}=1$
. Within each sector
 $s\in \mathcal {S}$
, differentiated varieties across countries are aggregated in a CES manner:
 \begin{equation*} Q_{j}^{s}=\left (\sum _{i\in \mathcal {N}}\int _{\omega ^{s}\in \Omega ^{s}}q_{ij}^{s}(\omega ^{s})^{\left .\left (\sigma ^{s}-1\right )\middle /\sigma ^{s}\right .}d\omega ^{s}\right )^{\left .\sigma ^{s}\middle /\left (\sigma ^{s}-1\right )\right .}, \end{equation*}
where
 $\sigma ^{s}\gt 1$
is the elasticity of substitution,
 $\Omega ^{s}$
is the corresponding set of available varieties,
 $q_{ij}^{s}(\omega ^{s})$
is the quantity demanded of variety
 $\omega ^{s}$
produced by sector
 $s$
of country
 $i$
in country
 $j$
. We define the price of a variety by
 $p_{ij}^{s}(\omega ^{s})=\tau _{ij}^{s}p_{ii}^{s}(\omega ^{s})$
, where
 $\tau _{ij}^{s}\gt 1$
is the iceberg trade cost factor. The representative consumer in country
 $j$
maximizes her utility subject to the following budget constraint:
 \begin{equation*} \sum _{s\in \mathcal {S}}\sum _{i\in \mathcal {N}}\int _{\omega ^{s}\in \Omega ^{s}}p_{ij}^{s}(\omega ^{s})q_{ij}^{s}(\omega ^{s})d\omega ^{s}\leq X_{j}\,, \end{equation*}
where
 $X_{j}$
is the total expenditure.
Define the sectoral price index by
 \begin{equation*} P_{j}^{s}=\left (\sum _{i}\int _{\omega ^{s}\in \Omega ^{s}}p_{ij}^{s}(\omega ^{s})^{1-\sigma ^{s}}d\omega ^{s}\right )^{\left .1\middle /\left (1-\sigma ^{s}\right )\right .}, \end{equation*}
which is the Dixit-Stiglitz price index of sector
 $s$
goods in country
 $j$
. The total expenditure of country
 $j$
on sector
 $s$
goods is then given by
 $X_{j}^{s}=P_{j}^{s}Q_{j}^{s}$
. With Cobb-Douglas preferences, the consumer price index can be written as
 \begin{equation*} P_{j}=\prod _{s\in \mathcal {S}}\left (\left .P_{j}^{s}\middle /\alpha _{j}^{s}\right .\right )^{\alpha _{j}^{s}}. \end{equation*}
The utility maximizing choice of differentiated varieties yields the export flows of sector
 $s$
from country
 $i$
to country
 $j$
:
 \begin{equation} X_{ij}^{s}=\int _{\omega ^{s}\in \Omega ^{s}}p_{ij}^{s}(\omega ^{s})q_{ij}^{s}(\omega ^{s})d\omega ^{s}=X_{j}^{s}{P_{j}^{s}}^{\sigma ^{s}-1}\int _{\omega ^{s}\in \Omega ^{s}}p_{ij}^{s}(\omega ^{s})^{1-\sigma ^{s}}d\omega ^{s}. \end{equation}
Under the assumption of perfect competition, firms set prices at marginal cost, i.e.,
 $p_{ii}(\omega ^{s})=\left .w_{i}\middle /T_{i}^{s}(\omega ^{s})\right .$
, where
 $w_{i}$
is the wage rate and
 $T_{i}^{s}(\omega ^{s})$
is the efficiency of producing variety
 $\omega ^{s}$
. We conceptualize productivity
 $T_{i}^{s}(\omega ^{s})$
as a function of both the degree of substitutability of skills within a sector and the overall distribution of skills in the labor force within a country. Specifically,
 $T_{i}^{s}(\omega ^{s})$
is assumed to be determined by a combination of skills across workers according to a CES production function:Footnote
5
 \begin{equation*} T_{i}^{s}(\omega ^{s})=\xi (\omega ^{s})\left (\int _{t\in \mathcal {T}}t^{\delta ^{s}}dS_{i}\left (t\right )\right )^{\left .1\middle /\delta ^{s}\right .}, \end{equation*}
where
 $\delta ^{s}\in \left (0,1\right )$
,
 $\left .1\middle /\left (1-\delta ^{s}\right )\right .$
is the elasticity of substitution across workers’ skills,
 $t$
is the level of skill of the employed workers,
 $S_{i}\left (t\right )$
is the skill distribution of country
 $i$
, and
 $\xi (\omega ^{s})\gt 0$
is a random productivity shock.
The parameter
 $\delta ^{s}$
, which characterizes the production technology of sector
 $s$
, governs the degree of substitutability of skills among workers within the industry. A larger value of
 $\delta ^{s}$
indicates higher skill substitutability in the production process. An implicit assumption here is that in a specific country, regardless of the industry, firms face a consistent distribution of talent in the working population. We further assume that skills in the labor force of country
 $i$
follow a log-normal distribution, i.e.,
 $t\sim \mathcal {LN}\left (\mu _{i},\theta _{i}\right )$
. The log-normal distribution is similar in appearance to the Gamma distribution. This distribution is widely utilized in various modeling scenarios, particularly when the variable of interest is skewed to the right. Since wages, which reflect the skill levels of workers, inevitably present a right-skewed distribution, it is reasonable to expect skills to be log-normally distributed. A larger value of
 $\theta _{i}$
is associated with a more dispersed skill distribution. We use the difference
 $\Delta _{ij}=\theta _{i}-\theta _{j}$
as a measure of relative skill dispersion between two countries.
We denote by
 $\tilde {\mu }_{i}$
and
 $\tilde {\theta }_{i}$
the mean and variance of a log-normal distribution
 $\mathcal {LN}\left (\mu _{i},\theta _{i}\right )$
, respectively. It follows that productivity
 $T_{i}^{s}(\omega ^{s})$
can be rewritten as:
 \begin{equation*} T_{i}^{s}(\omega ^{s})=\xi (\omega ^{s})\tilde {\mu }_{i}\exp\! \left (\frac {1}{2}\left (\delta ^{s}-1\right )\ln \left (\frac {\tilde {\theta }_{i}}{\tilde {\mu }_{i}^{2}}+1\right )\right )\,, \end{equation*}
where
 $\tilde {\mu }_{i}=\exp \left (\mu _{i}+\frac {1}{2}\theta _{i}\right )$
and
 $\tilde {\theta }_{i}=\exp \left (2\mu _{i}+\theta _{i}\right )\left (\exp \left (\theta _{i}\right )-1\right )$
. For simplicity, we assume that the expected skill level are equal across countries, i.e.,
 $\tilde {\mu }_{i}=\tilde {\mu }$
for each
 $i$
.Footnote
6
Then the variance of the skill distribution
 $\tilde {\theta }_{i}=\tilde {\mu }^{2}\left (\exp \left (\theta _{i}\right )-1\right )$
only depends on the value of
 $\theta _{i}$
. Hence the difference
 $\Delta _{ij}=\theta _{i}-\theta _{j}$
serves as a valid measure of relative skill dispersion between two countries.
Let
 $\tilde {T}_{i}^{s}=\tilde {\mu }\exp \left (\left .\left (\delta ^{s}-1\right )\theta _{i}\middle /2\right .\right )$
. Substituting the expression of productivity
 $T_{i}^{s}(\omega ^{s})=\xi (\omega ^{s})\tilde {T}_{i}^{s}$
into equation (1), we obtain
 \begin{equation*} X_{ij}^{s}=\alpha _{j}^{s}X_{j}\left (1+{\tau _{ij}^{s}}^{\sigma ^{s}-1}\left (\frac {w_{j}}{w_{i}}\right )^{1-\sigma ^{s}}\exp \left (\frac {1-\sigma ^{s}}{2}\left (\delta ^{s}-1\right )\Delta _{ij}\right )\right )^{-1}. \end{equation*}
The above equation models the effects of trade costs, wage differentials, and relative skill dispersion between exporters and importers on trade flows across industries with varying degrees of skill substitutability. It formalizes the central hypotheses of our paper, specifically the role of relative skill dispersion in shaping specialization patterns. To provide further clarity, we derive the cross-partial derivative of the logarithm of trade flows with respect to relative skill dispersion and skill substitutability. This derivative illustrates how the interaction between a country’s skill distribution and industry-specific skill substitutability affects trade flows and specialization patterns, which directly informs our empirical approach.
Formally, we investigate whether exporters with a more dispersed labor force than importers have a comparative advantage in sectors with higher skill substitutability. To do so, we define
 $K_{ij}^{s}=\left .\alpha _{j}^{s}X_{j}\middle /X_{ij}^{s}\right .$
, which leads to
 \begin{equation*} \frac {\partial ^{2}\ln X_{ij}^{s}}{\partial \delta ^{s}\partial \Delta _{ij}}=\frac {1}{{K_{ij}^{s}}^{2}}\left (K_{ij}^{s}-1\right )\left (K_{ij}^{s}+\frac {1-\sigma ^{s}}{2}\left (\delta ^{s}-1\right )\Delta _{ij}\right )\left (\frac {\sigma ^{s}-1}{2}\right )\gt 0\,. \end{equation*}
This gives our first proposition.
Proposition 1.
Countries with a more dispersed skill distribution relative to their trading partners (i.e.,
 $\Delta _{ij}$
) tend to export more goods produced by sectors with a higher degree of skill substitutability across workers (i.e.,
 $\delta ^{s}$
).
Thus, when we regress the natural logarithm of export volume on the interaction of relative skill dispersion and skill substitutability, we expect to observe a positive marginal effect. In online Appendix Section B, we reinterpret our model within the “trade in tasks” framework, inspired by Grossman and Rossi-Hansberg (Reference Grossman and Rossi-Hansberg2008) and Ottaviano et al. (Reference Ottaviano, Peri and Wright2015). Specifically, we account for fragmented and geographically dispersed production processes, rather than assuming that all productive tasks within an industry occur in the same location. The extended model continues to predict a similar relationship between relative skill dispersion and regional comparative advantage.
2.2 Welfare analysis
To evaluate the welfare consequences, we exploit the idea of expressing the equilibrium in relative changes proposed by Dekle et al. (Reference Dekle, Eaton and Kortum2008). In this exercise, we decompose the welfare changes into price and trade exposure effects. The price effect is due to changes in absolute skill dispersion, while the trade exposure effect is associated with changes in relative skill dispersion.
For simplicity, we denote by
 $\mathcal {I}_{i}^{s}=\left .\left (\delta ^{s}-1\right )\theta _{i}\middle /2\right .$
the interaction of absolute skill dispersion and skill substitutability, and by
 $\Delta \mathcal {I}_{ij}^{s}=\mathcal {I}_{i}^{s}-\mathcal {I}_{j}^{s}$
the interaction of relative skill dispersion and skill substitutability. Define
 $\gamma _{ij}^{s}=\left .X_{ij}^{s}\middle /X_{j}^{s}\right .$
as the fraction of country
 $j$
’s expenditure on sector
 $s$
goods produced in country
 $i$
. Then the change in
 $\ln \gamma _{ij}^{s}$
can be written as
 \begin{equation*} d\ln \gamma _{ij}^{s}=\left (\sigma ^{s}-1\right )\sum _{l\in \mathcal {N}}\gamma _{lj}^{s}\left (d\ln \left (\frac {\tau _{lj}^{s}}{\tau _{ij}^{s}}\right )+d\ln \left (\frac {w_{l}}{w_{i}}\right )+d\ln \left (\frac {\tilde {\mu }_{i}}{\tilde {\mu }_{l}}\right )+d\left (\Delta \mathcal {I}_{il}^{s}\right )\right ). \end{equation*}
By choosing
 $i=j$
, and let
 $\tilde {\mu }_{i}=\tilde {\mu }$
for each
 $i$
, we have
 \begin{equation*} d\ln \gamma _{jj}^{s}=\left (\sigma ^{s}-1\right )\gamma _{ij}^{s}\left (d\ln \tau _{ij}^{s}+d\ln \left (\frac {w_{i}}{w_{j}}\right )-d\left (\Delta \mathcal {I}_{ij}^{s}\right )\right ). \end{equation*}
Defining
 $P_{ij}^{s}=\left (\int _{\omega ^{s}\in \Omega ^{s}}p_{ij}^{s}(\omega ^{s})^{1-\sigma ^{s}}d\omega ^{s}\right )^{\left .1\middle /\left (1-\sigma ^{s}\right )\right .}$
as an aggregate price term, then from equation (1) we can rewrite the Dixit-Stiglitz price index of sector
 $s$
goods as
 $P_{j}^{s}=P_{ij}^{s}{\gamma _{ij}^{s}}^{\left .1\middle /\left (\sigma ^{s}-1\right )\right .}$
. The change in
 $\ln P_{ij}^{s}$
is given by
 \begin{equation*} d\ln P_{ij}^{s}=d\ln \tau _{ij}^{s}+d\ln w_{i}-d\ln \tilde {\mu }-d\mathcal {I}_{i}^{s}-d\ln \varXi ^{s}\,, \end{equation*}
where
 $\Xi ^{s}=\left (\int _{\omega ^{s}\in \Omega ^{s}}\xi (\omega ^{s})^{\sigma ^{s}-1}d\omega ^{s}\right )^{\left .1\middle /\left (\sigma ^{s}-1\right )\right .}$
is an aggregation of random productivity shocks of sector
 $s$
, which captures the chance of emergence of new technology that improves sectoral productivity.
These results lead to our second proposition.
Proposition 2.
i) Improving the interaction of relative skill dispersion and sectoral skill substitutability (i.e.,
 $\Delta \mathcal {I}_{ij}^{s}$
) increases the importer’s exposure to international trade by reducing the fraction of its expenditure on self-produced goods in that sector (i.e.,
 $\gamma _{jj}^{s}$
). ii) Strengthening the interaction of absolute skill dispersion and sectoral skill substitutability (i.e.,
 $\mathcal {I}_{i}^{s}$
) of the exporter lowers the price of goods in that sector available to the importer (i.e.,
 $P_{ij}^{s}$
).
Since
 $U_{j}=\left .X_{j}\middle /P_{j}\right .=X_{j}\prod _{s\in \mathcal {S}}\left (\left .\alpha _{j}^{s}\middle /P_{j}^{s}\right .\right )^{\alpha _{j}^{s}}$
, the change in the natural logarithm of utility can be written as
 \begin{equation*} d\ln U_{j}=d\ln X_{j}-\sum _{s\in \mathcal {S}}\alpha _{j}^{s}d\ln P_{j}^{s}=d\ln X_{j}-\sum _{s\in \mathcal {S}}\alpha _{j}^{s}\left (d\ln P_{ij}^{s}+\frac {1}{\sigma ^{s}-1}d\ln \gamma _{ij}^{s}\right ). \end{equation*}
By choosing
 $i=j$
and substituting
 $\ln P_{jj}^{s}$
and
 $d\ln \gamma _{jj}^{s}$
into the above equation, we can represent welfare changes in a compact and intuitive way. We summarize this result in the following proposition.
Proposition 3. The change in aggregate welfare can be decomposed into
 \begin{align*} d\ln U_{j}= & \underbrace {d\ln \tilde {\mu }}_{\mathrm {Skill\;effect}}-\underbrace {\sum _{s\in \mathcal {S}}\alpha _{j}^{s}\gamma _{ij}^{s}d\ln \tau _{ij}^{s}}_{\mathrm {Trade\;cost\;effect}}-\underbrace {\sum _{s\in \mathcal {S}}\alpha _{j}^{s}\gamma _{ij}^{s}\left (d\ln w_{i}-d\ln w_{j}\right )}_{\mathrm {Relative\;input\;cost\;effect}}\\ & \quad \quad +\underbrace {\sum _{s\in \mathcal {S}}\alpha _{j}^{s}d\ln \Xi ^{s}}_{\mathrm {Productivity\;shock\;effect}}+\underbrace {\sum _{s\in \mathcal {S}}\alpha _{j}^{s}d\mathcal {I}_{j}^{s}}_{\mathrm {Price\;effect}}+\underbrace {\sum _{s\in \mathcal {S}}\alpha _{j}^{s}\gamma _{ij}^{s}d\left (\Delta \mathcal {I}_{ij}^{s}\right )}_{\mathrm {Trade\;exposure\;effect}} \end{align*}
This equation decomposes the change in utility (
 $d\ln U_{j}$
) for importing country
 $j$
into several distinct components. Each term warrants discussion. The first term, referred to as the “skill effect”, represents changes in the overall skill level, with
 $\tilde {\mu }$
denoting the mean of the skill distribution. As indicated by this term, the importing country’s welfare increases with the level of average skill.
The second term captures variations in trade costs (
 $\tau _{ij}^{s}$
) across all sectors, and, as expected, is inversely related to utility—higher trade costs generally reduce welfare. The third term reflects changes in relative wages between exporter
 $i$
and importer
 $j$
, denoted as the “relative input cost” effect, indicating how differences in labor costs between countries affect utility. It can be seen that welfare losses resulting from the trade cost and relative input cost effects are proportional to the importing country’s openness to trade. The trade cost effect reflects the efficiency loss caused by the iceberg transportation cost of shipping goods from the exporting country to the importing country. The relative input cost effect emerges from the difference in wages between the exporting and importing countries, and a larger relative wage implies a higher relative price of products from the international market.
The fourth term pertains to changes in
 $\Xi ^{s}$
, representing the aggregate effect of sector-specific random productivity shocks. This “productivity shock effect” illustrates how technological progresses or productivity gains in different sectors contribute to utility. Intuitively, welfare gains from the productivity shock effect are related to the potential for technological advancements which enhance sectoral productivity.
Finally, the last two components characterize the effects of skill dispersion on welfare. By inspection, both interactions of skill dispersion and skill substitutability have a positive impact on consumer welfare of the importing country. The interaction from absolute skill dispersion (i.e.,
 $\mathcal {I}_{j}^{s}$
) captures the price effect: it improves the importing country’s welfare through a reduction in the aggregate price term
 $P_{jj}^{s}$
. The interaction from relative skill dispersion (i.e.,
 $\Delta \mathcal {I}_{ij}^{s}$
) captures the trade exposure effect: it raises the importing country’s welfare through an increase in its exposure to international trade
 $\gamma _{ij}^{s}$
.
3. Data
Our main analysis focuses on how relative skill dispersion contributes to regional comparative advantage. We exploit three sets of data: industry-level data on provincial export flows; the dispersion of residual skills in the working population for each exporting province and each importing OECD country; and the extent to which skills are substitutable in sectoral production. In what follows we describe the data sources for our study as well as the construction of the key variables.
3.1 Trade data
We draw on provincial export data from China’s Customs for 2013, which serves as the official data source for tracking the country’s trade flows. The dataset covers virtually all exporting firms in China and offers detailed information on the exported product, the destination country, as well as the shipment values and quantities. The original data are reported at the 6-digit level of the Harmonized System (HS) classification and converted into the Standard International Trade Classification (SITC) using the correspondence table provided by UN Comtrade. In doing so, we can match each exported product to the Chinese Industry Classification (CIC) system. For our empirical analysis, we have obtained a total of 35 industries, 25 exporting provinces and 18 importing OECD countries.
3.2 Skill dispersion
To create our measure of relative skill dispersion, we need to be able to approximate the skill distribution in the working population for both the importers and exporters. For importer skill dispersion, we rely on the survey data from the Programme for the International Assessment of Adult Competencies (PIAAC) conducted between 2011 and 2012. The PIAAC is a project that assesses adult skills in OECD countries through a survey of individuals aged 16–65. The survey evaluates proficiency in key information processing skills, including literacy, numeracy, and problem-solving. We derive an indicator of the overall skill level of an individual by averaging the scores for these three dimensions. Similar to Bombardini et al. (Reference Bombardini, Gallipoli and Pupato2012), we assume imperfect skill observability and construct a measure of residual skill dispersion. In particular, we calculate the standard deviation of the residual
 $\hat {\mu }_{ic}$
from the following regression model:
 \begin{equation} \log \left (Score_{ic}\right )=\boldsymbol{X}_{ic}^{\prime } \boldsymbol{\gamma }_{c}+\mu _{ic} \end{equation}
where
 $Score_{ic}$
denotes the average score of individual
 $i$
in country
 $c$
,
 $\boldsymbol{X}_{ic}$
is a vector of individual characteristics including education, age, gender, migration statusFootnote
7
and job training status. The parameter vector
 $\boldsymbol {\gamma }_{c}$
varies across countries, allowing for different score structures for different countries. By removing the effects of observable individual characteristics, the residual
 $\hat {\mu }_{ic}$
represents the unobservable skill level of individual
 $i$
in country
 $c$
, which is used to calculate the skill dispersion index for our empirical analysis.
For robustness, we also experiment with two different skill dispersion indexes: the 95-5 inter-percentile range and the Gini mean difference. The 95-5 inter-percentile range equals the difference between the 95th percentile and the 5th percentile of the residual scores. The Gini mean difference index is defined as
 $Gini_{c}=\left .\sum _{i\in \mathcal {N}}\sum _{j\in \mathcal {N}}\left |Score_{ic}-Score_{jc}\right |\middle /N\left (N-1\right )\right .$
.
Since China does not participate in the PIAAC survey, we utilize household data from the 2012 China Family Panel Studies (CFPS) to measure the dispersion of skills for each province. The CFPS project is a nationally representative survey that collects individual-level information in 25 provinces. Crucially for our purposes, the survey administers a literacy and numeracy skills test similar to the PIAAC survey. The test, designed to assess an individual’s cognitive and physical abilities, consists of a Chinese word memory test and a number series test.Footnote 8 We restrict our attention to the sample of the working population aged 16–65 years and calculate the average score of the two tests for each individual. We obtain the residual scores from the same regression equation as (2), which are used to construct the three indicators of provincial skill dispersion.
We acknowledge that the CFPS cognitive performance tests are narrower in scope compared to those in the PIAAC used for OECD countries. The CFPS mainly assesses cognitive abilities through word memory and numerical series tests, whereas the PIAAC provides a broader evaluation of adults’ work-related skills. Despite the limitation, we argue that the CFPS remains the most suitable dataset for our study. Primarily, it stands as one of the most comprehensive nationally representative surveys available for China that includes cognitive assessments. Moreover, of particular relevance to our research, the CFPS provides individual-level data across Chinese provinces, allowing us to examine regional variations in skill distribution.Footnote 9 To validate the CFPS-based measures, we analyze the relationship between cognitive test scores and educational attainment, drawing on Gustafsson’s (Reference Gustafsson2016) work.Footnote 10 We find strong positive correlations between both word memory and number series test scores and educational attainment, with similar trends observed.Footnote 11 These findings strongly support the adequacy of the CFPS tests in gauging cognitive skills cultivated through formal education, thus justifying their application as proxies for skill distribution within China’s workforce.
3.3 Industrial skill substitutability
Our paper aims to examine the impact of relative skill dispersion on provincial specialization across industries with varying degrees of skill substitutability. In industries where skills are highly complementary, effective teamwork is essential and similar workforces tend to have a higher marginal output. Conversely, in industries where skills are more substitutable, teamwork appears to be relatively less critical, as workers can contribute to achieving production goals independently or in parallel with others. To gauge the degree of skill substitutability at the sector level, we create two industry-specific measures: residual wage dispersion and communication skill requirement. In what follows we provide a detailed discussion of how the two measures are constructed.
3.3.1 Residual wage dispersion
In labor markets, it is commonly assumed that a worker’s wage is determined by their average marginal productivity, which means that those with higher skill levels typically receive higher wages. The dispersion of wages is therefore heavily influenced by the degree of skill complementarity within a sector, with low complementarity leading to more dispersed wage distributions.Footnote 12 To estimate the wage distribution for each industry, we rely on the 2005 China Population Census to obtain data on individual wage and employment for the working population aged 16–65. We eliminate the effect of observable individual characteristics by performing the following regression:
 \begin{equation} \log \left (wage_{ig}\right )=\boldsymbol{Z}_{ig}^{\prime }\boldsymbol{\rho }_{g}+\eta _{ig} \end{equation}
where
 $wage_{ig}$
is the wage of individual
 $i$
working in industry
 $g$
, and
 $\boldsymbol{Z}_{ig}$
is a vector of individual characteristics including education, age, gender, and province of residence.Footnote
13
We also apply the correction method suggested by Dahl (Reference Dahl2002) to account for the potential non-random sorting of workers into different industries.Footnote
14
We construct a measure of industry-level residual wage dispersion based on the standard deviation of the residual
 $\hat {\eta }_{ig}$
from (3). Similarly, we also create two alternative measures of residual wage dispersion, i.e., the 95-5 inter-percentile range and the Gini mean difference. A higher wage dispersion indicates a higher degree of skill substitutability within an industry, and vice versa.
3.3.2 O*NET occupations
Our second approach for measuring skill substitutability at the industry level is to quantify the importance of teamwork and communication skills for different occupations. We use the data from the Occupational Information Network (O*NET), which provides a detailed description on job requirements and worker attributes for more than 900 occupations. To capture the degree of skill substitutability within an industry, we focus on four O*NET survey questions: (a) Teamwork: How important are interactions that require you to work with or contribute to a work group or team to perform your current job? (b) Contact: How much contact with others (by telephone, face-to-face, or otherwise) is required to perform your current job? (c) Communication: What level of communicating with Supervisors, Peers, or Subordinates is needed to perform your current job? (d) Impact: In your current job, what results do your decisions usually have on other people or the image or reputation or financial resources of your employer? For each question, respondents are asked to rate the importance on a scale of 1 to 5, with 1 denoting not important and 5 denoting extremely important. We combine the scores of these four dimensions into a single aggregate index for each occupation. We then create a mapping between US and Chinese occupations and aggregate the occupation-level O*NET scores to the CIC industry level. The higher the average score for an industry, the lower the level of skill substitutability for that industry.
3.4 Preliminary descriptive evidence
Before turning to formal econometric analysis, we first present preliminary descriptive evidence on the relationship between relative skill dispersion and comparative advantage. The core distinction between the absolute and relative skill dispersion theories lies in their predictions regarding the influence of importers’ skill distributions on trade flows. The absolute skill dispersion theory implicitly suggests that the skill distributions of importers should have no effect on trade flows. In contrast, our relative skill dispersion theory posits that these distributions do play a critical role.
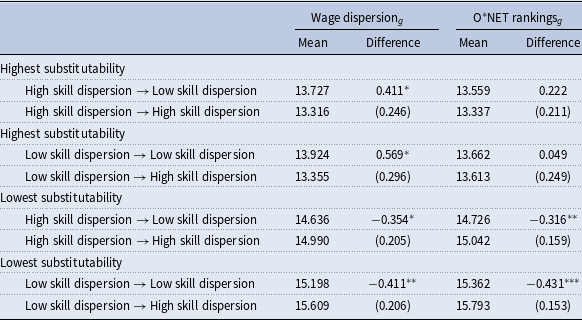
To empirically differentiate between these competing theories, we examine trade volumes among importers with varying levels of skill dispersion for a given exporter. According to our theory, we anticipate observing two distinct patterns. First, for a given exporter, importers with low skill dispersion should exhibit larger trade volumes in sectors characterized by high skill substitutability compared to those with high skill dispersion. Second, in sectors with low skill substitutability, we expect importers with low skill dispersion to have smaller trade volumes relative to those with high skill dispersion. To test these hypotheses, we conduct a mean-comparison test on two groups of importers with differing levels of skill dispersion. However, our findings challenge a key implication of the absolute skill dispersion theory: export volumes should remain constant across importers, regardless of their skill dispersion levels.
Table 1 presents the average export volume for two groups of importers with different levels of skill dispersion in sectors of highest and lowest skill substitutability, respectively. To compare the means of these groups, we apply the method of the Welch’s approximation, which accounts for unequal variances between them. We rank industries according to the degree of skill substitutability using both residual wage dispersion and the aggregate O*NET index. We focus on the top and bottom 5 industries for our descriptive analysis. Similarly, importers and exporters are ranked based on the standard deviation of their residual scores, and we divide them into two groups: high skill dispersion and low skill dispersion. The high skill dispersion group consists of the regions whose skill dispersion index is above the average, while the low skill dispersion group consists of the regions whose index is below the average.
Export volumes across industries and exporter-importer pairs

Notes: We rank industries according to the degree of skill substitutability using residual wage dispersion and aggregate O*NET index, respectively. Here we classify the top and bottom 5 industries as those with highest substitutability and those with lowest substitutability. We group the exporters and importers based on the degree of skill dispersion among their workers. We use the standard deviation of the CFPS (PIAAC) residual scores as the measure of skill dispersion. The high dispersion group includes the regions whose skill dispersion is higher than the average, while the low dispersion group includes the regions whose skill dispersion is lower than the average. We calculate the mean export volume for each exporter–importer pair in different industries. The mean-comparison tests between any two pairs are calculated from the Welch’s approximation formula, which allows for unequal variances in different groups. Standard errors are given in parentheses. The pairwise differences in export volumes between two groups of importers with different skill dispersion are displayed above the standard errors.
***Significant at the 1 percent level.
**Significant at the 5 percent level.
*Significant at the 10 percent level.
Column 1 of Table 1 shows the direction of trade flows, with exporters on the left-hand side and importers on the right-hand side of the arrow. There are several interesting and intuitive facts that emerge from the data. Firstly, for a given group of exporters, trade flows vary significantly across importers depending on their levels of skill dispersion. Secondly, the signs and significance of the mean difference tests remain consistent, regardless of whether industrial skill substitutability is measured using residual wage dispersion or O*NET rankings. Thirdly, within any exporter group, importers with low skill dispersion show larger trade flows in sectors with high skill substitutability, while those with more dispersed skills experience larger trade flows in sectors with low skill substitutability. Lastly, in sectors with low substitutability, export volumes are considerably larger between less skill-dispersed exporters and more skill-dispersed importers, compared to other pairings. Conversely, sectors with high substitutability exhibit larger export volumes among less skill-dispersed importers. Overall, these preliminary findings support our hypothesis that comparative advantages among countries are driven by the relative skill dispersion between exporters and importers, rather than the absolute skill dispersion of exporters alone.
4. The effect of relative skill dispersion on trade flows
In this section, we first introduce the estimation framework, which is derived from our theoretical model. We then present and discuss our main findings followed by a heterogeneity analysis.
4.1 Empirical framework
Table 1 reveals that exporters with a more dispersed skill distribution relative to importers specialize in sectors with high substitutability of workers’ skills, while exporters with a less dispersed skill distribution relative to importers specialize in sectors with low substitutability. To formally test this idea, we estimate the following regression specifications:
 \begin{align} \log (Export_{pcg}) & =\beta _{1}Substit_{g}\times SkillDisp_{p}+\phi _{p}+\phi _{c}+\phi _{g}+\varepsilon _{pcg} \\[-4pt] \nonumber \end{align}
 \begin{align} \log (Export_{pcg}) & =\beta _{2}Substit_{g}\times \Delta SkillDisp_{pc}+\phi _{p}+\phi _{c}+\phi _{g}+\varepsilon _{pcg} \\[4pt] \nonumber \end{align}
where
 $p$
,
 $c$
and
 $g$
are indexes for exporting province, importing country, and industry, respectively. The dependent variable
 $Export_{pcg}$
is the value of exports from province
 $p$
to country
 $c$
in industry
 $g$
. Of prime interest are the interaction terms
 $Substit_{g}\times SkillDisp_{p}$
and
 $Substit_{g}\times \Delta SkillDisp_{pc}$
, where
 $Substit_{g}$
is a measure of industrial skill substitutability,
 $SkillDisp_{p}$
is a measure of absolute skill dispersion of exporter
 $p$
, and
 $\Delta SkillDisp_{pc}=SkillDisp_{p}-SkillDisp_{c}$
is the relative skill dispersion between exporter
 $p$
and importer
 $c$
. These interaction variables capture how absolute and relative skill dispersion affect export volumes in industries with different degrees of skill substitutability. To account for regional and industrial heterogeneities, we also control for a full set of exporter fixed effects
 $\phi _{p}$
, importer fixed effects
 $\phi _{c}$
, and industry fixed effects
 $\phi _{g}$
.
Equation (4), which parallels the main specification in Bombardini et al. (Reference Bombardini, Gallipoli and Pupato2012), focuses on the absolute skill dispersion of exporters without taking into consideration importers’ skill dispersion. Equation (5) provides a refinement by incorporating the difference in skill dispersion between exporters and importers. Both specifications adapt the gravity equation to industry-level trade flows. Such empirical strategies have been used in various studies to shed light on the sources of comparative advantage by analyzing export volumes at the sector level (see, for example, Chor, Reference Chor2010; Levchenko, Reference Levchenko2007; Nunn, Reference Nunn2007; Cuñat and Melitz, Reference Cuñat and Melitz2012; and Asuyama, Reference Asuyama2012).
4.2 Benchmark results
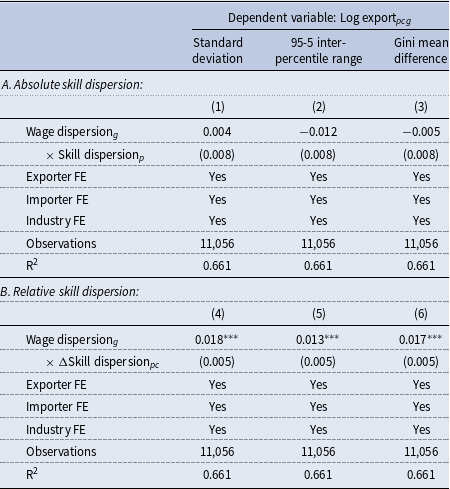
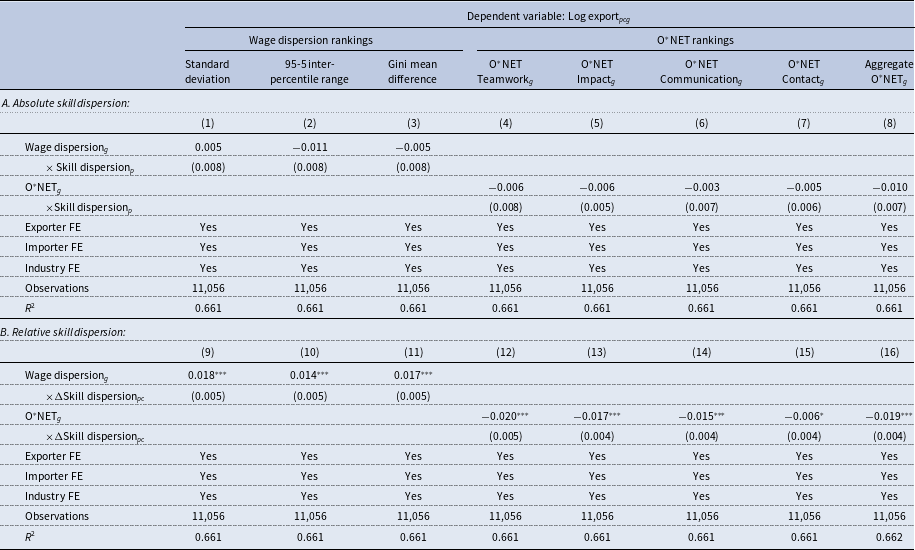
We begin by estimating equation (4) with industrial skill substitutability proxied by residual wage dispersion. The regression results are displayed in Panel A of Table 2. There are three columns, corresponding to our three measures of skill dispersion and skill substitutability—the standard deviation, the 95-5 interpercentile range and the Gini mean difference. As can be seen, the coefficient on the interaction term of interest is statistically insignificant, irrespective of the measure of skill dispersion employed. Contrary to the prediction of the theory, the sign of the coefficient estimate is negative. By solely focusing on the skill dispersion of exporters, we do not find sufficient empirical evidence to link skill dispersion to comparative advantage.
Residual wage dispersion and residual score dispersion

Notes: The dependent variable is the natural logarithm of exports from province
 $p$
to country
 $c$
in industry
 $g$
. “Skill dispersion
p
” measures the level of skill dispersion in province
 $p$
, while “
 $\Delta$
Skill Dispersion
pc
” measures the difference in skill dispersion between province
 $p$
and country
 $c$
. We use three different measures of dispersion, including the standard deviation, the 95-5 inter-percentile range, and the Gini mean difference. Standardized beta coefficients are reported. Bootstrap standard errors clustered by exporter–importer pair in parentheses (50 replications).
***Significant at the 1 percent level.
**Significant at the 5 percent level.
*Significant at the 10 percent level.
We next turn to our modified regression specification (5) which also takes into account the skill dispersion of importers. Panel B of Table 2 reports the corresponding estimates. As expected, the coefficient on the interaction of relative skill dispersion and skill substitutability is positive and statistically significant at the 1% level in all three regressions. This implies that provinces with a more dispersed skill distribution relative to their trading partners export more in sectors with a higher degree of substitutability of workers’ skills. Moreover, on average the size of the coefficients are substantially larger in absolute value than those presented in Panel A. For brevity, unless otherwise stated, we henceforth only report the estimates where skill and wage dispersion are proxied by the standard deviation of residual scores and wages, respectively.
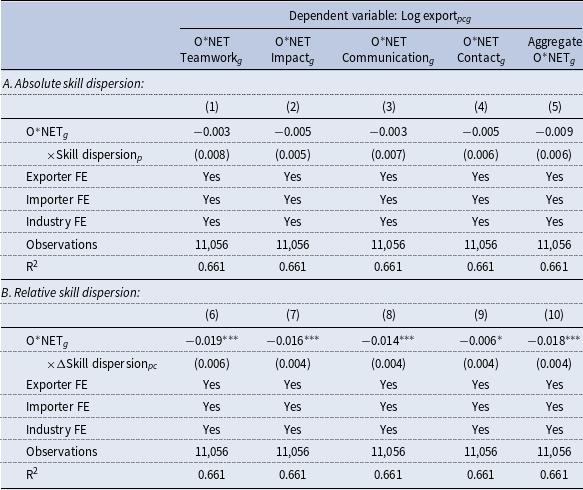
We have also re-estimated the two regressions with skill substitutability measured by O*NET rankings. Table 3 presents the results with a separate model specification for each O*NET index. Since O*NET rankings reflect the extent of complementarity between tasks, the sign of the interaction is expected to be negative. As shown in Panel A, while in each case the coefficient on the interaction with absolute skill dispersion is negative, in no case is statistical significance achieved. Again, when we look at relative skill dispersion in Panel B, the coefficient of interest has the predicted negative sign and significance. Taken together, these results confirm the hypothesized importance of relative skill dispersion, rather than absolute skill dispersion, in determining comparative advantages across regions.Footnote 15
O*NET rankings and residual score dispersion (Standard deviation)

Notes: The dependent variable is the natural logarithm of exports from province
 $p$
to country
 $c$
in industry
 $g$
. “Skill dispersion
p
” measures the level of skill dispersion in province
 $p$
, while “
 $\Delta $
Skill Dispersion
pc
” measures the difference in skill dispersion between province
 $p$
and country
 $c$
. We use five different measures of skill substitutability, including teamwork, impact, communication, contact, and their aggregate value. The skill dispersion is measured by the standard deviation. Standardized beta coefficients are reported. Bootstrap standard errors clustered by exporter–importer pair in parentheses (50 replications).
***Significant at the 1 percent level.
**Significant at the 5 percent level.
*Significant at the 10 percent level.
4.3 Relative rankings of importers and exporters
To further bolster the role of relative skill dispersion, we create two alternative types of proxies based on the standard deviation of residual scores. The first measure looks at the skill dispersion among importers within each exporting province. We rank the importers from most to least skill dispersed, so a higher value of ranking means that the importer has a more homogenous skill distribution among the importing partners of that province. The second measure looks at the skill dispersion among exporters within each importing country. Unlike importer rankings, we now rank the exporters from least to most skill dispersed, so a higher value of ranking indicates a more diverse skill distribution among the exporting provinces of the corresponding importer.Footnote
16
We denote these two ranking measures as
 $Importer\;ranking_{1,pc}$
and
 $Exporter\;ranking_{1,pc}$
.
In addition, based on the stylized facts from Table 1, we conjecture that a comparative advantage in sectors of high (low) skill substitutability is more likely when the exporter has a more (less) dispersed skill distribution than the importer. To verify this idea, we adapt our first type of ranking measures in two directions. First, we rank importers from most to least skill dispersed on a scale of
 $1$
to
 $n$
if their skills are less dispersed than those of the exporters. The rankings of the rest of the importers are set to 0. We denote this measure as
 $Importer\;ranking_{2,pc}$
. Second, we rank importers from most to least skill dispersed on a scale of
 $-n$
to
 $-1$
if they have a higher level of skill dispersion than the exporters. The remaining importers are again assigned a ranking of 0. This measure is referred to as
 $Importer\;ranking_{3,pc}$
. By doing so, we divide importers into two groups based on their skill dispersion compared to the exporters. Similarly, we create two other measures of exporter rankings, denoted as
 $Exporter\;ranking_{2,pc}$
and
 $Exporter\;ranking_{3,pc}$
. These two measures categorize exporters into two groups according to their skill dispersion relative to the importers. In line with our original ranking measures, when interacting with the skill substitutability variable, a higher value implies a greater potential for the exporter to generate comparative advantage.
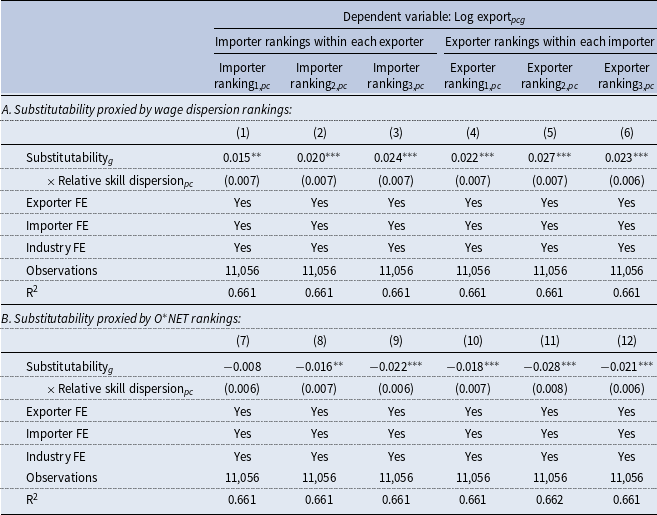
In Table 4, we show estimates from equation (5), in which we measure relative skill dispersion by the importer and exporter ranking indexes discussed above. Panel A displays the results when industrial skill substitutability is proxied by residual wage dispersion. As it turns out, these alternative definitions of relative skill dispersion lead to conclusions that are consistent with our benchmark findings. Specifically, the interaction of skill substitutability and relative skill dispersion ranking has a positive and significant effect on provincial export flows. This suggests that the exporting provinces possess a comparative advantage over their low-ranking trading partners (i.e., importers with homogeneous workforces) in sectors with a high degree of skill substitutability. We obtain similar results when we use the O*NET index to measure skill substitutability as shown in Panel B.Footnote 17 Overall, these additional results lend further weight to the notion that patterns of trade are affected not only by the skill dispersion of exporters but also by that of importers.
Skill substitutability and relative skill dispersion rankings

Notes: The dependent variable is the natural logarithm of exports from province
 $p$
to country
 $c$
in industry
 $g$
. “Importer ranking
 $_{1,pc}$
” measures the ranking of importer skill dispersion from most to least skill dispersed within each exporter. We define “Importer ranking
 $_{2,pc}$
” as the importer ranking on a scale of 1 to
 $n$
within each exporter when the exporter has a more dispersed skill distribution than the importer, and set the value for other importers to 0. “Importer ranking
 $_{3,pc}$
” is the importer ranking on a scale of
 $- n$
to
 $- 1$
within each exporter when the exporter has a lower skill dispersion level than the importer, and the rankings of other importers are specified as 0. Similarly, we define three types of exporter ranking measures that rank exporters from least to most skill dispersed within each importer, denoted as “Exporter ranking
 $_{1,pc}$
”, “Exporter ranking
 $_{2,pc}$
”, and “Exporter ranking
 $_{3,pc}$
”, respectively. Larger values of all three relative ranking measures imply a higher level of relative skill dispersion. We use the standard deviation of residual wages and the aggregate index of O*NET rankings in the regressions. Standardized beta coefficients are reported. Bootstrap standard errors clustered by exporter–importer pair in parentheses (50 replications).
***Significant at the 1 percent level.
**Significant at the 5 percent level.
*Significant at the 10 percent level.
4.4 Heterogeneous effects
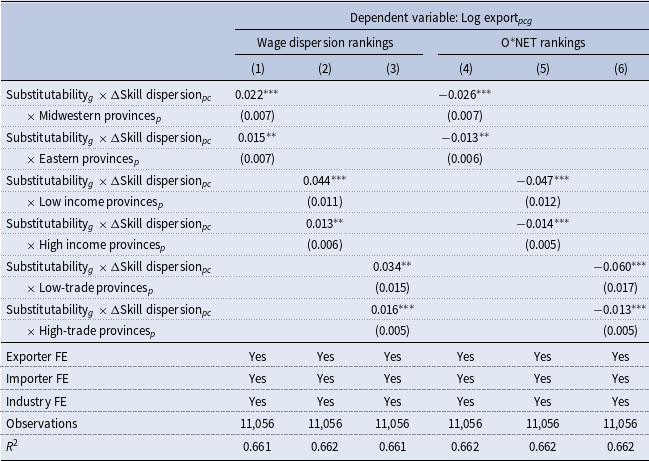
Our major findings, which are reported in Table 2–Table 4, establish a strong relationship between relative skill dispersion and comparative advantages across regions. We next explore how such association varies with regional characteristics. Specifically, we investigate whether the results differ by geographic location (midwestern provinces versus eastern provinces), provincial GDP (high-income provinces versus low-income provinces), and trade volume (low-trade provinces versus high-trade provinces).Footnote 18 To this aim, we modify specification (5) by interacting the cross term of interest separately with indicators for the two groups of provinces based on the above classifications.
Table 5 illustrates the heterogeneous responses along the three dimensions of regional characteristics. We find that the interaction of relative skill dispersion and skill substitutability has a substantially more pronounced effect on export flows among provinces located in the midwestern area, those with a lower GDP and those with a lower trade volume. While the coefficient on the triple interaction term is statistically significant for the two types of provinces in each case, the magnitude for the less developed group is much larger than that for their more developed counterpart. In summary, the evidence shown in Table 5 reveals that the underdeveloped provinces benefit more from comparative advantages that arise due to the interaction of relative skill dispersion and skill substitutability. Such comparative advantages not only increase overall provincial exports, but also help to narrow the gap in exports between provinces. These findings have important implications, suggesting that less developed provinces have the potential to catch up to more developed provinces by leveraging their comparative advantage and promoting exports.
Heterogeneoue effect across different regions

Notes: The dependent variable is the natural logarithm of exports from province
 $p$
to country
 $c$
in industry
 $g$
. The degree of skill dispersion is measured by the standard deviation of residual scores. Substitutability in Columns 1–3 is proxied by the standard deviation of residual wages, while substitutability in Columns 4–6 is proxied by the aggregate index of O*NET rankings. Standardized beta coefficients are reported. Bootstrap standard errors clustered by exporter–importer pair in parentheses (50 replications).
***Significant at the 1 percent level.
**Significant at the 5 percent level.
*Significant at the 10 percent level.
5. Robustness checks
While the results thus far are consistent with our theory, there are potential concerns regarding our empirical approach. In this section we examine several extensions of specification (5) and explore the robustness of our results to variations in the estimation method, inclusion of additional controls, and adjustments for internal migration patterns in skill dispersion measures.
5.1 Selection bias
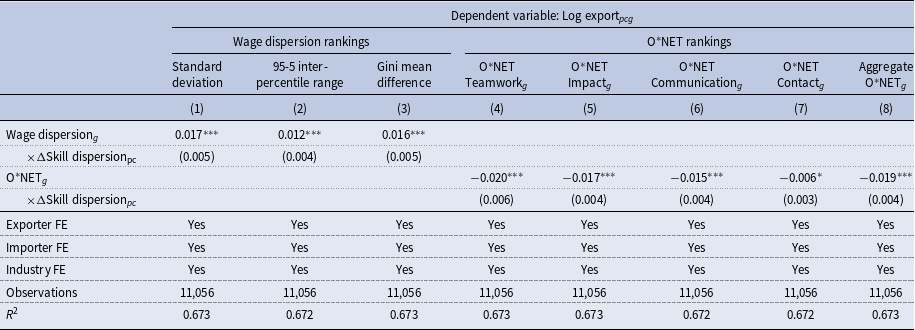
In our dataset, we observe that some Chinese provinces did not trade with OECD countries in certain industries. The observations with zero trade flows constitute nearly 30 percent of the entire sample. One potential problem with our estimation strategy is that it requires excluding zero export values, which may result in biased OLS estimates. To correct for the selection bias, we adopt the two-stage estimation procedure developed by Helpman et al. (Reference Helpman, Melitz and Rubinstein2008). This approach extends the empirical gravity equation by allowing for both the intensive and extensive margins of trade. The intensive margin pertains to the export volume, while the extensive margin models the decision to export.
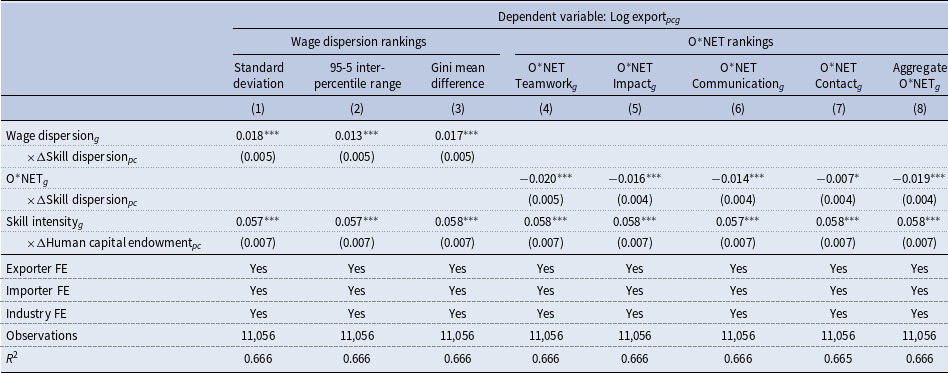
To implement this method, we first estimate the probability of observing positive export flows by using a discrete choice model.Footnote 19 In the second stage, we augment equation (5) with a linear polynomial in the predicted probability up to the third order. Table 6 shows the second stage estimation results. Columns 1–3 report the estimates where substitutability is measured by wage dispersion rankings, and Columns 4–8 use O*NET rankings as proxies. As can be seen, the estimated coefficients of interest are not substantively changed from our baseline regressions presented in Table 2 and Table 3. Therefore, our findings appear to be unaffected by the sample selection issue caused by zero trade observations.
Robustness checks I: correction for selection bias (HMR method)

Notes: The dependent variable is the natural logarithm of exports from province
 $p$
to country
 $c$
in industry
 $g$
. The predicted probabilities of decision to export are included in all regressions in the form of a linear polynomial up to the third order. The degree of skill dispersion is measured by the standard deviation of residual scores. Substitutability in Columns 1–3 is separately proxied by the three measures of residual wage dispersion. Substitutability in Columns 4–8 is separately proxied by the five indexes of O*NET rankings. Standardized beta coefficients are reported. Bootstrap standard errors clustered by exporter–importer pair in parentheses (50 replications).
***Significant at the 1 percent level.
**Significant at the 5 percent level.
*Significant at the 10 percent level.
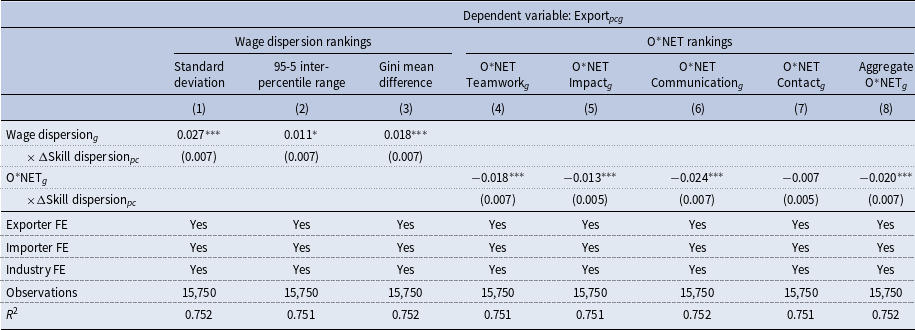
We also attempt to address the problem of zero trade by using the Poisson pseudo maximum likelihood (PPML) method proposed by Santos Silva and Tenreyro (Reference Santos Silva and Tenreyro2006). This alternative procedure estimates the gravity equation by including observations of zero bilateral trade in the regression. The results are reported in Table 7. The coefficient on the interaction of relative skill dispersion and skill substitutability still has the expected sign, and is statistically significant in almost all specifications. The effect size also remains quite similar to our baseline estimates. This again confirms the robustness of our results to confronting the high prevalence of zeroes.
Robustness checks I: correction for selection bias (PPML estimation)

Notes: The dependent variable is the export values from province
 $p$
to country
 $c$
in industry
 $g$
. The observations of zero trade are included in all specifications and we estimate the regressions by using the PPML method. The degree of skill dispersion is measured by the standard deviation of residual scores. Substitutability in Columns 1–3 is separately proxied by the three measures of residual wage dispersion. Substitutability in Columns 4–8 is separately proxied by the five indexes of O*NET rankings. Standardized beta coefficients are reported. Bootstrap standard errors clustered by exporter–importer pair in parentheses (50 replications).
***Significant at the 1 percent level.
**Significant at the 5 percent level.
*Significant at the 10 percent level.
Robustness checks II: augmented with human capital endowment (Years of schooling)

Notes: The dependent variable is the natural logarithm of exports from province
 $p$
to country
 $c$
in industry
 $g$
. The degree of skill dispersion is measured by the standard deviation of residual scores. Substitutability in Columns 1–3 is separately proxied by the three measures of residual wage dispersion. Substitutability in Columns 4–8 is separately proxied by the five indexes of O*NET rankings. Standardized beta coefficients are reported. Bootstrap standard errors clustered by exporter–importer pair in parentheses (50 replications).
***Significant at the 1 percent level.
**Significant at the 5 percent level.
*Significant at the 10 percent level.
5.2 Potential omitted factor endowments
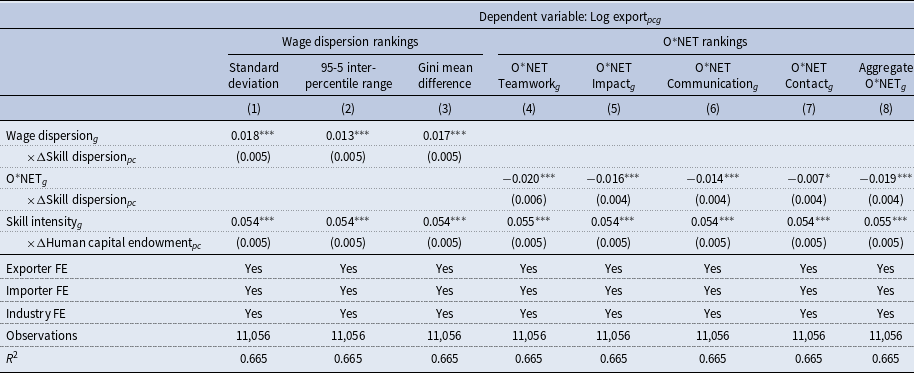
Another concern is that our variable of interest is not picking up the effect of relative skill dispersion per se, but other determinants of comparative advantage that also affect provincial trade flows and that are somehow not adequately captured by the fixed effects. In particular, regional factor endowments such as human capital, which is likely to be correlated with our skill variables, are essential in explaining patterns of trade. To address concerns regarding potential confounding factors, we construct a new variable by interacting the difference in human capital endowment between exporters and importers with sectoral skill intensity. We employs two measures for human capital endowment: average years of schooling of the workforce and the percentage of workers completing tertiary education.Footnote 20 As workers of higher skills on average receive higher wages, we use industry-level average wage as a proxy for skill intensity.
Table 8 presents the results of re-estimating specification (5) with the new control added. Human capital is captured by average years of schooling. We find that the interaction between relative levels of human capital endowment and sector-specific skill intensity has a significantly positive impact on provincial export volume. This finding aligns with the fundamental principles of the Heckscher-Ohlin theory, which suggests that countries with higher levels of human capital tend to specialize in industries that require more skilled workers. More importantly, the original interaction term retains sign and significance across all specifications, with a magnitude remarkably similar to the baseline estimates. We repeat the same exercise in Table 9 but with human capital proxied by the share of workers attaining tertiary education. Again, sign and significance are retained, and the value of the estimated coefficient of interest is little disturbed, implying that controlling for the potential omitted human capital endowment does not alter our conclusion.
Robustness checks II: augmented with human capital endowment (Percentage of tertiary schooling attained)

Notes: The dependent variable is the natural logarithm of exports from province
 $p$
to country
 $c$
in industry
 $g$
. The degree of skill dispersion is measured by the standard deviation of residual scores. Substitutability in Columns 1–3 is separately proxied by the three measures of residual wage dispersion. Substitutability in Columns 4–8 is separately proxied by the five indexes of O*NET rankings. Standardized beta coefficients are reported. Bootstrap standard errors clustered by exporter–importer pair in parentheses (50 replications).
***Significant at the 1 percent level.
**Significant at the 5 percent level.
*Significant at the 10 percent level.
Robustness checks III: accounting for internal migration patterns

Notes: The dependent variable is the natural logarithm of exports from province
 $p$
to country
 $c$
in industry
 $g$
. The degree of skill dispersion is measured by the standard deviation of residual scores. Substitutability in Columns 1–3 is separately proxied by the three measures of residual wage dispersion. Substitutability in Columns 4–8 is separately proxied by the five indexes of O*NET rankings. Standardized beta coefficients are reported. Bootstrap standard errors clustered by exporter–importer pair in parentheses (50 replications).
***Significant at the 1 percent level.
**Significant at the 5 percent level.
*Significant at the 10 percent level.
5.3 Accounting for interprovincial migration patterns
Although we control for migration status when estimating worker skills, concerns persist that our measures of skill dispersion may not accurately reflect the true skill distribution of the working population, in light of China’s substantial internal migration. The location where skill dispersion is measured using household data may differ from where workers actually employ their skills, particularly in provinces with high labor mobility. To mitigate this issue, we complement our main analysis with an alternative approach that explicitly incorporates interprovincial migration patterns when constructing skill dispersion indexes.
We model the post-migration skill distribution in each province as a mixture of pre-migration distributions from all provinces, weighted by migration patterns. Formally, for an economy with
 $N$
provinces, let
 $\mu _i$
and
 $\sigma _i^2$
denote the mean and variance of the pre-migration skill distribution in province
 $i \in {1, 2, \ldots, N}$
. The mean (
 $\mu$
) and variance (
 $\sigma ^{2}$
) of the post-migration mixture distribution in a given province are:
 \begin{equation*} \mu =\sum _{i=1}^{N}p_{i}\mu _{i}\;,\quad \sigma ^{2}=\sum _{i=1}^{N}p_{i}\sigma _{i}^{2}+\sum _{i=1}^{N}p_{i}\left (\mu _{i}-\mu \right )^{2} \end{equation*}
where
 $p_{i}$
represents the proportion of workers originating from province
 $i$
.
Given our focus on residual skills, we assume homogeneous means across distributions, i.e.,
 $\mu _{i}=\mu$
for all
 $i$
. The variance of the mixture distribution can be simplified to a weighted average of the original variances:
 $\sigma ^{2}=\sum _{i=1}^{N}p_{i}\sigma _{i}^{2}$
. To recover post-migration skill dispersion, we need to determine
 $p_i$
and
 $\sigma _i$
for each province. We can readily estimate
 $\sigma _i$
using the sample of local residents in each province, as the proportion of people who migrate out of any given province is typically low.Footnote
21
For
 $p_i$
, we exploit data on interprovincial migration flows from the 2010 China Population Census. Specifically, we calculate the proportion of migrant workers from each origin province relative to the total population in each destination province.
In Table 10, we report estimates of our main specification using the migration-adjusted measures of skill dispersion. Overall, the estimated coefficients on our key variable are virtually unchanged, suggesting that our results are robust to accounting for the effects of internal migration.
To further validate our primary conclusions, online Appendix Section A presents three additional robustness checks. The first addresses potential confounds from policy-driven initial conditions, particularly those arising from government-directed investments following Deng Xiaoping’s 1992 southern tour. The second examines the potential influence of industry life cycles and firm age structure on wage dispersion patterns. Both tests corroborate our main findings, providing strong evidence that our baseline estimates are not driven by pre-existing regional differences or sectoral dynamics. Finally, we consider the effect of alternative clustering of standard errors. Our results remain statistically significant when accounting for correlations within industries and when applying more conservative inference procedures.
6. Mechanism
Our primary findings in Table 2–Table 4 indicate that provinces with greater skill dispersion than their importing partners export relatively more in sectors with a high degree of skill substitutability. In this section, we investigate possible channels through which relative skill dispersion may boost bilateral trade flows.
6.1 Product quality
Extensive studies have identified product quality as an important determinant of bilateral trade patterns (Murphy and Shleifer, Reference Murphy and Shleifer1997; Melitz, Reference Melitz2003; Hallak, Reference Hallak2006; Verhoogen, Reference Verhoogen2008; Fajgelbaum et al. Reference Fajgelbaum, Grossman and Helpman2011; Crozet et al. Reference Crozet, Head and Mayer2012). They argue that quality differences across industries can partly explain the observed variations in export volume. Building on this idea, we hypothesize that the trade-promoting effect of relative skill dispersion may arise from a quality upgrading mechanism. Specifically, we start by examining whether a more dispersed skill distribution relative to importing partners improves the product quality in industries with high skill substitutability, which in turn leads to increased demand for these goods in the international market.
Testing the quality upgrading channel requires a measure of average export quality by country of destination at the industry level. For this we apply the standard approach in the existing literature and use export unit values as a proxy for quality (see, for example, Bastos and Silva, Reference Bastos and Silva2010; Harding and Javorcik, Reference Harding and Javorcik2012; Alcalá, Reference Alcalá2016; Che and Zhang, Reference Che and Zhang2018). For each exported good, we calculate the unit value by dividing the total value of exports by the quantity. The average product quality within an industry for each exporter–importer pair is then defined as the weighted average unit value of all exported goods, where the shares of export value of the goods in that industry are used as the weights.
Unit prices, however, may not be a perfect indicator for quality under certain circumstances. For example, in markets with monopolistic competition, more efficient producers can sell higher quality products at lower prices due to their lower marginal costs (Alcalá, Reference Alcalá2016). To deal with this concern, we follow the idea of Khandelwal (Reference Khandelwal2010) by inferring effective quality from both unit prices and market shares. The underlying intuition is that higher quality products should capture a larger market share conditional on prices and country characteristics. Precisely, we estimate quality of exports using the empirical demand equation as in Khandelwal et al. (Reference Khandelwal, Schott and Wei2013) and Fan et al. (Reference Fan, Li and Yeaple2018):
 \begin{align} \log \left (x_{fhc}\right )+\sigma \log \left (p_{fhc}\right )=\phi _{h}+\phi _{c}+\varepsilon _{fhc} \end{align}
where
 $x_{fhc}$
is the quantity of good
 $h$
exported to destination country
 $c$
by firm
 $f$
,
 $p_{fhc}$
is the price of the good,
 $\sigma$
is the elasticity of substitution across different goods, and
 $\phi _{h}$
and
 $\phi _{c}$
are a set of fixed effects that capture time-invariant product- and destination-specific characteristics, respectively. We use the estimated values of
 $\sigma$
provided by Broda and Weinstein (Reference Broda and Weinstein2006),Footnote
22
and aggregate them to the HS 2-digit level. The effective quality of each exported good can be approximated by the residuals from the regression equation (6). Similar to the construction of our first measure, we calculate the weighted average of the individual effective quality estimates across all goods within an industry for each exporter–importer pair.
Using the constructed measures, we estimate our main empirical specification (5) with export quality as the dependent variable. The results are summarized in Table 11. Columns 1 and 2 report the estimates where sectoral skill substitutability is measured by residual wage dispersion. In both regressions, we find that the interaction of relative skill dispersion and skill substitutability has a positive and significant effect on the quality of exports. The estimated coefficients exhibit strikingly similar magnitudes whether we assess product quality by unit values or by the effective quality of the exported products. Columns 3 and 4 repeat the exercise but use O*NET rankings as a proxy for complementarity. As expected, the interaction term is negative and remains statistically significant at the 1% level.
Testing the quality upgrading channel

Notes: The dependent variable is the average export quality within industry
 $g$
for exporter–importer pair
 $pc$
. We construct two different measures of product quality. The first one is export unit value, and the second one is the effective quality inferred from both market shares and unit prices following the empirical strategy as in Khandelwal (Reference Khandelwal2010) and Fan et al. (Reference Fan, Li and Yeaple2015, Reference Fan, Li and Yeaple2018). Both measures are weighted by the share of export value of the goods within an industry for each exporter–importer pair. The degree of skill dispersion is measured by the standard deviation of residual scores. We use the standard deviation of residual wages and the aggregate O*NET index as proxies for substitutability. Standardized beta coefficients are reported. Bootstrap standard errors clustered by exporter–importer pair in parentheses (50 replications).
***Significant at the 1 percent level.
**Significant at the 5 percent level.
*Significant at the 10 percent level.
Based on our evidence, regions with a more diverse labor force than their importing partners tend to export higher quality goods in industries featured by higher skill substitutability across tasks. This suggests that our results are consistent with the proposed mechanism, where relatively greater skill dispersion in exporters compared to importers improves average product quality and thus increases export volumes in sectors with high task substitutability.
6.2 Product diversity
In light of the existing evidence that product diversification is an important aspect of comparative advantage (Hummels and Klenow, Reference Hummels and Klenow2005; Broda and Weinstein, Reference Broda and Weinstein2006, Reference Broda and Weinstein2010; Gopinath and Neiman, Reference Gopinath and Neiman2014; Melitz and Redding, Reference Melitz and Redding2014; Halpern et al. Reference Halpern, Koren and Szeidl2015; Blaum et al. Reference Blaum, Lelarge and Peters2018; Baqaee et al. Reference Baqaee, Burstein, Duprez and Farhi2023), it is possible that provinces with relatively higher skill dispersion are likely to have a more diverse product structure in sectors with higher skill substitutability. The product diversification mechanism may contribute to an increase in exports through the extensive margin, where incumbent exporters expand their product lines and new firms enter the export market. To test the validity of this explanation, we examine whether relative skill dispersion affects export diversity in a similar manner as it does with export volume.
In order to assess the diversity of export structure, we first look at the variety of exports within an industry for each exporter–importer pair. We define export varieties as the number of exported product categories at the HS 6-digit level. To further quantify the degree of diversification, we rely on the Herfindahl–Hirschman Index (HHI), which is a commonly used measure for evaluating industry concentration in the empirical trade literature. Specifically, we compute the HHI for industry
 $g$
within each exporter–importer pair
 $pc$
as
 \begin{equation*} HHI_{pcg}=\sum _{h\in \mathcal {H}}\left (\left .Export_{pcgh}\middle /Export_{pcg}\right .\right )^{2} \end{equation*}
where
 $Export_{pcgh}$
is the value of exports of an HS 6-digit product category
 $h$
. We then construct the following measure of diversification within industry
 $g$
for a given exporter–importer pair
 $pc$
:
 \begin{equation*} Product\;diversity_{pcg}=1-HHI_{pcg} \end{equation*}
This index ranges from 0 to 1 and is increasing in an industry’s extent of product diversification within each exporter-importer pair.
Similar to the analysis on the quality upgrading channel, we estimate specification (5) but using export diversity as the outcome variable. The results are presented in Table 12, which replicates the structure of Table 11. In all regressions, the interaction of relative skill dispersion and skill substitutability has the expected sign and remains statistically significant at the 1% level. As shown in Columns 1 and 3, provinces whose skill dispersion is higher than their importing countries appear to export a wider range of goods in industries with substitutable tasks. Columns 2 and 4 suggest that the increase in export volume is not concentrated in several specific products. A more dispersed skill distribution as opposed to trading partners is associated with a more diversified structure of exported products in higher substitutability sectors.
Testing the product diversity channel

Notes: The dependent variable is the diversity of exports within industry
 $g$
for each exporter–importer pair
 $pc$
. We construct two different measures of export diversity. The first one is the variety of exported products, and the second one is 1 minus the Herfindahl–Hirschman Index within an industry for each exporter-importer pair. The degree of skill dispersion is measured by the standard deviation of residual scores. We use the standard deviation of residual wages and the aggregate O*NET index as proxies for substitutability. Standardized beta coefficients are reported. Bootstrap standard errors clustered by exporter–importer pair in parentheses (50 replications).
***Significant at the 1 percent level.
**Significant at the 5 percent level.
*Significant at the 10 percent level.
In short, we interpret our results as supportive evidence for the product diversity channel. Our findings reveal that the interaction of relative skill dispersion and skill substitutability can positively affect industrial exports by increasing the range of products that can be developed and offered to international markets.
7. Conclusion
Cross-country variations in aggregate factor endowments have been documented as important sources of comparative advantage. However, insufficient attention has been paid to how the distribution of a factor shapes the pattern of international trade. In this paper, we shed light on the role of relative skill dispersion in explaining the observed export flows. To discipline our empirical analysis, we develop a tractable multi-sector Ricardian trade model with worker heterogeneity in productivity across industries and countries. Consistent with the model predictions, we use Chinese provincial exports data to show that what really matters to regional industry specialization is not the absolute skill dispersion of exporters, but the difference in skill dispersion between exporters and importers. Specifically, we find that provinces with a more diverse working population relative to their importing partners tend to specialize in sectors with higher skill substitutability. We also detect a substantially stronger impact of relative skill dispersion among less developed provinces, suggesting that strengthening the interaction of relative skill dispersion and skill substitutability can help narrow the gap in regional exports.
Our findings complement Bombardini et al. (Reference Bombardini, Gallipoli and Pupato2012) by highlighting the importance of relative skill dispersion between exporters and importers. By focusing on regional exports within a country, we can also more accurately assess the impact of relative skill distribution, separate from any country-specific institutional factors that may also affect the composition of trade. Additionally, we go beyond the trade-promoting effects of relative skill dispersion by exploring the underlying mechanisms. We find supportive evidence for both quality upgrading and product diversity channels. Our analysis indicates that aligning regional skill dispersion with sectoral skill substitutability offers a feasible path for developing countries to upgrade their export basket, which has a profound impact on long-term economic performance.
There are several relevant directions for future study. First, while the structure of exports is a natural starting point, it is important to broaden our focus and examine other consequences arising from the match between relative skill dispersion and industrial skill substitutability. For example, a promising avenue for future research would be to compare firm behavior across regions in industries with different levels of substitutability, such as firm entry or exit, employment structure, and innovation. Second, while we have uncovered a significant effect of relative skill dispersion on trade, it would be interesting to quantify the welfare impacts according to our theoretical framework. Finally, future work could investigate how the distribution of other factor endowments, such as female labor and physical capital, affects specialization patterns. Addressing these questions would contribute to a more comprehensive understanding of the determinants of comparative advantage.
Acknowledgements
We would like to thank the editor, associate editor, and two anonymous referees for their valuable comments and constructive suggestions. We also acknowledge the financial support from the National Natural Science Foundation of China (Grant Nos. 72103120, 72473054, 72474126), Shanghai Pujiang Program (Grant No. 21PJC052), and Guangdong Basic and Applied Basic Research Foundation (Grant Nos. 2020A1515011481, 2021A1515011659).
Supplementary material
To view supplementary material for this article, please visit https://doi.org/10.1017/S1365100524000816