







1 Introduction
1.1 Internal waves emitted by localized stratified turbulence
Submerged localized stably stratified turbulent flows in the ocean emit internal waves (IWs) which carry momentum, energy and information away from the source for long distances. A canonical flow for the study of IW-emitting localized turbulence is the stratified wake of a towed sphere, which itself is a flow of geophysical and naval applications (Lin & Pao Reference Lin and Pao1979; Spedding Reference Spedding2014). (For a review on IW radiation by other canonical stratified turbulent flows, see Abdilghanie (Reference Abdilghanie2010).) A stratified towed-sphere wake is characterized by its Reynolds number
 $Re\equiv UD/{\it\nu}$
and Froude number
 $Fr\equiv 2U/(ND)$
, where
 $U$
,
 $D$
,
 ${\it\nu}$
and
 $N$
are the tow speed, sphere diameter, viscosity and buoyancy frequency, respectively. Pioneering and recent experimental studies (Gilreath & Brandt Reference Gilreath and Brandt1985; Hopfinger et al.
Reference Hopfinger, Flor, Chomaz and Bonneton1991; Bonneton, Chomaz & Hopfinger Reference Bonneton, Chomaz and Hopfinger1993; Lin, Boyer & Fernando Reference Lin, Boyer and Fernando1993; Robey Reference Robey1997; Meunier Reference Meunier2012; Brandt & Rottier Reference Brandt and Rottier2015) revealed at least two types of IWs generated by stratified wakes: the lee waves behind the sphere (or cylinder) which dominates at
 $Fr<4$
, and the quasirandom waves emitted by the turbulence in the wake which dominates at
 $Fr\geqslant 4$
, the latter wave type being the focus of the present study. Källén (Reference Källén1987) formulated the linear theory for wave generation by the spatially varying mean-flow structure of the wake. Spedding et al. (Reference Spedding, Browand, Bell and Chen2000) towed spheres at
 $Re$
up to
 $1.2\times 10^{4}$
and
 $Fr\in \{4,64\}$
and reported carefully sampled IW properties. They also made the first attempt to correlate the observed wave characteristics with the wake’s governing parameter – for example, a
 $Fr^{1/3}$
-scaling for the observed wavelengths was reported.
Abdilghanie & Diamessis (Reference Abdilghanie and Diamessis2013) performed numerical simulations at
 $Re\in \{5\times 10^{3},10^{5}\}$
and
 $Fr\in \{4,16,64\}$
(the case
 $(Re,Fr)=(10^{5},64)$
was missing due to limited computing resources). These simulations provided insights on wake-emitted waves at higher
 $Re$
than previously achieved in the laboratory (Spedding et al.
Reference Spedding, Browand, Bell and Chen2000). At the higher
 $Re$
examined, they reported that the wave emission is prolonged and persists up to
 $Nt\approx 100$
(as compared to
 $Nt\approx 50$
at the lower
 $Re$
), which was attributed to the prolongation of the wave-emitting non-equilibrium (NEQ) (Spedding Reference Spedding1997) regime of the wake. In the NEQ regime, the turbulence is mainly driven by the secondary Kelvin–Helmholtz instabilities (Riley & de Bruyn Kops Reference Riley and de Bruyn Kops2003; Diamessis, Spedding & Domaradzki Reference Diamessis, Spedding and Domaradzki2011). The wave emission was found to be less affected by viscosity as
 $Re$
increases, as evidenced by a noticeable shift in the dominant wave frequency from the one which minimizes viscous decay of wave amplitude (at lower
 $Re$
; Taylor & Sarkar Reference Taylor and Sarkar2007) to the one which maximizes momentum extraction from the wake (at higher
 $Re$
). At the higher
 $Re$
, there is also a significant increase in the momentum flux carried away by the waves (Sutherland & Linden Reference Sutherland and Linden1998). Wavelengths of the wake-emitted IWs were reported via time series of conditionally averaged values based on IW signatures on a horizontal plane, while no additional information was given on the wave energy distribution over the entire wavenumber spectrum.
Continuous wavelet transforms (Dallard & Spedding Reference Dallard and Spedding1993; Spedding et al.
Reference Spedding, Browand, Huang and Long1993; Abdilghanie Reference Abdilghanie2010) were employed to interrogate the waves’ length scales and periods, on account of the localized and intermittent nature of the turbulence-emitted random waves. Motivated by the
 $Fr$
-scaling of the horizontal eddy dimensions (Spedding, Browand & Fincham Reference Spedding, Browand and Fincham1996) and in agreement with Spedding et al. (Reference Spedding, Browand, Bell and Chen2000), Abdilghanie & Diamessis (Reference Abdilghanie and Diamessis2013) found that an empirical
 $Fr^{1/3}$
-scaling was able to collapse the time series of wavelengths sampled at different vertical offsets not far (up to
 $3.4D$
away) from the wake centreline. The wavelengths were observed to decay with time following a power law
 $(Nt)^{-C}$
, where
 $C$
is generally smaller than unity and varies with
 $Fr$
and
 $Re$
in the near field of the wake. The dimensionless time
 $Nt$
can be converted to the dimensionless downstream distance from the sphere
 $$\begin{eqnarray}\frac{X}{D}=\frac{Fr}{2}Nt.\end{eqnarray}$$
The very fact that the wave characteristics vary with
 $Nt$
(or
 $X/D$
) implies the possibility of inferring the stage of evolution (or ‘age’) of the wave-emitting submerged localized stratified turbulence, or the distance
 $X$
from the origin of the flow, based on far-field measurements of the turbulence-emitted IWs. Such an inference would require a detailed knowledge of wave characteristics within the parameter space
 $(Re,Fr,Nt)$
, not only in the near field of the wake, but also in the far field, where the present study focuses on. One also needs to take into account the various physical processes which the waves may have been subject to along their propagation path before their characteristics are revealed to an observer. These processes include the dispersion of these waves and their interactions with background stratification and/or currents (Thorpe Reference Thorpe1975, Reference Thorpe2005; Sutherland Reference Sutherland2010). In the present study, we consider the simple case with uniform stratification and no background flows other than that of the model wake.
1.2 Manifestation of submerged stratified flows at sea surface
Spedding (Reference Spedding2014) offered a comprehensive review on the wide range of wake sources, geophysical and biological, and to which observers the wake signatures are important. One way for these wakes to generate signatures at the sea surface is through molecular diffusion (Voropayev et al.
Reference Voropayev, Fernando, Smirnov and Morrison2007; Voropayev, Fernando & Nath Reference Voropayev, Fernando and Nath2009) or through complex coupling between vortical structures and stratification (Fung & Chang Reference Fung and Chang1996). However, in the absence of any background turbulence that may enhance the vertical transport of momentum, the diffusion of the vortical structures operates at a time scale of
 $O(z_{sfc}^{2}/{\it\nu})$
which could be rather slow (
 $z_{sfc}$
is the distance from the source to the surface). In the present study, the possibility of a submerged stratified turbulent flow establishing a distinct surface signature through the radiation of IWs is investigated for the first time.
Internal waves could impact the sea surface by altering the approximately two-dimensional velocity field on the surface plane, for example, see Alpers (Reference Alpers1985). The convergent/divergent patterns on the surface driven by underlying IWs may manifest themselves through multiple surface modulation mechanisms (Klemas Reference Klemas2012), such as (1) hydrodynamic modulation through IW strains acting on surface wind-generated capillary–gravity waves (Alpers Reference Alpers1985; Hwung, Yang & Shugan Reference Hwung, Yang and Shugan2009), (2) surface film modulation by forming ‘slicks’ of oceanic surfactants consisting of organic-rich materials (Ewing Reference Ewing1950a ; Ermakov, Salashin & Panchenko Reference Ermakov, Salashin and Panchenko1992) under low-wind conditions, and (3) thermal modulation through thickness changes of the ‘cool-skin’ temperature sublayer (Osborne Reference Osborne1964, Reference Osborne1965; Zappa & Jessup Reference Zappa and Jessup2005). Key to these processes is the horizontal divergence
 $$\begin{eqnarray}{\it\Delta}_{z}\equiv \frac{\partial u}{\partial x}+\frac{\partial v}{\partial y}\end{eqnarray}$$
of sea-surface flows, which is also the hydrodynamical quantity ideal for visualization and analysis of wake-emitted IWs used by various authors (Spedding et al. Reference Spedding, Browand, Bell and Chen2000; Abdilghanie & Diamessis Reference Abdilghanie and Diamessis2013; Spedding Reference Spedding2014) and in the present study. A review on observed surface signatures of IW beams/packets of tidal origin or radiated by deeply submerged turbulent sources can be found in Zhou (Reference Zhou2015).
1.3 Nonlinear effects in internal waves
The far-field evolution of upward-propagating IWs generated in midwater or from topography may be convoluted by complex physical processes through variable stratifications (Akylas et al. Reference Akylas, Grimshaw, Clarke and Tabaei2007; Mathur & Peacock Reference Mathur and Peacock2009; Grisouard, Staquet & Gerkema Reference Grisouard, Staquet and Gerkema2011; Mercier et al. Reference Mercier, Mathur, Gostiaux, Gerkema, Magalhaes, da Silva and Dauxois2012; Diamessis et al. Reference Diamessis, Wunsch, Delwiche and Richter2014; Wunsch et al. Reference Wunsch, Ku, Delwiche and Awadallah2014), critical layers (Thorpe Reference Thorpe1975; Winters & D’Asaro Reference Winters and D’Asaro1989), instabilities and breaking in midwater (Thorpe Reference Thorpe2005), and the ocean near-surface layer subject to external forcings (Soloviev & Lukas Reference Soloviev and Lukas2006). Apart from these complications imposed by the background oceanic environment, which are expected to be highly site specific, the nonlinearity within the IWs may also become important as the IWs reflect off the ocean surface. While a single two-dimensional finite-amplitude IW beam within the breaking limits does not induce significant nonlinear effects (Tabaei & Akylas Reference Tabaei and Akylas2003), the IW beam does transfer energy to mean flows and higher harmonics through nonlinear wave–wave interactions upon reflection at the sea surface (Lamb Reference Lamb2004; Tabaei, Akylas & Lamb Reference Tabaei, Akylas and Lamb2005; Zhou & Diamessis Reference Zhou and Diamessis2013, Reference Zhou and Diamessis2015), even when a uniform stratification is present.
1.4 Objectives and basic questions
The present state of understanding on the IWs emitted by stratified turbulent sources, specifically those produced in the wake of a towed sphere, is much limited to the wave characteristics near the generation site, i.e. in the near field of the turbulent wave source (Bonneton et al.
Reference Bonneton, Chomaz and Hopfinger1993; Spedding et al.
Reference Spedding, Browand, Bell and Chen2000; Abdilghanie & Diamessis Reference Abdilghanie and Diamessis2013), where the dynamics is expected to be highly nonlinear. The primary objective of this paper is to provide a quantitative description of the far-field evolution of the IWs emitted by a submerged localized stratified turbulent source that complements the recent near-field characterization reported by Abdilghanie & Diamessis (Reference Abdilghanie and Diamessis2013) (hereinafter referred to as A&D). The emphasis is on characterizing the sea-surface manifestation of these waves. This study is to replicate the parameter range in terms of the wave-emitting wake’s Reynolds number
 $Re$
and Froude number
 $Fr$
covered by A&D, as well as to extend it to the more computationally expensive case
 $(Re,Fr)=(10^{5},64)$
. The computational domains are made larger than those used in A&D, in order to capture the wave characteristics in the wake’s far field.
Simulations of turbulent wakes and wake-generated IWs are performed within a linear stratification bounded from above by a model free-slip sea surface. Through the complete characterization of the surface signatures of the IWs in the far field, we aim to explore the following three themes, each with its own set of driving questions:
-
(i) Wave nonlinearity. Given that the near-field turbulence-IW wave–wave interactions are nonlinear, does the nonlinearity associated with the IWs persist in their far-field propagation? Could the nonlinear effects during surface reflection of these IWs, i.e. due to the interaction of incident and reflecting waves, introduce additional complexity to the wave field and its straining of the surface?
-
(ii) Surface-wake turbulence correlation. From the remote observation viewpoint, how may one correlate the properties of the observed surface strain field, such as the horizontal wavelength
 ${\it\lambda}_{H}$
of the IW impacting the surface, to the dynamical state of the submerged turbulent wake at a particular
$Nt$
? Does this
${\it\lambda}_{H}$
-to-
$Nt$
relation vary with the wake parameters
$(Re,Fr)$
?
-
(iii) Wave generation by turbulence. Key questions regarding the IW-generation process are: at which stage of the stratified turbulence life cycle (Spedding Reference Spedding1997) are the IWs generated? And how long does the IW emission persist? A&D proposed that IWs are generated continuously during the entire NEQ regime of the wake. However, as will be shown in the rest of the paper, the alternative scenario that the IW emission occurs predominantly in the early wake and lasts for a short period of time seems to be better supported by the far-field characterization of the wake-emitted IWs conducted in this paper.


The remainder of the paper proceeds as follows: In § 2, the numerical model and problem set-up will be introduced. In § 3, the basic flow phenomenology will be described. In § 4, far-field wave statistics, including amplitude, wavelength, period and orientation, which are sampled at the sea surface, will be reported, and a linear dispersive propagation model, for the wavelength evolution in time at the surface, will be developed. In § 5, two potential signature-generating mechanisms will be discussed, one relying on modulation of the surface scalar field and the other concerning collective motions of Lagrangian tracers. Further discussion on the results and conclusions are presented in § 6 and § 7, respectively.
2 Model formulation and numerical simulations
2.1 Numerical methods
The data sets of stratified turbulent wakes and the far-field evolution of the wake-emitted IWs are generated numerically by a highly scalable parallel spectral multidomain penalty incompressible Navier–Stokes solver developed by Diamessis, Domaradzki & Hesthaven (Reference Diamessis, Domaradzki and Hesthaven2005). This flow solver has been used to investigate stratified wakes by Diamessis et al. (Reference Diamessis, Spedding and Domaradzki2011) (hereinafter referred to as DSD) and the wake-emitted IWs in the near field by A&D through implicit large-eddy simulations. Critical to the suitability of this solver in the present study is its spatial discretization: Fourier in the horizontal and Legendre multidomain penalty-based subdomains in the vertical, which allows one to attain high resolution in particular vertically localized flow regions of interest. Such vertical discretization also enables flexibility in choosing boundary conditions in the top and bottom boundaries. Spectral filtering and a penalty scheme provide the numerical stability needed for simulating the larger scales of high-
 $Re$
flow without having to resolve the full spectrum of turbulent motions.
Computational domain for implicit large-eddy simulation of a temporally evolving, stratified towed-sphere wake (Diamessis et al.
Reference Diamessis, Domaradzki and Hesthaven2005, Reference Diamessis, Spedding and Domaradzki2011; Abdilghanie & Diamessis Reference Abdilghanie and Diamessis2013). The wake centreline is at
 $(y,z)=(0,0)$
. The sphere is towed in the direction of positive
 $x$
, which is the only statistically homogeneous direction in the computational set-up.
 $x=0$
is set to the midpoint of the domain in the homogeneous streamwise direction. The effect of the towed sphere is not computed explicitly but rather introduced as a complex two-stage turbulent wake initialization procedure (Diamessis et al.
Reference Diamessis, Spedding and Domaradzki2011). The wave sponge layer (Abdilghanie Reference Abdilghanie2010) operates on the bottom and lateral boundaries, and the top boundary is a free-slip rigid lid.

2.2 Problem geometry
The flow configuration (see figure 1) and the implementation of numerical methods are almost identical to those of DSD, to which readers interested in the details are referred. Here the necessary modifications applied to the DSD set-up for the purpose of pursuing the objectives of the present study are summarized:
Summary of numerical simulations at various wake Reynolds and Froude numbers.
 $N_{x}\times N_{y}\times N_{z}$
is the number of grid points;
 $N_{p}$
is the number of MPI processors used.

-
(i) Domain dimensions. The computational domain of dimensions
$L_{x}\times L_{y}\times L_{z}$
is made taller and wider (see dimensions in table 1) than in DSD. This is to provide more space in the wake ambient fluid for the radiated IWs to evolve and reflect off the top boundary, i.e. the model sea surface, over a sufficiently wide spanwise extent. The wake centreline, corresponding to
$(y,z)=(0,0)$
, is always located at a distance of
$9D$
below the top boundary. As a result, the model sea surface is at a fixed vertical distance above the wake centreline in all simulations. The fixed distance
$9D$
is chosen such that it provides the IWs enough space to evolve in the far field before being reflected. Such a domain depth is also feasible to simulate with available computing resources. -
(ii) Wave sponge layers. A&D set up sponge layers (Abdilghanie Reference Abdilghanie2010) to wrap up completely the top/bottom (
$xy$
) and lateral (
$xz$
) boundaries to prevent the IWs from re-entering the domain by reflecting or through the periodic boundaries. In the present study, however, the sponge layer on the top boundary is removed to allow the IWs to reflect from the model sea surface (see figure 2). -
(iii) Boundary conditions. Similar to DSD, periodic boundary conditions are employed in the horizontal directions. The top surface is free-slip to model the sea surface under low wind, and has zero vertical gradient of density perturbation. The model sea surface is flat and non-deformable in the vertical, following scaling arguments (Moum & Smyth Reference Moum and Smyth2006; Zhou & Diamessis Reference Zhou and Diamessis2013) which predict that the surface deflections due to IWs are much smaller than the horizontal length scales of the waves, and hence the surface slope is negligible.
-
(iv) Vertical resolution. Utilizing the spatial adaptivity of the spatial discretization in the vertical, the subdomain deployment focuses on both the turbulent wake core and the IW-reflecting subsurface zone in order for them to be resolved adequately.


Horizontal divergence
 ${\it\Delta}_{z}$
(normalized by buoyancy frequency
 $N$
) fields sampled at the O
 $yz$
centreplane at various times (marked on top of the colour maps) at
 $Re=5\times 10^{3}$
and
 $Fr=4$
(R5F4). The interface between the fluid and wave-absorbing virtual sponge layer is marked by white dashed lines.

2.3 Initial condition
The initial condition of the simulations is a reasonable approximation of the near wake of a towed sphere in a stratified water tank. The reader may find the full details of the set-up in DSD. Here we provide a brief discussion of the most important aspects of the design and implementation of the initial condition. Once initialized, the flow field starts to evolve in time under the assumption that the turbulence is statistically homogeneous in the streamwise direction. Such an approach to simulate a temporally evolving shear flow, introduced in the pioneering work of Orszag & Pao (Reference Orszag and Pao1975), is commonly used in the stratified sphere-wake literature (Gourlay et al.
Reference Gourlay, Arendt, Fritts and Werne2001; Dommermuth et al.
Reference Dommermuth, Rottman, Innis and Novikov2002; Brucker & Sarkar Reference Brucker and Sarkar2010; Diamessis et al.
Reference Diamessis, Spedding and Domaradzki2011; Redford, Lund & Coleman Reference Redford, Lund and Coleman2015) to avoid explicitly accounting for the sphere in the calculation. Alternatively, computing the flow explicitly around a sphere (Pasquetti Reference Pasquetti2011; Dairay, Obligado & Vassilicos Reference Dairay, Obligado and Vassilicos2015; Orr, Spedding & Constantinescu Reference Orr, Domaradzki, Spedding and Constantinescu2015) and simulating a spatially evolving wake (Pal, de Stadler & Sarkar Reference Pal, de Stadler and Sarkar2013) have also been implemented recently. However, the computational cost of such approaches is prohibitive for the present study, particularly at the higher
 $Re$
considered here.
Given the temporally evolving wake set-up, it is possible to map the time
 $t$
associated with an instantaneous flow field in the simulation to the corresponding downstream distance
 $X$
from the sphere to the computational domain (the reader should not confuse
 $X$
with the local coordinate
 $x$
of the computational domain, see the caption of figure 1). Specifically, in analogy with the field of view of the corresponding laboratory experiments (e.g. Spedding et al.
Reference Spedding, Browand and Fincham1996), at time
 $t$
in the simulation, the right end of the computational domain is assumed to be at a distance
 $X=Ut$
from the centre of the sphere, which is assumed to already have travelled, from left to right, through the domain in the positive streamwise direction (Orszag & Pao Reference Orszag and Pao1975).
In setting up the initial flow field for our simulations, the mean and r.m.s. velocity profiles are prescribed by the model by Meunier, Diamessis & Spedding (Reference Meunier, Diamessis and Spedding2006) at a downstream distance
 $X/D=2$
where a self-similar flow is assumed. By virtue of (1.1) and the choice of
 $X/D=2$
as the initial condition, the initial dimensionless time
 $(Nt)_{0}$
is
 $1$
,
 $0.25$
and
 $0.0625$
for the simulations at
 $Fr=4$
,
 $16$
and
 $64$
, respectively. These initial
 $Nt$
values are smaller than
 $Nt\approx 2$
, which is the typical transition point in time from the three-dimensional (3-D) regime to the NEQ regime (Spedding Reference Spedding1997). It is after this transition that buoyancy effects begin to impact the wake significantly and the turbulence-driven IW radiation takes place. Therefore, the simulated turbulence-emitted IW field is expected be a faithful representation of its experimental counterpart, although the numerical model does not explicitly compute the wake at
 $Nt<(Nt)_{0}$
(or
 $X/D<2$
) and a self-similar wake is assumed from the onset of the simulation.
2.4 Summary of numerical simulations
The six simulations performed for the present study have the same wake parameter space investigated in DSD, i.e.
 $Re\in \{5\times 10^{3},10^{5}\}$
and
 $Fr\in \{4,16,64\}$
. A summary of these simulations is in table 1. Hereinafter, each simulation will be labelled as R
 $a$
F
 $b$
, where
 $a=Re/10^{3}$
and
 $b=Fr$
. The computational cost increases dramatically with both
 $Re$
and
 $Fr$
. A regridding strategy similar to that of DSD is applied to R100F64 in the lateral direction
 $y$
whenever the half-width of the wake
 $L_{H}$
exceeds 10 % of the width of the domain.
3 Basic phenomenology
The basic physical process involving turbulence-emitted IWs and their surface reflection is described in this section, aided by flow snapshots extracted from the simulations shown in figures 2 and 3. Figure 2 shows typical span-vertical (
 $yz$
) transects of the flow field sampled at the centreplane of the computational domain at
 $x=0$
. The horizontal divergence
 ${\it\Delta}_{z}$
field is used to visualize the IW motions (Abdilghanie & Diamessis Reference Abdilghanie and Diamessis2013; Spedding Reference Spedding2014) in the ambient of the turbulent wake core, which is centred at
 $(y,z)=(0,0)$
. Three snapshots are shown in figure 2 to illustrate the process of IW radiation from the wake core and wave propagation in the far field. At early times, e.g. at
 $Nt=10$
, and in the ambient of the wake core, one can observe an internal phase configuration that is comparable to the classical St Andrews cross pattern observed around an oscillatory wave source (Mowbray & Rarity Reference Mowbray and Rarity1967) and waves from transient sources (Stevenson Reference Stevenson1973; Lighthill Reference Lighthill1978). As expected, when the waves propagate further into the far field, the isophase lines increase in extent in the directions of the outwardly oriented group velocities, as can be seen in the snapshot at
 $Nt=40$
. As the waves propagate even further (shown in the snapshot at
 $Nt=70$
), they visibly reach the model sea surface at
 $z=9D$
and reflect off the surface.
Horizontal divergence
 ${\it\Delta}_{z}$
(normalized by buoyancy frequency
 $N$
) field at the model sea surface at (a) R5F4 and (b) R100F4, respectively. Time, in
 $Nt$
units, is marked on top of the colour maps.

Of interest to a remote observer are the waves’ spatial and temporal characteristics on the sea surface. Figure 3 shows the spatial patterns which these turbulence-emitted IWs form as they reflect at the model sea surface, i.e. the topmost
 $xy$
plane of the computational domain. Snapshots of the
 ${\it\Delta}_{z}$
field are shown at both
 $Re$
values at
 $Fr=4$
. First, these waves spread broadly in the span of the flow (i.e. in
 $y$
) on the sea surface and exhibit coherent spatial patterns. These spatial patterns are also persistent in time, i.e. they last for
 $O(10)$
–
 $O(100)$
units of buoyancy time scale
 $1/N$
. Second, the length scale of the waves varies strongly in time, i.e. the waves are observed to be of smaller wavelengths at later values of
 $Nt$
, which holds at both
 $Re$
values. Third, distinct directionality associated with the wave patterns can be observed on the horizontal plane, i.e. the direction of the isophase lines with respect to the
 $x$
-axis varies with the spanwise offset in
 $y$
. These key features of the surface-observed IW signatures will be characterized in greater detail in § 4. Specifically, the time evolution of surface-observed wave strain amplitude is discussed in § 4.1. The length scales of the waves will be measured and parameterized with wake parameters
 $(Re,Fr)$
and dimensionless time
 $Nt$
in § 4.2, and the wave periods are reported in § 4.3. The directionality of the wave signatures on the sea surface, i.e. the azimuthal angle formed by these wave patterns with the streamwise direction
 $x$
, is discussed in § 4.4.
4 Wave characteristics at the sea surface
4.1 Arrival time of peak wave impact
Since the passage of the wake-generating body, there exists a dimensionless time,
 $N\hat{t}$
, at which the most energetic waves arrive at the surface. We are to determine this critical
 $N\hat{t}$
, and then determine how this arrival time of peak wave impact changes over the wake parameter space
 $(Re,Fr)$
. To this end, a model is developed based on linear IW theory and verified by numerical simulations.
One can apply linear IW theory (Sutherland Reference Sutherland2010) to estimate the time for an IW to propagate from
 $z_{0}$
to
 $z$
. This time lag can be written as:
 $$\begin{eqnarray}t-t_{0}=\frac{z-z_{0}}{c_{g,z}}=\frac{z-z_{0}}{{\displaystyle \frac{N}{2{\rm\pi}/{\it\lambda}_{H}}}\sin {\it\theta}\cos ^{2}{\it\theta}},\end{eqnarray}$$
where
 $(z_{0},t_{0})$
can be considered as the vertical location and time from and at which the waves are emitted, i.e. the virtual origin of the waves, and
 $c_{g,z}$
is the vertical component of the wave group velocity. Additionally,
 ${\it\lambda}_{H}$
is the horizontal wavelength, and
 ${\it\theta}$
is the angle between the wave’s group velocity and the vertical direction.
The critical time
 $\hat{t}$
at which the surface undergoes the peak wave impact can be considered as the time at which waves of wavelength
 $\hat{{\it\lambda}}_{H}$
, the most energetic wavelength, arrive at the surface. Noting that the surface is located at
 $z=9D$
in all simulations, and assuming that in the far field of the wake,
 $\hat{t}\gg t_{0}$
, i.e. the waves are emitted at a considerably early
 $t_{0}$
and it takes a considerable amount of time for a wave to propagate in space to reach the observation plane, one can apply (4.1) for waves of wavelength
 $\hat{{\it\lambda}}_{H}$
arriving at the surface at
 $\hat{t}$
and obtain
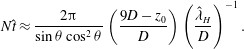 $$\begin{eqnarray}N\hat{t}\approx \frac{2{\rm\pi}}{\sin {\it\theta}\cos ^{2}{\it\theta}}\left(\frac{9D-z_{0}}{D}\right)\left(\frac{\hat{{\it\lambda}}_{H}}{D}\right)^{-1}.\end{eqnarray}$$
It is found in § 4.2.5 that
 $$\begin{eqnarray}\hat{{\it\lambda}}_{H}/D\propto Fr^{1/3},\end{eqnarray}$$
i.e. the most energetic wavelength scales as
 $Fr^{1/3}$
, and in § 4.2.3 that the virtual origin
 $z_{0}$
can be considered as a constant across all simulations. Moreover, the dependence of
 ${\it\theta}$
in
 $Fr$
is found to be rather weak (see § 4.3 for more details). As a result, one can deduce from (4.2) that
 $$\begin{eqnarray}N\hat{t}\propto Fr^{-1/3},\end{eqnarray}$$
which predicts that the peak arrival time in
 $Nt$
scales as
 $Fr^{-1/3}$
.
Time series of surface r.m.s. horizontal divergence
 ${\it\Delta}_{z,rms}$
normalized by the buoyancy frequency
 $N$
: (a,b) at
 $Re=5\times 10^{3}$
and (c,d) at
 $Re=10^{5}$
. The peak wave amplitude occurs at a narrow range of
 $Fr^{1/3}Nt$
for each
 $Re$
, as marked by the shaded area in (b,d).

To verify (4.4), time series of the spatial r.m.s. values (sampled over the surface
 $xy$
plane) of horizontal divergence
 ${\it\Delta}_{z}$
(a quantity denoted by
 ${\it\Delta}_{z,rms}$
as a measure of wave-induced strain) are computed for all simulations. The
 ${\it\Delta}_{z,rms}$
amplitude is normalized by
 $N$
, which forms a dimensionless measure of the waves’ steepness (A&D) and bears implications for the visibility of these waves (see § 5.2). The results are shown in figure 4, depicting the time evolution of the surface-observed wave strain amplitude. A delay of peak arrival time in
 $Nt$
with decreasing
 $Fr$
can be observed at both values of
 $Re$
. When the horizontal axis
 $Nt$
is rescaled by a factor of
 $Fr^{1/3}$
, the peak arrival times collapse into a considerably narrow range of
 $Fr^{1/3}Nt$
values, i.e.
 $[120,130]$
at
 $Re=5\times 10^{3}$
and
 $[230,330]$
at
 $Re=10^{5}$
, as highlighted by the shaded areas in figure 4(b,d). This collapse implies that the arrival time of peak wave impact at the surface in terms of
 $Nt$
scales approximately as
 $Fr^{-1/3}$
at a given
 $Re$
. This result is consistent with (4.4), a prediction due to linear wave theory.
One may alternatively consider the downstream distance from the towed sphere
 $\hat{X}/D$
at which the strongest waves arrive at the surface. Noting that the conversion from
 $Nt$
to
 $X/D$
involves a linear factor of
 $Fr/2$
as in (1.1), one can obtain from (4.4) that
 $$\begin{eqnarray}\frac{\hat{X}}{D}=\frac{Fr}{2}N\hat{t}\propto Fr^{2/3},\end{eqnarray}$$
which implies that the peak wave strains arrive at a shorter downstream distance normalized by the sphere diameter
 $X/D$
(which, however, corresponds to a later dimensionless time in buoyancy units, i.e.
 $Nt$
) at a lower
 $Fr$
.
On the other hand, while the time (or distance) to peak wave impact at the surface can be modelled using simple kinematic arguments of IWs, it is inconclusive as to how the peak wave magnitude itself scales with
 $Fr$
, although an increase of
 ${\it\Delta}_{z}/N$
with
 $Fr$
can clearly be observed. The waves emitted by the higher-
 $Re$
wakes are also recorded to have higher amplitude when arriving at the surface. Similar observations for the amplitudes have also been reported in the wake’s near field (Abdilghanie Reference Abdilghanie2010). Understanding the detailed mechanism by which the waves extract momentum and energy from the turbulence would shed light on how the energy content of the turbulence-emitted waves vary with
 $(Re,Fr)$
. This mechanism is not known completely, and is deferred to further study focusing on turbulence–wave interaction in the wake’s near field.
In this subsection, the time evolution of the surface-observed wave amplitude has been examined. A key ingredient of the model for the time (or distance) to peak wave impact is the scaling of the most energetic wavelength, i.e. (4.3). In the following subsection, the analyses on the length scales of these waves are presented.
4.2 Wavelength
4.2.1 Analysis procedure
The two-dimensional wavelet transform is applied to the surface
 ${\it\Delta}_{z}(x,y)$
field to interrogate the length scales of the wave signatures. This wavelet approach has proved useful in analysing the quasirandom and spatially localized IW field emitted by a turbulent source (Abdilghanie Reference Abdilghanie2010; Abdilghanie & Diamessis Reference Abdilghanie and Diamessis2013). Specifically, a complex two-dimensional localized basis function (or mother wavelet) ‘Arc’ (Dallard & Spedding Reference Dallard and Spedding1993) is used to extract wave patterns of a specific length scale regardless of their spatial orientations (the latter is discussed separately in § 4.4). The analysis procedure is outlined below:
-
(i) Wavelet transform. At a given
$Nt$
, the two-dimensional mother wavelet corresponding to a wavelength
${\it\lambda}_{H}$
is applied to the surface strain field characterized by
${\it\Delta}_{z}(x,y)$
. As the mother wavelet translates in space, the transform modulus is recorded as a function of
$(x,y)$
; by varying the length scale
${\it\lambda}_{H}$
, the modulus forms a three-dimensional cube in the
$(x/D,y/D,{\it\lambda}_{H}/D)$
space. The same exercise is repeated for all
$Nt$
values, and the modulus is stored as a function of
$(x/D,y/D,{\it\lambda}_{H}/D,Nt)$
to describe the entire IW manifestation process on the sea surface. -
(ii) Extraction of wave events. A higher value of transform modulus at a given point in space is indicative of a local resonance event of the wave strain field with the mother wavelet, and thus the existence of a wavepacket of the specific spatial scale. By applying a threshold (here 45 % of global maximum transform modulus across all
$Nt$
values is used) to the modulus data, a large number of resonance events can be isolated in the
$(x/D,y/D,{\it\lambda}_{H}/D,Nt)$
sample space. Since
$x$
is a homogeneous direction in the numerical set-up, no wave statistics are expected to vary in
$x$
. After ‘collapsing’ the four-dimensional data set in
$x$
, a large number of wave events are now extracted in the three-dimensional sample space formed by
$(y/D,{\it\lambda}_{H}/D,Nt)$
. These wave events carry information about the statistical characteristics of the IW packets that appear on the sea surface. In the following, we show these statistics, such as the joint probability density functions (PDFs) of the wave packets.









In order to extract these wave events from the sample space, a threshold value is to be specified on the quantity which serves as an indicator of the wave amplitude. When specifying the threshold, one is to exclude the less energetic events by choosing a relatively large threshold, and on the other hand, to maintain a large enough sample population to construct the PDFs by using a relatively small threshold. A balance between the two factors, where only significant events are extracted in a large enough population, is desirable. This general guideline is followed to produce the results presented in § 4.2, § 4.3 and § 4.4, respectively, when such threshold values are selected. The readers are advised to focus on the structures of the joint PDFs, which are considerably insensitive to the choices of threshold values, rather than the absolute magnitude of the PDFs presented.
4.2.2 Joint distribution of wave events in wavelength–time space
The variation of the wavelengths
 ${\it\lambda}_{H}$
corresponding to the most energetic wave packets is found to be much weaker in the spanwise direction
 $y$
(as can be seen from sample snapshots in figure 3) than the variation in
 $Nt$
. One can therefore proceed by also collapsing the data in
 $y/D$
as well, and focus on the evolution of the length scale
 ${\it\lambda}_{H}$
in time. The joint PDF of these wave events constructed in the
 $({\it\lambda}_{H}/D,Nt)$
space is shown in figure 5. In agreement with figure 4, at a given
 $Re$
, energetic packets with the most frequently occurring wavelength reach the surface at a later
 $Nt$
as
 $Fr$
is reduced. At the higher
 $Re$
, the arrival time of the most frequently occurring wavelength is shifted in time towards a later
 $Nt$
. The joint PDFs appear to lie along a universal line, with the centres of the PDF contours varying as a function of
 $(Re,Fr)$
. In § 4.2.3, the universal trend in which the prevalent wavelength
 ${\it\lambda}_{H}$
evolves with
 $Nt$
, characterized by the evolution of the conditionally averaged wavelength
 $\overline{{\it\lambda}}_{H}$
at each time (see the time variation of dominant wavelength in figure 3), will be further discussed. In § 4.2.5, the most energetic wavelength
 $\hat{{\it\lambda}}_{H}$
, i.e. the wavelength
 ${\it\lambda}_{H}$
corresponding to the peaks of the joint PDFs, will be parameterized by the wake’s
 $Re$
and
 $Fr$
.
Joint probability density contours of most energetic wave packets in the
 $({\it\lambda}_{H}/D,Nt)$
sample space at (a)
 $Re=5\times 10^{3}$
and (b)
 $Re=10^{5}$
, respectively, for
 $Fr\in \{4,16,64\}$
.

Here we highlight two differences between the analyses performed by A&D (who employed the same continuous wavelet transform techniques) and the results presented here: (1) A&D focused on the wake’s near field, whereas we examine the far field; and (2) A&D considered exclusively the variation of conditional mean
 $\overline{{\it\lambda}}_{H}$
in time (which we show in figure 6), whereas we also discuss the most energetic wavelength
 $\hat{{\it\lambda}}_{H}$
, which is identified from the joint probability distribution of wave events in the
 $({\it\lambda}_{H}/D,Nt)$
space (figure 5).
4.2.3 Evolution of mean observable wavelengths
Figure 6 shows the conditional mean IW horizontal wavelength,
 $\overline{{\it\lambda}}_{H}$
, as a function of
 $Nt$
for all simulations.
 $\overline{{\it\lambda}}_{H}$
is the mean
 ${\it\lambda}_{H}$
computed based on the wave events extracted in the
 $({\it\lambda}_{H}/D,y/D)$
sample space at a given
 $Nt$
(see § 4.2.1(b)). For the range of
 $Nt$
values at which a significant probability density is present (figure 5), the time evolution of
 $\overline{{\it\lambda}}_{H}$
in
 $Nt$
seems to follow a universal line across all simulations covering the wake parameter
 $(Re,Fr)$
. The decay of
 $\overline{{\it\lambda}}_{H}$
in
 $Nt$
follows a power law of
 $(Nt)^{-1}$
which is consistent with the laboratory experiments and analysis by Bonneton et al. (Reference Bonneton, Chomaz and Hopfinger1993) and Spedding et al. (Reference Spedding, Browand, Bell and Chen2000). This observation motivates the linear wave model that is to be constructed and calibrated below.
Time series of conditionally averaged wavelengths
 $\overline{{\it\lambda}}_{H}/D$
observed at the sea surface. Best fit to the linear propagation model (4.7) is shown as dashed line.

One may consider the linear propagation of IWs and rewrite (4.1) as
 $$\begin{eqnarray}\frac{{\it\lambda}_{H}}{D}=\frac{z-z_{0}}{D}\frac{2{\rm\pi}}{\sin {\it\theta}\cos ^{2}{\it\theta}}\frac{1}{N(t-t_{0})}.\end{eqnarray}$$
Again, consider the wake’s far field and invoke the far-field condition
 $t\gg t_{0}$
:
 $$\begin{eqnarray}\frac{{\it\lambda}_{H}}{D}\approx \frac{z-z_{0}}{D}\frac{2{\rm\pi}}{\sin {\it\theta}\cos ^{2}{\it\theta}}\frac{1}{Nt}.\end{eqnarray}$$
Hence the power law
 $(Nt)^{-1}$
is recovered in (4.7), in agreement with the observations shown in figure 6 and experiments (Bonneton et al.
Reference Bonneton, Chomaz and Hopfinger1993; Spedding et al.
Reference Spedding, Browand, Bell and Chen2000). The effectiveness of linear theory here indicates that these IWs emitted by turbulence act in the far field as linear waves, at least within the parameter range and uniform stratification examined here. The key physical process driving the time evolution of wavelength at the surface is the waves’ dispersion, i.e. at a given
 ${\it\theta}$
, waves of greater wavelength propagate faster and thus arrive at the observation plane at an early
 $Nt$
, and vice versa.
Schematic of key concepts associated with the linear wave model (4.7) evaluated at the sea surface (
 $z=z_{sfc}$
). Internal waves (dashed arrows) of various wavelengths
 ${\it\lambda}_{H}$
are observed at the surface as if they had been emitted from the virtual origin
 $z_{0}$
at
 $t_{0}\ll t$
. Equation (4.7) relates the surface-observed mean
 ${\it\lambda}_{H}$
to the submerged turbulence characterized by the dimensionless time
 $Nt$
since the passage of the sphere and the corresponding dimensionless distance
 $X/D$
to the wake-generating body as in (1.1).

The linear propagation model in (4.7) can be applied specifically at the sea surface located at
 $z=z_{sfc}$
, where
 $z_{sfc}$
is the depth of the wake centreline below the surface (figure 7). It is desirable to first complete the linear propagation model in (4.7) by calibrating the virtual origin
 $z_{0}$
of the waves based on the observations at
 $z_{sfc}/D=9$
in our simulations. Note that the intended applicability of the model and the calibration parameter
 $z_{0}$
is restricted to the wake’s far field, for which
 $(z,t)\gg (z_{0},t_{0})$
, and to conditions in which the waves are indeed linear and given enough room to disperse when they arrive at the vertical location
 $z$
. In the wake’s near field, however, the waves’ interaction with turbulence is possibly nonlinear (Sutherland & Linden Reference Sutherland and Linden1998), and the waves are not fully dispersed in space, being close to the turbulent source. Therefore, the model (4.7) and any fitting parameter are not expected to give a reliable description of the waves in the near field. In fact, A&D reported a power-law decay of
 $\overline{{\it\lambda}}_{H}$
in
 $Nt$
with exponents different from
 $-1$
, based on near-field sampling of these waves.
In order to calibrate
 $z_{0}$
for the model (4.7), a least squares fit can be applied to the data points in figure 6 contributed by all simulations. The best fit to the data following (4.7) is found to be (with 95 % confidence level):
 $$\begin{eqnarray}\frac{{\it\lambda}_{H}}{D}=\frac{149\pm 2}{Nt},\end{eqnarray}$$
based on observations at a sea surface located at
 $z/D=9$
. By substituting
 ${\it\theta}=45^{\circ }$
, a characteristic prevalent wave emission angle reported by A&D, into (4.7), and utilizing the fit in (4.8), the virtual origin (based on observations in the far field) is found to be
 $$\begin{eqnarray}\frac{z_{0}}{D}=0.62\pm 0.11.\end{eqnarray}$$
 $z_{0}$
is strictly a calibration parameter for the far-field linear wave model (4.7) which enables the prediction of wavelength in the far field for an arbitrary
 $z$
(see in § 4.2.4). As such,
 $z_{0}$
is not to bear implications for the local dynamics at
 $z=z_{0}$
in the wake’s near field, and it should not be confused with the location of the wake edge, itself a function of
 $Fr$
(figure 7 of DSD).
Interestingly, Brandt & Rottier (Reference Brandt and Rottier2015) built upon the theories of Gilreath & Brandt (Reference Gilreath and Brandt1985), Voisin (Reference Voisin, Redondo and Métais1995) and Dupont & Voisin (Reference Dupont and Voisin1996), and deduced that, at
 $Fr=4$
, the origin of the turbulence-generated waves would be at
 $z_{0}/D\approx 1$
and
 $Nt_{0}\approx 3$
, which is comparable to the numerical results presented here for the given
 ${\it\theta}=45^{\circ }$
. However, there is a considerable degree of sensitivity of the calibrated
 $z_{0}/D$
value in (4.9) to the choice of polar angle
 ${\it\theta}$
; for example, as
 ${\it\theta}$
varies from
 $45^{\circ }$
to
 $55^{\circ }$
, a range in which the IWs are observed to be the most energetic (see figure 10 in § 4.3), the
 $z_{0}$
value may vary by approximately
 $2D$
.
4.2.4 Application of the linear model
Time evolution of
 ${\it\lambda}_{H}/D$
in
 $Nt$
for various wake depths,
 $z_{sfc}/D\in [9,18,36]$
, as predicted by (4.7) using the calibrated virtual origin
 $z_{0}/D=0.62$
for waves propagating at
 ${\it\theta}=45^{\circ }$
to the vertical. A given
 ${\it\lambda}_{H}/D$
observed at the surface (marked by the horizontal grey line) may correspond to different
 $Nt$
values (where the vertical grey arrows point at, for each
 $z_{sfc}/D$
considered in the figure) of the submerged turbulence, which may be located at various depths.

As sketched in figure 7, the specific application of linear model (4.7) that is of interest is to connect surface observations of
 ${\it\lambda}_{H}/D$
at a given point in time with the information associated with the submerged turbulence. This information may include dimensionless time
 $Nt$
elapsed since the passage of the object, and/or the dimensionless distance
 $X/D$
to the object. The evolution of wavelength in space and time
 $(z/D,Nt)$
specified by (4.7) is independent of the wake parameters
 $(Re,Fr)$
, if one ignores the weak dependence of
 ${\it\theta}$
in
 $Re$
(see more in § 4.3). Therefore, knowing these parameters a priori may not be a prerequisite for the connection that one would like to make. Figure 8 illustrates some of the implications of (4.7): when the depth
 $z_{sfc}$
and the
 $Nt$
value of the submerged turbulence are both known, one can readily compute the corresponding
 ${\it\lambda}_{H}/D$
to expect at the surface, with (4.7) and the calibrated
 $z_{0}$
in (4.9). However, inferring
 $Nt$
solely from surface observations of
 ${\it\lambda}_{H}/D$
is not as straightforward, because
 ${\it\lambda}_{H}/D$
is not uniquely determined by
 $Nt$
but rather the combination of
 $z_{sfc}/D$
and
 $Nt$
. One can deduce from observations of
 ${\it\lambda}_{H}/D$
the combinations of
 $z_{sfc}/D$
and
 $Nt$
that would produce such a wavelength, but neither
 $z_{sfc}/D$
nor
 $Nt$
individually (see figure 8).
4.2.5 Selection of peak wavelength by wake turbulence
While the time evolution of the mean observable wavelength at a given
 $(z/D,Nt)$
is universally determined by the kinematic properties of IWs prescribed by the linear theory, the most probable wavelength
 $\hat{{\it\lambda}}_{H}$
to be observed, i.e. the most energetic one, does depend on the parameters of the wave-emitting wake, i.e.
 $(Re,Fr)$
(see figure 5). Figure 9 shows the most frequently occurring wavelength identified from figure 5, corresponding to the peaks of the joint PDFs, as a function of
 $Fr$
. For each value of
 $Re$
, an approximate
 $Fr^{1/3}$
-scaling can be observed for
 $\hat{{\it\lambda}}_{H}/D$
, which is consistent with previous studies (Spedding et al.
Reference Spedding, Browand, Bell and Chen2000; Abdilghanie & Diamessis Reference Abdilghanie and Diamessis2013). A dependence on
 $Re$
can also be observed: increasing
 $Re$
from
 $5\times 10^{3}$
to
 $10^{5}$
reduces
 $\hat{{\it\lambda}}_{H}$
by 50 % at a given
 $Fr$
. More discussion on this specific length-scale selection by wake turbulence is given in § 6.2.
 $Fr$
- and
 $Re$
-dependence of the most energetic wavelength
 $\hat{{\it\lambda}}_{H}/D$
observed at the sea surface.

4.3 Wave period
Similar to the length-scale computation outlined in § 4.2, a one-dimensional wavelet transform (with the Morlet mother wavelet) has been applied to time series of horizontal divergence
 ${\it\Delta}_{z}$
signals, sampled at every grid point on the surface, to interrogate the period of these waves. One can then isolate, in a given time series of the transform modulus, the most energetic wave packets (with transform modulus above 35 % of the maximum value at all values of
 $t$
for all locations) as a function of time of occurrence
 $Nt$
and wave period
 $T$
. Again, the
 $x$
-dependence is to be ignored, i.e. the data are to be collapsed in the statistically homogeneous
 $x$
axis. Effectively, for each
 $Re$
and
 $Fr$
, a large population of energetic wave events are sampled in the three-dimensional sample space
 $(y/D,Nt,T/(2{\rm\pi}/N))$
. One can then collapse these three-dimensional data in two ways, either along the
 $Nt$
axis onto the
 $y/D$
–
 $T/(2{\rm\pi}/N)$
plane, or along the
 $T$
axis on the
 $y/D$
–
 $Nt$
plane. On each of these planes, joint PDFs may be constructed, as shown in figures 10–12.
Joint probability density contours of the most energetic wave packets in the
 $(T/(2{\rm\pi}/N),Nt)$
sample space: (a) R5F4 and (b) R100F4.
 $T/(2{\rm\pi}/N)$
values corresponding to polar propagation angles
 ${\it\theta}$
of
 $\{30^{\circ },45^{\circ },55^{\circ },60^{\circ },65^{\circ }\}$
are marked in dashed lines for reference. For R5F4, the PDF peaks at polar angle
 ${\it\theta}=55^{\circ }$
, consistent with the prediction of Voisin (Reference Voisin, Redondo and Métais1995) for the maximum emission angle. For R100F4, the peak polar angle moves noticeably towards a lower value falling in between
 $45^{\circ }$
and
 $55^{\circ }$
.

Distribution of most energetic wave packets in the
 $(|y|/D,T/(2{\rm\pi}/N))$
sample space for
 $Re=5\times 10^{3}$
,
 $Fr=4$
: (a) probability density contours, (b) marginal PDF versus
 $|y|/D$
and (c) marginal PDF versus
 $T/(2{\rm\pi}/N)$
. Marginal PDFs are obtained by integrating the joint PDF over the entire range of one of the random variables, e.g. see Devore (Reference Devore2015).

Distribution of most energetic wave packets in the
 $(|y|/D,T/(2{\rm\pi}/N))$
sample space for
 $Re=10^{5}$
,
 $Fr=4$
: (a) probability density contours, (b) marginal PDF versus
 $|y|/D$
and (c) marginal PDF versus
 $T/(2{\rm\pi}/N)$
.

Figure 10 shows the distribution of most energetic wave packets at
 $Fr=4$
in
 $(y/D,Nt)$
sample space. Results at
 $Fr\in \{16,64\}$
on the distribution of wave packets with respect to
 $y/D$
are qualitatively similar, and thus not shown. The structure of the joint PDF indicates that the most energetic wave packets arrive at a later time and over a longer window in time at the higher
 $Re$
, in agreement with figure 5. Moreover, unlike the strong variation of wavelengths with
 $Nt$
, the variability of wave periods reaching the surface with time is rather weak, especially after the peak wave amplitude has been reached at
 $Nt=70$
and
 $180$
for R5F4 and R100F4, respectively.
However, a strong variation of wave periods can be observed in space; specifically, in the spanwise direction
 $y$
. Figures 11 and 12 illustrate this spatial variability of wave periods and clearly show the dispersive character of the wake-radiated IWs. Regardless of
 $Re$
, the wave period reaches the peak likelihood at approximately 1.5 times the buoyancy period
 $2{\rm\pi}/N$
. Longer periods that are progressively smaller in likelihood (as shown by the marginal PDFs versus
 $T/(2{\rm\pi}/N)$
in figures 11(c) and 12(c)), arrive at larger spanwise offsets. This is because these waves have a group velocity vector that forms a larger angle
 ${\it\theta}$
with respect to the vertical, following the dispersion relation of IWs. This distinct correlation between the spanwise location
 $y$
at which the waves arrive at the surface and the waves’ period
 $T$
is found to be independent of
 $Fr$
. At the higher
 $Re$
shown at
 $Fr=4$
, i.e. R100F4 in figure 12(a), the
 $y/D$
–
 $T/(2{\rm\pi}/N)$
correlation is stronger as compared to the lower-
 $Re$
counterpart, i.e. R5F4 in figure 11(a). Moreover, at R100F4, the marginal PDF in
 $y/D$
, as shown in figure 12(b), starts to decay as far as
 $15D$
away from the centreline, whereas at R5F4 the PDF decays immediately after it peaks at
 $|y|=7D$
, as shown in figure 11(b). Consequently, the waves at higher wake
 $Re$
are more likely to impact larger spanwise distances from the wake centreline.
Near-field measurements of the wake-emitted waves by A&D reported one relatively narrow band of prevalent wave frequencies (and thus propagation angles) for each of the two
 $Re$
values, respectively. It is also reported that a selective viscous decay mechanism, similar to that proposed for waves from a turbulent bottom Ekman layer (Taylor & Sarkar Reference Taylor and Sarkar2007), acts in the wake’s near field to further narrow down the frequency band, at the lower Reynolds number (
 $Re=5\times 10^{3}$
). In the far field, however, the waves are in fact observed to be more broadband in the frequency domain, as compared to laboratory results corresponding to polar angles
 ${\it\theta}=55^{\circ }$
–
 $65^{\circ }$
sampled at vertical distances up to
 $z=4D$
via visual observations of isopycnal displacements (Brandt & Rottier Reference Brandt and Rottier2015). This is because the various frequencies are given enough distance to disperse when they are allowed to propagate over a greater distance into the far field. Dispersion of these waves in the wake’s lateral direction due to the variability in propagation angles
 ${\it\theta}$
widens the spatial extent in
 $y$
in which the waves may manifest themselves. (The polar angle
 ${\it\theta}$
of the wave’s group velocity is not to be confused with the azimuthal angle
 ${\it\alpha}$
associated with the wave strain field on the surface, the latter angle being the subject of the next subsection.) In light of this, one would naturally expect the waves to disperse more in space (specifically, in
 $y$
), should there be a greater vertical offset from the wave source to the observation level. Therefore, the degree of wave dispersion in the spanwise direction
 $y$
(characterized by the width of wave impact in
 $y$
) on the observational plane may give an estimate of the depth of the turbulent source, especially when such information is not available.
4.4 Wave orientation
Information on the location and the orientation at which the IWs are most likely to reach the surface may assist the recognition of these wave patterns from remotely acquired sea-surface images. At any given time and at each point on the sea surface, a two-dimensional eigenvalue/vector decomposition may be applied to the surface rate-of-strain tensor associated with the horizontal velocities
 $(u,v)$
(the vertical velocity
 $w$
vanishes at the rigid lid), which provides the magnitudes of the two principal strain rates and the directions of the two corresponding principal axes (PAs) on the
 $xy$
plane. The dominant PA (with the higher strain-rate magnitude) tends to align perpendicular to the waves’ isophase lines, across which velocity due to the wave varies the most rapidly. Therefore, the direction of the dominant PA gives a convenient measure of the waves’ orientation at a given location on the surface. The joint PDF of the orientation (azimuthal angle
 ${\it\alpha}$
with respect to the wake axis
 $x$
) and the spanwise offset
 $y$
of the wave strains exceeding a certain threshold (80 % of the peak
 ${\it\Delta}_{z,rms}$
at all
 $Nt$
values) may then be computed. These results are shown in figure 13 for
 $Fr=4$
at two values of
 $Re$
. The results at
 $Fr\in \{16,64\}$
are similar, and thus not shown. Two prevalent preferred directions can be identified in figure 13: one at
 $|{\it\alpha}|=0.15$
–0.25 rad (
 $9^{\circ }$
–
 $14^{\circ }$
) which occurs closer to the wake centreline, and the other at
 $|{\it\alpha}|=0.7$
–0.8 rad (
 $40^{\circ }$
–
 $46^{\circ }$
) at a further distance (
 $|y|>5D$
). At the higher
 $Re$
, a noticeable protrusion of the probability density into greater distances (
 $|y|>15D$
) at azimuthal angle
 $1<|{\it\alpha}|<1.5$
rad can be observed.
Joint probability density contours of significant wave events in the
 $(|y|/D,|{\it\alpha}|)$
sample space: (a) R5F4 and (b) R100F4, where
 ${\it\alpha}$
is the azimuthal angle of the dominant principal strain rate with respect to the
 $x$
axis.
 $|{\it\alpha}|=30^{\circ }$
and
 $60^{\circ }$
are marked as vertical dashed lines for reference.

5 Surface manifestation mechanisms
5.1 A general discussion
In this section, possible sea-surface IW manifestation mechanisms are studied. In order for the turbulence-emitted waves to self-manifest, the surface hydrodynamic condition must act in favour of one or more of the various surface modulation mechanisms of remote sensing significance (see § 1.2). Two outstanding issues, which need to be addressed from remote sensing perspectives, are contrast and spatial scales. First, to generate enough contrast on remote sensing images to be perceivable, e.g. to create enough Bragg scattering for the features to appear on the radar image (Alpers Reference Alpers1985), or to generate surface slicks of sufficient thickness (Moum, Carlson & Cowles Reference Moum, Carlson and Cowles1990), the characteristic surface strain rate, i.e.
 ${\it\Delta}_{z}$
, must exceed a certain threshold specified by the modulation mechanism. Second, the spatial scales of these surface anomalies must be small enough to fit the field of view of a certain remote sensor, and large enough compared to the sensor’s resolution. As a first attempt to assess the potential remote visibility of these waves, in § 5.2, the feasibility of generating surface slicks is examined and, in § 5.3, wave-induced surface mass transport is discussed.
5.2 Wave strains and surface slicks
5.2.1 Model formulation
One of the most common mechanisms through which surface velocity strains can modulate the sea surface, and thus create anomalies on remote sensing images, is through the organic-rich surfactant materials within the surface microlayer (Ewing Reference Ewing1950a ,Reference Ewing b ; Alpers Reference Alpers1985; Moum et al. Reference Moum, Carlson and Cowles1990; Ermakov et al. Reference Ermakov, Salashin and Panchenko1992; Soloviev & Lukas Reference Soloviev and Lukas2006; Klemas Reference Klemas2012). The microlayer can increase in thickness due to the accumulation of surfactant under favourable conditions, i.e. flow convergence and low mixing/dispersion due to wind. The surfactant can potentially form surface ‘slicks’ when the microlayer thickness exceeds a certain threshold. These slicks smooth out surface capillary–gravity waves and decrease the surface reflectance to light and microwaves. As a result, the slicks appear as dark bands on optical and radar images, and can possibly reveal the compressive surface strains in the surface flow. Moum et al. (Reference Moum, Carlson and Cowles1990) performed in situ measurements of the surface chemistry and the subsurface hydrodynamics simultaneously at the slicks. They were able to relate the formation of the slicks to the flow convergence, and reported a 5–25 % increase in the surfactant concentration across the slicks relative to the background.
In an attempt to predict the feasibility of slick formation under surface strains due to turbulence-radiated IWs, simulations of the two-dimensional advection equation for the surfactant concentration are performed at the topmost free-slip surface of the computational domain (see figure 1). These auxiliary simulations of the passive scalar field are forced by the surface velocity field generated by the wake simulations. The scalar simulations employ second-order finite difference in space and fourth-order Adams–Bashforth–Moulton (Press et al. Reference Press, Teukolsky, Vetterling and Flannery2007) in time. More realistic models which incorporate the diffusion/relaxation of surfactant gradients (Ermakov et al. Reference Ermakov, Salashin and Panchenko1992) and coupling with surface wave actions (Alpers Reference Alpers1985; Ermakov et al. Reference Ermakov, Salashin and Panchenko1992) have been proposed, and can be readily incorporated should the site-specific parameters involved in these models become available.
Surface snapshot of (a) wave-induced horizontal divergence
 ${\it\Delta}_{z}$
and (b) strain-driven surfactant concentration fields at
 $Nt=70$
for R100F64. Concentration of
 ${\it\Gamma}/{\it\Gamma}_{0}>1.05$
may correspond to surface slicks that can be detectable via remote sensing. Isolines with
 ${\it\Gamma}/{\it\Gamma}_{0}=1.05$
are marked in grey, delineating possible locations of slicks.

5.2.2 Numerical results
The surface surfactant field simulations are initialized with a uniform initial scalar concentration
 ${\it\Gamma}_{0}$
, with this scalar serving as a proxy for the surfactant (Ermakov et al.
Reference Ermakov, Salashin and Panchenko1992). As the IWs impact the surface, the distribution of the scalar field is reorganized into a spatial pattern that overall correlates well with the IW field (see a snapshot in figure 14), with the exception of some slicks at approximately
 $y=0$
which are formed by wave straining that has occurred earlier at these locations, in the absence of any diffusion/relaxation mechanisms of surfactant gradients (Ermakov et al.
Reference Ermakov, Salashin and Panchenko1992). Of interest to a remote sensing specialist is the ratio
 ${\it\Gamma}/{\it\Gamma}_{0}$
, where
 ${\it\Gamma}(x,y,t)$
is the instantaneous scalar concentration at a point. When this ratio exceeds a threshold value (Moum et al.
Reference Moum, Carlson and Cowles1990), the resulting slicks may indeed become remotely visible. The numerical results suggest that the above threshold is regularly exceeded (as in figure 14) for a considerably long duration, particularly at
 $Re=10^{5}$
, bearing strong implications for the detectability of the turbulence-emitted IWs.
5.2.3 Linear analysis
It is desirable to correlate the ratio
 ${\it\Gamma}/{\it\Gamma}_{0}$
with the surface velocity strain magnitude. A scaling analysis of the two-dimensional governing equation is performed here. Decompose concentration
 ${\it\Gamma}$
as
 $$\begin{eqnarray}{\it\Gamma}(x,y,t)={\it\Gamma}_{0}+{\it\Gamma}^{\prime }(x,y,t),\end{eqnarray}$$
where
 ${\it\Gamma}^{\prime }$
is the perturbation to the background state
 ${\it\Gamma}_{0}$
. With this decomposition, the two-dimensional advection equation
 $$\begin{eqnarray}\frac{\partial {\it\Gamma}}{\partial t}+\frac{\partial ({\it\Gamma}u)}{\partial x}+\frac{\partial ({\it\Gamma}v)}{\partial y}=0,\end{eqnarray}$$
can be rewritten as
 $$\begin{eqnarray}\frac{\partial {\it\Gamma}^{\prime }}{\partial t}+{\it\Delta}_{z}({\it\Gamma}_{0}+{\it\Gamma}^{\prime })+u\frac{\partial {\it\Gamma}^{\prime }}{\partial x}+v\frac{\partial {\it\Gamma}^{\prime }}{\partial y}=0.\end{eqnarray}$$
With small perturbations
 $$\begin{eqnarray}{\it\Gamma}^{\prime }\ll {\it\Gamma}_{0},\end{eqnarray}$$
and the particle’s horizontal velocity magnitude much smaller than the waves’ celerity, (5.3) reduces to
 $$\begin{eqnarray}\frac{\partial {\it\Gamma}^{\prime }}{\partial t}+{\it\Delta}_{z}{\it\Gamma}_{0}=0.\end{eqnarray}$$
Given that
 $$\begin{eqnarray}\frac{\partial }{\partial t}\sim \frac{1}{T}\sim {\it\omega}\sim N,\end{eqnarray}$$
the perturbation ratio
 ${\it\Gamma}^{\prime }/{\it\Gamma}_{0}$
scales as
 $$\begin{eqnarray}\frac{{\it\Gamma}^{\prime }}{{\it\Gamma}_{0}}\sim \frac{{\it\Delta}_{z}}{N}.\end{eqnarray}$$
This simple analytical scaling is further confirmed by simulation data (figure 15), which indeed show that the ratio
 ${\it\Gamma}^{\prime }/{\it\Gamma}_{0}$
scales with
 ${\it\Delta}_{z}/N$
, a measure of the IW steepness (A&D). The surface-measured
 ${\it\Delta}_{z}/N$
, and subsequently
 ${\it\Gamma}^{\prime }/{\it\Gamma}_{0}$
, show a distinct increase with both
 $Re$
and
 $Fr$
(see § 4.1), suggesting that at operational parameter values (see § 6.5), at least for an idealized uniform stratification, these turbulence-emitted waves can produce remotely visible surface patterns.
Peak surfactant perturbation ratio
 ${\it\Gamma}^{\prime }/{\it\Gamma}_{0}$
versus the peak dimensionless surface strain
 $|{\it\Delta}_{z}|/N$
observed in all six simulations. Only
 ${\it\Gamma}^{\prime }>0$
, i.e. surfactant enrichment, and
 ${\it\Delta}_{z}<0$
, i.e. flow convergence, are considered. The characteristic enrichment ratio
 ${\it\Gamma}^{\prime }/{\it\Gamma}_{0}=0.05$
(dashed line) across observable slicks according to field measurements (Moum et al.
Reference Moum, Carlson and Cowles1990) is exceeded by all cases except for R5F4. A scaling of
 ${\it\Gamma}^{\prime }/{\it\Gamma}_{0}\sim {\it\Delta}_{z}/N$
(solid line) can be observed.

5.3 Wave-driven Lagrangian flows
Here we study the mass transport driven by the reflecting IWs at the free-slip surface (with vertical velocity
 $w=0$
). To investigate it, two-dimensional tracking of Lagrangian particles forced by the surface
 $(u,v)$
velocity field from the wake simulations has been performed. These Lagrangian tracers are inserted into the surface two-dimensional flow field at the earliest
 $Nt$
of each simulation when the surface flow velocities are virtually zero. Large number of tracers are inserted at regularly distributed locations
 $(x_{0}^{+},y_{0}^{+})$
at the surface at approximately every
 $0.1D$
. The particle-tracking scheme employs fourth-order cubic spline interpolation to obtain the particles’ instantaneous velocities from the simulation data, and marches in time using a locally fourth-order Adams–Bashforth–Moulton method (Press et al.
Reference Press, Teukolsky, Vetterling and Flannery2007). In particular, we are interested in the mass transport in the spanwise direction
 $y$
due to the wave impact. To this end, the lateral displacement
 $$\begin{eqnarray}{\it\Delta}|y^{+}|\equiv \left\{\begin{array}{@{}ll@{}}y^{+}-y_{0}^{+}\quad & \text{ for }y_{0}^{+}\geqslant 0,\\ y_{0}^{+}-y^{+}\quad & \text{ for }y_{0}^{+}<0,\end{array}\right.\end{eqnarray}$$
can be defined, where
 $y^{+}(t)$
is the particle’s instantaneous position. Note that
 ${\it\Delta}|y^{+}|$
is displacement with respect to the initial position
 $y_{0}^{+}$
, and is constructed to be positive when the particle moves away from the wake centreline at
 $y=0$
.
PDF of lateral particle displacements away from the wake centreline at (a) R100F4 and (b) R100F16. Dashed lines denote the PDF before the most energetic waves interact with the surface, and solid lines the PDF after the most energetic wave impact.

We focus on the lateral transport due to the nonlinear effects of the waves during reflection (Zhou & Diamessis Reference Zhou and Diamessis2015). This transport is found to be more significant at the higher
 $Re=10^{5}$
with IWs of higher amplitude interacting with the surface, and the results are shown for R100F4 and R100F16 in figure 16. (Similar effects were observed for R5F64, but no distinct directionality of the mean drift was observed for R5F4 or R5F16, where the wave amplitudes reaching the surface are much weaker in amplitude and shorter in duration.) Before the most energetic waves reach the surface (sampled at
 $Nt=100$
and
 $40$
for R100F4 and R100F16, respectively), the PDF of
 ${\it\Delta}|y^{+}|$
centres around zero with a weak diffusion. After the most intense wave impact (sampled at
 $Nt=300$
and
 $250$
for R100F4 and R100F16, respectively), the PDF diffuses out more and drifts significantly towards the positive values of
 ${\it\Delta}|y^{+}|$
, which implies that the waves advect the Lagrangian tracers away from the wake centreline. This collective net motion of tracers at both sides of the wake centreline creates a local divergence in the lateral mass transport at
 $y=0$
. The magnitude of the drift increases significantly with
 $Fr$
, i.e. the maximum displacement approximately quadruples as
 $Fr$
increases from 4 to 16 at
 $Re=10^{5}$
. Following the same trend, much larger particle displacements are observed at R100F64. However, the particles at R100F64, especially the ones inserted close to the lateral boundaries of the computational domain, move far enough to reach the lateral sponge layers, where motions are artificially damped out. The particles then get trapped at the sponge layers, which makes the interpretation of this particular Lagrangian data set ambiguous. Future work is needed in this regard to investigate the Lagrangian dynamics of IW-impacted sea surfaces at high
 $Fr$
of the wave-emitting turbulence, with an even wider domain in the lateral direction to accommodate increasing particle excursion length scales with
 $Fr$
. Although the Lagrangian effects reported here may be considerably weak, i.e. net drifts on
 $O(0.01)$
–
 $O(0.1)$
of the diameter
 $D$
of the turbulence-generating body, the effect seems to scale strongly with
 $Fr$
, and may potentially be significant at operational parameter values (see § 6.5).
6 Discussion
6.1 Physical processes relevant to IWs in the far field
In the present study, the far-field evolution of turbulence-emitted IWs has been examined within a uniform stratification underneath a free-slip rigid lid at which the waves reflect. It turns out that the most relevant process determining the details of wave observations at the sea surface is the dispersion of these waves in both wavenumber and frequency domains. In § 4.2, it is shown that the dispersion in the wavenumber domain causes a decay of observable wavelength as
 $(Nt)^{-1}$
, which can be predicted by a linear propagation model and thus reveals the linear nature of these waves in the far field. The linear propagation model, combined with the knowledge of most energetic wavelength
 $\hat{{\it\lambda}}_{H}$
, also successfully predicts the
 $Fr^{-1/3}$
-scaling of the arrival time of peak wave impact in
 $Nt$
, as discussed in § 4.1. In § 4.3, it is demonstrated that waves of a wide range of frequencies disperse broadly in the lateral direction of the wake flow, and the degree of this dispersion is expected to correlate to the distance of vertical propagation of the waves. Dispersion in both wavenumber and frequency domains may bear observational implications for inferring the dynamic state of wave-emitting turbulence as measured by the
 $Nt$
value. Moreover, these linear far-field effects may be contrasted to the presumably nonlinear wave–turbulence interactions through which these waves are generated. At least at the
 $Re$
considered in this study, nonlinear interactions among wave packets should not impact far-field dynamics until the waves reflect off the free surface. The transition of the dynamics of the wake-radiated IW field from nonlinear within the generation region to linear upon propagation in the far field was first suggested by Gilreath & Brandt (Reference Gilreath and Brandt1985), and is partially corroborated by the present study.
On the other hand, it is known that finite-amplitude IWs can incur nonlinear effects upon reflection or collision of beams (Lamb Reference Lamb2004; Tabaei et al.
Reference Tabaei, Akylas and Lamb2005; Zhou & Diamessis Reference Zhou and Diamessis2013). Are nonlinear reflection or other forms of wave–wave interaction a relevant process to the waves’ surface signatures? To clarify this, auxiliary simulations (not shown) have been performed to replicate the R5F4 and R100F4 cases in a very similar set-up, but in a taller domain (by
 $4D$
, with the sphere now located at
 $13D$
below the surface) and with a sponge layer (
 $2D$
in thickness) installed at the topmost horizontal surface. In such a modified set-up, upward-going waves are absorbed by the top sponge layer, and thus not allowed to reflect back to the domain, or interact with subsequently arriving waves. Comparison can be made between the free-slip surface in the original set-up, and the
 $xy$
-plane at
 $z=9D$
in the modified set-up, a plane which used to be the free-slip surface in the original set-up. The modified set-up is expected to have no nonlinear effects due to wave–wave interactions. Visual inspections (not shown) of the wave field at the two horizontal planes do not seem to show noticeable differences in terms of spatial patterns, which suggests that nonlinear wave effects do not cause any major modification to the surface observations at
 $Fr=4$
. However, we are not able to perform the same comparison at
 $Fr\in \{16,64\}$
, for which the wave amplitudes are higher, due to the prohibitive computational cost. Moreover, it is found in § 5.3 that wave-induced Lagrangian transport, which is expected to be a second-order nonlinear effect in the wave’s amplitude (Zhou & Diamessis Reference Zhou and Diamessis2015), scales strongly with
 $Fr$
. In summary, while the nonlinear effects found in the wave-reflecting subsurface are not very strong in the cases examined here, it is still premature to reject their importance in the real oceanic parameter range (see more in § 6.5), where the wave amplitudes might be higher. Additional nonlinear effects due to non-uniform stratification and background flows, and the interaction of IWs with near-surface processes (Soloviev & Lukas Reference Soloviev and Lukas2006), are interesting topics for further study.
6.2 Wave selection mechanism
It has been shown in that the wake parameters, i.e.
 $Fr$
and
 $Re$
, play a significant role in selecting the most energetic wavelength
 $\hat{{\it\lambda}}_{H}$
emitted by the turbulence. The question remains as to how the wavelengths of these IWs correlates to the various length scales of the localized stratified turbulence. One might be tempted to correlate
 $\hat{{\it\lambda}}_{H}$
to the size of quasi-two-dimensional coherent structures within the wake, e.g. see Dupont, Kadri & Chomaz (Reference Dupont, Kadri and Chomaz2001). It is known that the Strouhal number
 $St=D/{\it\lambda}_{x}$
scales as
 $(X/D)^{-1/3}$
, where
 ${\it\lambda}_{x}$
is the horizontal length scale of the coherent structures.
 ${\it\lambda}_{x}$
scales similarly with the wake half-width
 $L_{H}$
(Spedding Reference Spedding2014). As a result,
 $$\begin{eqnarray}\frac{{\it\lambda}_{x}}{D}\propto \left(\frac{X}{D}\right)^{1/3}\propto (Nt)^{1/3}Fr^{1/3}.\end{eqnarray}$$
Although the
 $Fr^{1/3}$
-scaling is recovered, the horizontal scales
 ${\it\lambda}_{x}$
or
 $L_{H}$
are not sensitive to
 $Re$
, whereas the most energetic
 ${\it\lambda}_{H}$
is indeed dependent on
 $Re$
(see figure 9).
One may alternatively look for vertical length scales which may possibly determine the wavelength of the emitted IWs. A&D argued that the wavelength may be determined by the wake half-height
 $L_{V}$
, which stays relatively constant during the NEQ regime (DSD).
 $L_{V}$
is 2–4 times the Ozmidov scale
 $\ell _{O}\equiv \sqrt{{\it\varepsilon}/N^{3}}$
at the beginning of the NEQ regime, i.e. onset of buoyancy control at
 $Nt\approx 2$
. The Ozmidov scale is suggested to scale as
 $Fr^{1/3}$
(Spedding Reference Spedding2002), which is the
 $Fr$
-scaling found here for the most energetic wavelength (figure 9). Gibson (Reference Gibson and Nihoul1980) proposed that the value of the Ozmidov scale at the onset of buoyancy control is the governing quantity which sets the IW wavelength generated by turbulence. The dissipation rate
 ${\it\varepsilon}$
may be estimated indirectly from our implicit large-eddy simulation data using scaling arguments presented in appendix A. Neglecting any possible biases of the
 $O(1)$
proportionality constant discussed at the end of appendix A, figure 17 indicates that
 $\ell _{O}$
does not follow the observed
 $Fr^{1/3}$
-scaling proposed for it by Spedding (Reference Spedding2002), nor the same scaling observed here for
 $\hat{{\it\lambda}}_{H}$
(figure 9). Most importantly,
 $\ell _{O}$
, a large-scale quantity, is independent of
 $Re$
, whereas
 $\hat{{\it\lambda}}_{H}$
does vary with
 $Re$
(see figure 9).
 $Fr$
-dependence of the time-averaged Ozmidov scale
 $\ell _{O}/D$
during the early stage of the NEQ regime (
 $2\leqslant Nt\leqslant 20$
).
 $\ell _{O}$
does not exhibit the
 $Re$
-dependence of the most energetic wavelength
 $\hat{{\it\lambda}}_{H}$
as shown in figure 9. The least-squares-fit power-law exponent
 ${\it\phi}$
as in
 $\ell _{O}/D\propto Fr^{{\it\phi}}$
based on the six data points is found to be
 $0.55\pm 0.15$
.

Alternatively, one can consider the vertical integral length scale of the stratified turbulence. At buoyancy Reynolds number
 $Re_{b}={\it\varepsilon}/({\it\nu}N^{2})>1$
(as is the case during the transition to NEQ and onward in our
 $Re=10^{5}$
simulations; see DSD),
 $$\begin{eqnarray}\ell _{V}\sim \frac{u^{\prime }}{N},\end{eqnarray}$$
where
 $\ell _{V}$
can be interpreted as the vertical Taylor scale of the turbulence (Billant & Chomaz Reference Billant and Chomaz2001; Riley & Lindborg Reference Riley, Lindborg, Davidson, Kaneda and Sreenivasan2012) and
 $u^{\prime }$
is the horizontal r.m.s. velocity. The validity of (6.2) at sufficiently large
 $Re_{b}$
was verified by Zhou (Reference Zhou2015) for the wake flows considered here. In the context of a wake, following the power laws identified by Spedding (Reference Spedding1997),
 $$\begin{eqnarray}u^{\prime }\sim U_{0},\end{eqnarray}$$
where
 $U_{0}$
is the maximum centreline velocity and thus
 $$\begin{eqnarray}\ell _{V}\sim \frac{U_{0}}{N}.\end{eqnarray}$$
Therefore,
 $$\begin{eqnarray}\frac{\ell _{V}}{D}\sim \frac{U_{0}}{ND}=\frac{1}{2}\frac{U_{0}}{U}Fr.\end{eqnarray}$$
Noting that
 $$\begin{eqnarray}\frac{U_{0}}{U}\propto Fr^{-2/3}\end{eqnarray}$$
at a given
 $Nt$
(Spedding Reference Spedding1997), one can write
 $$\begin{eqnarray}\frac{\ell _{V}}{D}=C_{\ell }Fr^{1/3}.\end{eqnarray}$$
However, it is unclear whether the above scaling arguments which led to (6.7) hold for the
 $Re=5\times 10^{3}$
considered here. At this
 $Re$
, the wake flow is significantly impacted by viscosity and (6.7) is not likely to hold. Nevertheless, simulation results (shown in figure 18) indicate that at the early stage of the NEQ regime, i.e.
 $2\leqslant Nt\leqslant 20$
, (6.7) does hold for both
 $Re$
values considered. This window of time has been identified as the one when IWs are most radiated (A&D).
 $C_{\ell }$
is found to be dependent on
 $Re$
during the above time interval as
 $$\begin{eqnarray}C_{\ell }=\left\{\begin{array}{@{}ll@{}}0.17\quad & \text{at }Re=5\times 10^{3},\\ 0.085\quad & \text{at }Re=10^{5}.\end{array}\right.\end{eqnarray}$$
The computation of the volume-averaged vertical Taylor scale
 $\ell _{V}$
follows the definition proposed by Riley & de Bruyn Kops (Reference Riley and de Bruyn Kops2003). In § 4.2, the most energetic wavelengths
 $\hat{{\it\lambda}}_{H}$
, as identified by the peaks of the PDFs (figure 5) are found to follow
 $$\begin{eqnarray}\frac{\hat{{\it\lambda}}_{H}}{D}=C_{{\it\lambda}}Fr^{1/3},\end{eqnarray}$$
where
 $$\begin{eqnarray}C_{{\it\lambda}}=\left\{\begin{array}{@{}ll@{}}1.2\quad & \text{at }Re=5\times 10^{3},\\ 0.60\quad & \text{at }Re=10^{5},\end{array}\right.\end{eqnarray}$$
as seen in figure 9. Therefore,
 $\ell _{V}$
and
 $\hat{{\it\lambda}}_{H}$
indeed scale very similarly in both
 $Fr$
and
 $Re$
, i.e. a
 $Fr^{1/3}$
-scaling and a 50 % decrease occurs as
 $Re$
increases from
 $5\times 10^{3}$
to
 $10^{5}$
, according to (6.7)–(6.10). A scaling of
 $$\begin{eqnarray}\hat{{\it\lambda}}_{H}\sim 7\ell _{V},\end{eqnarray}$$
based on the coefficients in (6.8) and (6.10), seems to hold within the parameter range examined, where
 $\hat{{\it\lambda}}_{H}$
is the most energetic horizontal wavelength emitted by the turbulence of vertical Taylor scale
 $\ell _{V}$
during the NEQ regime. However, this observation holds only at the two
 $Re$
values examined here and requires verification at higher
 $Re$
. The physical mechanism behind this correlation is unknown to us, and requires further study focusing on wave–turbulence interactions in the wake’s near field.
 $Fr$
-dependence of the time-averaged vertical Taylor scale
 $\ell _{V}/D$
during the early stage of the NEQ regime (
 $2\leqslant Nt\leqslant 20$
).
 $\ell _{V}$
exhibits a similar
 $Re$
- and
 $Fr$
-dependence of the most energetic wavelength
 $\hat{{\it\lambda}}_{H}$
as shown in figure 9.

Moreover, as shown in § 4.4, the turbulence has preferred orientations in which it emits waves and subsequently creates spatial patterns on the sea surface. However, the mechanism by which turbulence chooses the prevalent orientation of the emitted waves is unknown. For example, are there separate dynamic processes in the turbulent wake core which are responsible for the two distinct emission angles (figure 13), respectively? A possibility is that the spatial orientation of the waves may correlate to that of the wave-generating coherent structure of the turbulence, which is intriguing and deserves further study.
6.3 Comparison to Abdilghanie and Diamessis (2013)
A&D reported the near-field wave characteristics from a very similar numerical set-up to the present study. They reported a significant prolongation of wave radiation at
 $Re=10^{5}$
as compared to
 $Re=5\times 10^{3}$
, which was attributed to the hypothesized persistent wave generation by the secondary turbulence, the latter being linked to Kelvin–Helmholtz instability events during the NEQ regime of the wake. However, this hypothesis is not supported by our observations in the far field. Based on our analysis (§ 4.1), which is consistent with the observations, the most energetic waves simply are delayed in reaching the observation plane at the sea surface, because the most energetic wavelength
 $\hat{{\it\lambda}}_{H}$
is smaller at higher
 $Re$
(by a factor of two as compared to the lower
 $Re$
; see figure 9), and thus the waves are slower in propagation.
The effectiveness of the linear model (§ 4.2.3) in describing the wavelength variation in time as
 $(Nt)^{-1}$
relies on the fact that the waves are all generated within a fairly short time interval in the early wake at
 $t_{0}\ll t$
, where
 $t$
is the time at which these waves are observed in the far field. Should the secondary turbulence (which occurs at
 $30\leqslant Nt\leqslant 100$
as observed by DSD) indeed contribute significantly to wave emission, the assumption that the waves are generated impulsively in the early wake would break down, and the linear model (§ 4.2.3) would not have worked. Therefore, at the range of wake parameters examined here, secondary turbulence does not seem to generate IWs efficiently, at least not enough to noticeably impact the far field. All waves seem to be generated fairly impulsively in the early wake by the more energetic turbulence, as can be inferred from the time variation of wavelength at the sea surface.
It remains to be examined why the above is the case: What is the optimal condition for the stratified turbulence to generate IWs? Is it a question of the energy content of the wave-generating turbulence, or do the distinct structural characteristics of the turbulence (e.g. the layered flow structure typical of stratified turbulence reported by Brethouwer et al. (Reference Brethouwer, Billant, Lindborg and Chomaz2007)) also play a role? If the latter is true, secondary turbulence could indeed become a considerable contributor to the wave field, presumably at even higher
 $Re$
, where the layering is more intense (Riley & de Bruyn Kops Reference Riley and de Bruyn Kops2003). These highly intriguing questions certainly warrant further study in the future.
6.4 Comparison to experiments
In this paper, the numerical results reported in this paper have repeatedly been discussed in comparison to their experimental counterparts. Here we offer a summary of these comparisons. Qualitatively, the phase configurations of turbulence-emitted IWs (§ 3) match the
 ${\it\Delta}_{z}$
visualizations on the horizontal plane by Spedding et al. (Reference Spedding, Browand, Bell and Chen2000) and Spedding (Reference Spedding2014), as well as vertical-span transects of IWs driven by transient forcing (Stevenson Reference Stevenson1973; Lighthill Reference Lighthill1978). Quantitatively, the
 $Fr^{1/3}$
-scaling of the most energetic wavelength
 $\hat{{\it\lambda}}_{H}$
agrees with the experimental observations by Spedding et al. (Reference Spedding, Browand, Bell and Chen2000), and the
 $(Nt)^{-1}$
decay of mean wavelength
 $\overline{{\it\lambda}}_{H}$
in time is consistent with Bonneton et al. (Reference Bonneton, Chomaz and Hopfinger1993). Within the various approximations made to construct the linear dispersive model (§ 4.2.3), the waves’ virtual origin deduced from far-field observations (figure 6) is comparable to those reported by Brandt & Rottier (Reference Brandt and Rottier2015).
The numerical model replicates only a subset of the IW-generating mechanisms as compared to the laboratory studies. Due to the incorporation of sponge layers in our computation, the formation of vertical modes is effectively excluded from the numerically computed wave field, whereas these wave modes can indeed become significant in confined tank experiments, e.g. as reported by Brandt & Rottier (Reference Brandt and Rottier2015). Towed-sphere experiments (Hopfinger et al.
Reference Hopfinger, Flor, Chomaz and Bonneton1991; Bonneton et al.
Reference Bonneton, Chomaz and Hopfinger1993; Lin et al.
Reference Lin, Boyer and Fernando1993; Robey Reference Robey1997; Brandt & Rottier Reference Brandt and Rottier2015) also suggest that the IW-generation mechanisms linked to the lee wave mechanism and wake turbulence may coexist at
 $Fr=4$
. Therefore, our simulations at
 $Fr=4$
may represent only part of the wave generation mechanisms. In addition, lacking a statistically inhomogeneous streamwise direction
 $x$
, the numerical model excludes the wave-generating mechanism considered by Källén (Reference Källén1987), the latter requiring a three-dimensional mean-flow structure that is dependent on
 $x$
.
6.5 Higher
$Fr$
? Higher
$Re$
?


Spedding (Reference Spedding2014) estimated the
 $Re$
and
 $Fr$
of geophysical and naval wakes, which are in a higher range than those investigated in the present study. For example, wakes relevant to naval applications have
 $Re=O(10^{8})$
and
 $Fr=O(10^{3})$
. In the range of
 $Fr$
investigated, the potential of IW-generating far-field effects increases with
 $Fr$
. However, at infinite
 $Fr$
, i.e. when the fluid is unstratified, there is no IW expected to be radiated from the wake. Therefore, a natural question to ask is if there exists an optimal wake
 $Fr$
for maximum far-field impact. On the other hand, a
 $Re$
-dependence is seen in the IW amplitude and dominant wavelength. The question remains as to whether these wave characteristics reach an asymptote at the high
 $Re$
values of oceanic relevance. Moreover, the breaking of these turbulence-emitted waves in the wake’s near field may be possible when the wave amplitude further increases with
 $Re$
and
 $Fr$
, which may further complicate the manifestation of these waves in the far field. Although computations at higher values of
 $Re$
and
 $Fr$
can be considerably expensive, ongoing efforts are devoted towards investigating wake physics at a higher
 $Re$
than the maximum value considered here (Zhou Reference Zhou2015).
7 Concluding remarks
A complete and systematic characterization of the surface signatures of IWs emitted by localized stratified turbulence, prototyped by a towed-sphere wake, has been performed in this study. The most striking result might be that the time variation of the conditionally averaged dimensionless wavelength
 $\overline{{\it\lambda}}_{H}/D$
versus
 $Nt$
at a fixed distance (in our case, at the sea surface) from the turbulent wave source is universal in wake parameters
 $(Re,Fr)$
. This result gives rise to the potential of correlating surface observations of IWs to the age of the underlying wave-emitting turbulence in
 $Nt$
, an inference that can be achieved without the full knowledge of the wake parameters
 $Re$
and
 $Fr$
, provided that the depth of the turbulent wave source is given. This universality of the time evolution of wavelength in
 $(Re,Fr)$
relies on the fact that linear theory works well for these turbulence-radiated waves in their far-field propagation. The virtual origin of these waves, which is independent of the wake parameters, has been determined. The linear propagation model with the calibrated virtual origin enables the prediction of the prevalent wavelength at a given space and time in the far field, and may assist the interpretation of surface observation of these waves. On the other hand,
 $Fr$
- and
 $Re$
-dependence does play a critical role in determining the most energetic wavelength
 $\hat{{\it\lambda}}_{H}$
(and consequently the
 $Nt$
or
 $X/D$
at which this wavelength reaches the surface). A
 $Fr^{1/3}$
-scaling for
 $\hat{{\it\lambda}}_{H}/D$
and a considerable decrease of this wavelength with
 $Re$
are observed. This scaling coincides with that of the vertical Taylor scale of the wake turbulence. Wave dispersion, both in wavenumber and frequency domains, seems to be the dominating physical process in the wake’s far field, in the absence of a variable background stratification and mean-flow profile. At the higher
 $Re$
examined, the delay of the most intense wave impact in time at a fixed distance to the wake is caused by the reduction of the most energetic wavelength
 $\hat{{\it\lambda}}_{H}$
emitted by the turbulence, and thus the reduction of the waves’ group velocity. This mechanism is in contrast to the hypothesis of A&D that it is secondary turbulence in the NEQ wake which produces these waves that appear at a later
 $Nt$
. This observation motivates a reconsideration of the nature of IW generation by evolving stratified turbulence, i.e. whether the generation is confined at the early stages of NEQ regime, with the energy content of the waves increasing with
 $Re$
, or it is persistent throughout the entire NEQ regime. The potential for generation of surface slicks and divergence patterns in the long-term Lagrangian transport at the surface is for the first time discussed for obliquely propagating IWs.
Future work at a higher
 $Fr$
and/or
 $Re$
is highly attractive, but is currently restricted by computational power. It is also of interest to incorporate more realistic oceanic stratification and mean-flow profiles in the subsurface, as well as take into account the interactions of the surface-approaching IWs with the near-surface processes. The findings of this particular study may serve as a platform to explore the physics of the generation and surface manifestation of IWs radiated by other canonical submerged stratified turbulent flows, such as jets (Druzhinin Reference Druzhinin2009), buoyant plumes (Keeler, Bondur & Gibson Reference Keeler, Bondur and Gibson2005) and horizontal turbulent fronts (Maffioli et al.
Reference Maffioli, Davidson, Dalziel and Swaminathan2014).
Acknowledgements
We are grateful to Professor W. D. Philpot for stimulating discussions on remote sensing of the ocean surface. Professor G. R. Spedding is thanked for insightful discussions. Professor S. B. Pope is thanked for commenting on an early version of this manuscript. Dr B. Voisin is thanked for sharing materials from his analytical work. We thank four anonymous reviewers for many insightful comments which improved the quality of this article. Support through Office of Naval Research grants N00014-08-1-0235 and N00014-13-1-0665 administered by Dr R. Joslin is gratefully acknowledged. The work of the first author was supported, in part, by an EPSRC Programme Grant EP/K034529/1. The second author also acknowledges the support of National Science Foundation CAREER award grant OCE-0845558. High-performance computing resources were provided through the US Department of Defense High Performance Computing Modernization Program by the Army Engineer Research and Development Center and the Army Research Laboratory under Frontier Project FP-CFD-FY14-007, and by the Open Research Systems.
Appendix A. Estimation of Ozmidov scale
As discussed by DSD, the implicit large-eddy simulation solver employed in the present study does not allow the direct estimation of dissipation rate
 ${\it\varepsilon}$
very accurately, therefore posing challenge for the estimation of the Ozmidov scale
 $\ell _{O}\equiv \sqrt{{\it\varepsilon}/N^{3}}$
. In order to estimate
 $\ell _{O}$
to enable the discussion in § 6.2, one can assume that there exists a forward energy cascade in the horizontal turbulent motions during the transition to and the early stage of the NEQ regime, and therefore (see e.g. Riley & Lindborg Reference Riley, Lindborg, Davidson, Kaneda and Sreenivasan2012)
 $$\begin{eqnarray}{\it\varepsilon}=\frac{u^{\prime 3}}{\ell _{H}},\end{eqnarray}$$
where
 $\ell _{H}$
can be interpreted as a horizontal integral scale (Riley & Lindborg Reference Riley, Lindborg, Davidson, Kaneda and Sreenivasan2012) and its estimation for the wake flow is described in DSD. Noting (A 1), one can write (see also (14.32) of Davidson Reference Davidson2013)
 $$\begin{eqnarray}\frac{\ell _{O}}{D}=\left(\frac{u^{\prime 3}}{\ell _{H}N^{3}}\right)^{1/2}\frac{1}{D}=F_{H}^{3/2}\left(\frac{\ell _{H}}{D}\right),\end{eqnarray}$$
where
 $F_{H}\equiv u^{\prime }/(N\ell _{H})$
is the turbulent Froude number describing the horizontal motions (see e.g. Riley & Lindborg Reference Riley, Lindborg, Davidson, Kaneda and Sreenivasan2012). Information on
 $F_{H}$
and
 $\ell _{H}/D$
for the wake flow is reported in full detail by Zhou (Reference Zhou2015), and thus the normalized Ozmidov scale
 $\ell _{O}/D$
can be estimated through (A 2). The above analysis is equivalent to assuming that the buoyancy Reynolds number,
 $Re_{b}={\it\varepsilon}/({\it\nu}N^{2})$
is proportional to
 $Re_{H}F_{H}^{2}$
, where
 $Re_{H}$
is a corresponding horizontal turbulent Reynolds number, as demonstrated by Hebert & de Bruyn Kops (Reference Hebert and de Bruyn Kops2006), who found an
 $O(1)$
proportionality constant for the case of forced homogeneous stratified turbulence.



