

Introduction
ETHNIC bias in the distribution of state resources is endemic around the world.Footnote 1 The literature provides two main explanations for this phenomenon. One attributes it to electoral pressures:Footnote 2 an incumbent politician expects a lower electoral “rate of return” from (re)distribution to non-coethnics either because particularistic benefits can't be targeted efficientlyFootnote 3 or because ethnic out-groups are less likely to expect and reward such benefits in the first place.Footnote 4 The other explanation attributes the bias to greater altruism toward in-group members or to taste-based discrimination.Footnote 5 Neither explanation adequately accounts for the historical process of state-building that determines both ethnic demographics and the state's capacity to target resources to specific ethnic groups.Footnote 6
This article proposes a novel and complementary explanation for the widespread phenomenon of ethnic bias, one that takes into account the history of state interaction with different groups. I find that approaches to governance often vary based on group identity. Non-coethnics, in particular, may be governed through intermediaries to save on administrative resources and to secure cooperation without coercion. In the short run, indirect rule reduces the central government's information asymmetries vis-à-vis non-coethnics, but in the long run it prevents ethnic out-groups from interacting with the state and impedes the accumulation of state capacity.Footnote 7 As a result, non-coethnics’ social practices and economic resources remain illegible to state officials.
Low informational capacity, in turn, weakens state control over revenue extraction and thus reduces the state's incentives to allocate resources to non-coethnic populations.Footnote 8 State officials are more likely to discriminate against non-coethnics when they can't ensure that investing in this group will pay off in tax revenues. This fiscal logic of ethnic discrimination is most applicable to administratively weak autocracies, which lack detailed information about their populations and bear limited electoral costs for ignoring citizens’ needs.
I test this argument using data on the 1891/1892 famine in the Russian Empire. Famine relief is less studied than other collective goods, such as education and health care, even though it's one of the basic services that states have historically provided to their citizens.Footnote 9 Authoritarian and democratic governments alike have incentives to avert famines because famine-induced mortality is concentrated in space and time, providing a clear signal of incompetence.Footnote 10 And yet states often misallocate aid, leaving the most vulnerable population groups unattended.Footnote 11
The 1891/1892 famine, among the worst in Russian history, occurred in the Volga basin, a region with a multiconfessional population and a history of peasant unrest.Footnote 12 The government mounted an extensive relief campaign that provided supplementary rations to millions of people. Yet the distribution of aid was extremely uneven: the size of loans for food and seed, the timing of relief operations, and the famine-induced mortality varied across districts with comparable crop failures.
My analysis of a newly assembled district (uezd) data set on famine mortality and state relief suggests that religious demography influenced the extent of human suffering and the quality of the imperial government's response to the crisis. Districts with a larger Muslim minority experienced higher mortality and lower natality in the famine year. At the same time, the relief campaign was less extensive in such districts: food loans were smaller, on average, and the relief campaign was shorter.
What explains the observed bias in relief distribution? One obvious explanation is the prejudice of largely Russian Orthodox state officials. But differences in state capacity—a legacy of past governance strategies—also mattered. At the time of the famine, the Muslim minority in Russia was still governed with the help of religious intermediaries (whose authority was eroding rapidly), whereas other confessions were subject to the same administrative apparatus as the Orthodox peasants. As such, state agents faced particular difficulties in obtaining information from Muslims and in taxing them. I show that the officials’ ability to gather information, proxied by the accuracy of age data reported in the 1897 census, was lower in districts with a larger Muslim population than in Orthodox districts or in those with other religious minorities. Actual tax receipts were also lower. Reports from zemstvos, local self-government institutions, indicate that officials delayed or withheld aid because they couldn't collect tax arrears or be certain that Muslim communes would repay their loans. Other minorities, such as the Protestant and Catholic German settlers and the Old Believers, a group of dissenters who had left the Russian Orthodox Church, were more legible to the state because they were administered in the same way as the Orthodox peasantry and interacted more directly with state agents. I also show that linguistic cleavages were less important for the allocation of relief and don't predict fiscal or informational capacity; this weak correlation between language and state capacity is consistent with my argument that information asymmetries that resulted from reliance on a confessional governance, rather than out-group prejudice alone, shaped the distribution of famine relief.
This study's findings fit with the evidence in other settings that minorities are disadvantaged in the provision of infrastructural goods and welfare. But I offer a novel explanation for these patterns: differences in legibility across ethnic groups. This mechanism is compatible with accounts that emphasize politicians’ electoral incentives to distribute to coethnics because greater knowledge of a specific ethnic group means more efficiency in translating particularistic benefits into electoral payoffs.Footnote 13 But it also implies that non-coethnics may receive fewer transfers from the state because they generate less revenue—that is, they're not disadvantaged to the same extent across all domains of distributive politics, and they can get away with paying less to the state coffers. Orthodox peasants received more support than Muslim peasants during the famine in Imperial Russia, but they also paid more taxes. This article thus underscores the flip side of the preferential service delivery toward coethnics: state officials rely more heavily on coethnics when it comes to raising tax revenue. This insight is consistent with Kimuli Kasara's finding that politicians tax coethnics at higher rates because the politicians have more reliable allies and intermediaries in coethnic areas.Footnote 14 Yusuf Magiya finds similar patterns in the Ottoman empire, which taxed Sunni Muslims, a dominant group, more heavily than minority groups in wartime.Footnote 15
This article's second contribution is to link information asymmetries in diverse societies to historical differences in governance institutions. My findings fit with recent work that views contemporary public goods provision and ethnic heterogeneity as legacies of institutional development in the past.Footnote 16 The article also relates to the scholarship on the enduring negative implications of indirect colonial rule for state capacity and public goods provision in South Asia and Africa.Footnote 17 For instance, the British devoted less funding to those Indian provinces in which they delegated the responsibility for collecting taxes to zamindars (landowners) because that reliance on intermediaries reduced British contact with the local population and constrained tax policy.Footnote 18 In West Africa, the weakness of the colonial administration and its reliance on chiefs for tax collection resulted in a combination of lower public investment in regions with less compliant intermediaries and lower revenue extraction.Footnote 19 Ethnic intermediaries are still powerful in many developing countries, as citizens lack direct ties to state institutions and don't participate in formal fiscal exchange. This equilibrium comes with low state investment and high social extraction based not on citizenship but rather on lineage, ethnicity, or religion.Footnote 20
In addition, by highlighting fiscal considerations that arise from intergroup differences in legibility by state officials, this article advances scholarship on the institutional determinants of state responsiveness to famines and other humanitarian crises.Footnote 21 I show that when disaster strikes, assisting populations whose needs are harder to verify or who are harder to tax may be a lower priority. By contrast, targeting economic support to legible groups allows the state to recover quickly after a disruption in revenue flows. In his seminal book, James Scott argues that governments’ attempts to make their populations “legible” through collectivization, “villagization,” and similar coercive policies have contributed to famines in Ethiopia, Tanzania, and Ukraine.Footnote 22 Yet these policies, despite their cruelty and ineffectiveness, were envisioned as a way to increase food production and raise revenues. In the USSR, the forced collectivization of the peasantry, which contributed to the 1932/1933 famine and increased mortality in Ukrainian-dominated provinces,Footnote 23 was motivated by the Bolsheviks’ goal to feed growing cities and to increase the grain exports needed to finance industrialization. In Imperial Russia (a weaker state), extracting more grain meant channeling aid to the more taxable Orthodox peasants at the expense of Muslims. But the USSR, which had more coercive power, sought to reduce information asymmetries vis-à-vis a resistant Ukrainian peasantry by forced collectivization, with equally disastrous consequences for the noncore group. My study also relates to work on how information deficiencies limit the ability of governments to respond to famines even when they have the resources and willingness to do so.Footnote 24
Argument
My argument proceeds in two steps: (1) clarifying the link between informational capacity, taxability, and incentives to invest state resources; and (2) highlighting why informational capacity may vary with ethnicity.Footnote 25
Governments’ incentives to supply collective goods are shaped by their informational capacity. On the one hand, knowledge about specific communities allows governments to target resources in ways that maximize fiscal returns. On the other hand, information asymmetries in relation to specific population groups can lead to discrimination in the distribution of state resources because state officials can't ensure that transfers will pay off in future revenues. From the perspective of state officials, illegible populations are a risky investment because they're harder to tax and their needs are less verifiable.Footnote 26
Information and extractive capacity are sometimes seen as conceptually distinct dimensions of state capacity, but in practice they are closely related.Footnote 27 Assessing and collecting taxes depend on first obtaining accurate information about the population, including its economic activity and assets.Footnote 28 Whenever the early-modern state was unable to evaluate individual incomes and assign the tax burden accordingly, it relied on customs and trade taxes, as well as on land taxes where the apportionment of fixed sums was left largely to the discretion of local communities.Footnote 29 The need for greater revenue motivated states to expand information-gathering capabilities through cadastral surveys, censuses, and tax registers.Footnote 30 This increase in informational capacity, in turn, enabled greater tax revenues and public goods provision.Footnote 31
In multiethnic states, informational capacity is often discontinuous at ethnic or religious boundaries. Shared culture and social ties are important for citizens’ willingness to cooperate with state officials, as well as for officials’ ability to monitor and sanction noncompliance.Footnote 32 Governing religious, ethnic, or linguistic out-groups entails higher transaction costs. As a rule, non-coethnics will be less legible than coethnics from the state's perspective; legibility may also vary across non-coethnic groups. Governments can solve the information problem by building up administrative capacity in out-group dominated regions, but this strategy only pays off in the long run. As noted above, the fiscal payoff of institutional and other investments tracks with legibility: more illegible means lower lower payoff. A cheaper solution to this information problem is indirect rule, whereby the resource-constrained state is able to extract some revenue from harder-to-monitor areas by delegating authority to local intermediaries. In the developing world, most citizens still lack direct contact with the government; instead, ethnic and religious intermediaries are responsible for collecting taxes and providing services.Footnote 33
Although it's effective in the short run, reliance on local intermediaries leaves the central government blind with respect to non-coethnics’ economic activity. It reduces the government's ability to directly monitor and enforce compliance with taxation and other policies, thus limiting its reach into minority-dominated areas.Footnote 34
I argue that the lower legibility of ethnic out-groups who are indirectly ruled will disadvantage those groups in the allocation of state resources. State officials will discriminate against the illegible non-coethnics in the distribution of collective goods because the officials can't ensure that resources allocated to this group will pay off in tax revenues. This bias in distribution does not depend on out-group prejudice or electoral incentives.
Ethnic differences may also affect the allocation of state resources and governance through other channels. Non-coethnics are more likely to resist the imposition of direct rule, which not only makes them less legible but also could affect state policy directly. The threat of unrest is a prominent explanation for the variation in state-provided resources in authoritarian settings.Footnote 35 Food riots have been linked to the politics of food provision in times of scarcity, although famines may also demobilize.Footnote 36 On the one hand, governments may seek to stay in power by transferring more resources to areas prone to rebellion despite lower informational capacity in such areas. On the other hand, states may leverage famine relief to increase control over the illegible populations, taking advantage of their desperate situation.
Historical Context
In 1891, a severe crop failure struck the Volga River basin, a region where Muslims, Old Believers, and Western Christians lived alongside the Russian Orthodox majority.Footnote 37 The immediate causes of the crop failure were the cold winter of 1890/1891 and the summer drought that followed, both of which affected large swaths of the region. As a result of these combined temperature and precipitation shocks, the winter crop of rye, wheat, oats, and barley failed almost completely; the harvest in the worst-affected areas was less than 25 percent of the 1883–87 average. As measured by the percentage deviation of the output-seed ratio from an eight-year moving average, the 1891 grain harvest was the worst on record between 1833 and 1911.Footnote 38
Initially, the government was reluctant to admit the famine's existence. Finance Minister Ivan Vyshnegradsky opposed a ban on grain exports, as he considered them essential for strengthening the economy. He adopted the mantra, “Even if we starve, we will export grain.”Footnote 39 But the government eventually organized an unprecedented relief campaign. In 1891/1892, state aid amounted to at least 196 million rubles, or 20 percent of total state expenditure in 1891.Footnote 40 At the height of the relief effort in early 1892, at least 11.8 million people—about 10 percent of European Russia's population—were receiving government assistance in the form of food and seed loans or public works.
Distributing relief on that scale was a daunting task, given the state's sparse presence in the countryside. The government depended on district zemstvos to appraise local needs and request aid from provincial authorities, who then turned to the central government.Footnote 41 Zemstvo officials had to rely on information provided by the peasants themselves. Self-reported estimates of local need were sometimes exaggerated, but because the entire commune was collectively responsible (krugovaia poruka) for repaying any loans disbursed to needy households,Footnote 42 the wealthier villagers just as often conspired to ensure that the estimates were kept low.Footnote 43 Uncertainty about the true extent of harvest loss and the affected population delayed the provision of public assistance, as village communes, land captains, zemstvo officials, the governor, and the Ministry of Internal Affairs (mvd) all wrangled over the size of loans needed to relieve the citizenry. Insufficient knowledge about household-level conditions also increased the misallocation of aid. As one contemporary expert explained, the zemstvo “often does not know to whom and how the aid ought to be given. Through its ‘emissaries’ and randomly dispatched members, it compounds the guesswork, and thus its aid does not achieve its goal.”Footnote 44
As many as five hundred thousand people died as a result of food scarcity and concurrent outbreaks of cholera and typhoid fever. The public viewed the state's response as “careless and callous,” and accused the bureaucracy of withholding aid “until it had received ‘statistical proof’” of starvation.Footnote 45 Historians argue that the disastrous response set in motion “the conflict between the population and the regime” that would culminate in the revolution.Footnote 46
Mortality rates were higher in provinces with large religious minorities. State aid never reached some of the hardest-hit areas, with Astrakhan (only 50 percent Orthodox) receiving no assistance from the central government, despite its staggering death rates (see Figure 1).Footnote 47 Within provinces, mortality rates varied dramatically by religion. In Saratov, for example, the number of Muslim deaths increased by 61 percent, the number of Orthodox deaths by 40 percent, and the number of deaths among Western Christians by 34 percent. In Orenburg, Muslim deaths increased by 56 percent and Orthodox deaths by 36 percent.
Religious Demographics and Mortality in Provinces Affected by the Faminea
aScatterplot with linear regression line and 95 percent confidence interval.

I argue that incentives to supply aid depended on accurate information about the population in need of aid and on the ability of officials to ensure that food and seed loans would be repaid and future tax obligations fulfilled. The historical origins of state information asymmetries related to specific religious communities are considered below.
The Origins of Mediated Governance
Most members of the bureaucratic elite and the imperial family belonged to the Russian Orthodox Church, but just 69.3 percent of the empire's population was Orthodox in 1897. As the empire expanded, the tsars allowed many of their non-Orthodox subjects to follow their own customs and to be ruled by their own elites to minimize the costs of governance and the potential for unrest. The state relied on a form of indirect rule, “granting superior rights to its intermediaries and holding over their heads the threat of taking these rights away.”Footnote 48
This model of mediated governance was first applied to Muslims, who in 1897 made up the largest minority, at fourteen million people. The predominantly Muslim Kazan Khanate had been conquered in 1552. After a brief period of forced conversions and discrimination against the local elites, the autocracy co-opted the privileged classes of the Volga-Tatar society into the Russian hereditary nobility and retained much of the administrative and social status quo, including the Mongolian system of taxation known as iasak. Despite a shortage of labor, the Muslim population was spared from serfdom and conscription.Footnote 49 Still, the potential for unrest among this population remained high, as shown by its participation in popular revolts led by Stepan Razin (1670–71) and Emel'ian Pugachev (1773–75). To pacify the Muslim minority, Catherine the Great created the Tauride Mohammedan Ecclesiastical Board in Simferopol and the Orenburg Mohammedan Ecclesiastical Assembly in Ufa, headed by muftis. The assemblies were religious in form but carried out many administrative functions, including record keeping, arbitrating intracommunal disputes, and communicating imperial decrees.Footnote 50 Islamic clerics and scholars received privileged treatment in return for securing the loyalty of the Muslim peasants and containing unrest.
Starting in the eighteenth century, Protestants, Catholics, and Old Believers began to settle in the Volga basin. Catherine invited Europeans (mostly Germans) to colonize the Russian steppe, promising them abundant land, religious freedom, temporary exemption from taxes, and permanent exemption from military service. She hoped that the colonists would raise the region's economic productivity. The colonists’ main intermediary with the Russian state in the Volga region was the Saratov Office for the Guardianship of Foreign Settlers (the Kontora), established in 1766. Highly paid Kontora inspectors took great care of the colonists’ well-being and regularly interacted with officials in St. Petersburg.Footnote 51
The Old Believers were initially viewed as a threat and persecuted, and because they weren't considered a separate confession, they were ruled directly by the state. State policy toward this group varied from one tsar to the next, but was mostly discriminatory until the late nineteenth century. Peter the Great (1682–1725) profited from the Old Believers’ religious devotion by burdening them with a double poll tax in addition to the infamous beard tax.Footnote 52 Catherine the Great (1762–1796) encouraged their resettlement to a few designated regions to facilitate control and taxation.Footnote 53
Intergroup Differences in Legibility and Taxability
The imperial policy toward its “foreign confessions” changed substantially after the debacle of the Crimean War (1853–56). Russia sought to reform its institutions, modernize its military, and industrialize its economy. Serfdom was abolished in 1861 and beginning in 1864, zemstvos were created to manage local economic affairs. These local self-governance institutions, dominated by the nobility, received jurisdiction over the assessment and apportionment of land taxes; the provision of roads, schools, and hospitals; and the administration of fire insurance and famine relief programs. The regime also increased its control over the non-Orthodox population by standardizing tax obligations, introducing universal male conscription, and abolishing some intermediaries, such as the Saratov Kontora in 1870.
Muslim intermediaries were retained, but the central government intervened in their selection. Muftis, traditionally elected by the Muslim clergy, were appointed by the mvd after 1889. Beginning in 1888, mullah candidates were required to demonstrate proficiency in Russian and teaching Russian was mandated in Muslim schools. These interventions undercut the assemblies’ legitimacy among the local population and made Muslims suspicious of Orthodox officials. Protests against the reforms brought together hundreds of Muslim communes, and sometimes escalated into physical confrontation.Footnote 54 Muslim clerics began refusing to provide parish statistics on the pretext that their congregation had hidden the records. Zemstvo officials faced an increasingly hostile reception in Muslim settlements. Muslims feared that by signing the public declarations (obschestvennye prigovory) required by the zemstvos to receive food loans during bad harvests, they were unwittingly consenting to baptism.Footnote 55
The abolition of the Saratov Kontora brought colonists under the same administrative apparatus as the Orthodox peasants and Old Believers. The colonists resented losing their privileged status, but largely remained loyal to the tsar. To make up for the loss of the Kontora, they participated in the zemstvos and reportedly managed the budgets efficiently, implementing insurance and education programs and maintaining village granaries as per official mandates.Footnote 56
The Old Believers actually gained during the reform period, receiving more of the rights already held by other religious minorities with the passing of the 1863, 1874, and 1883 decrees.Footnote 57 Like the colonists, they engaged with the zemstvos, particularly by managing zemstvo schools.Footnote 58 Still, admission to government service, the army, and educational institutions remained limited for Old Believers.
These divergent governance strategies with regard to different confessions help to explain the variation in legibility and fiscal capacity across different religious groups on the eve of the famine. The quality of state information about Muslims, the only group still ruled indirectly, was lower than the quality of information about other minorities governed the same way as the Orthodox peasantry. I thus expect the state to channel less assistance to districts with larger Muslim populations. This pattern should hold regardless of actual needs in the aftermath of the harvest failure. I expect state treatment of the other non-Orthodox minorities to be less discriminatory, in light of their higher legibility and taxability.
This discussion also highlights the Muslim minority's greater potential for unrest and resistance to tsarist policies. It is thus possible that the state was responding not to lower legibility, but to a greater threat of rebellion in districts with larger Muslim populations. Relatedly, state famine policy could be linked to more subtle forms of resistance that raised the costs of tax collection and reduced informational capacity in Muslim communes in the first place. In this interpretation, illegibility is itself a product of non-coethnics’ defiance of state attempts to control and tax their communes.Footnote 59
Data and Level of Analysis
The territory of European Russia (the western and most populated part of Russia) was organized into fifty provinces (gubernia) that were subdivided into districts (uezd). I use data at the district level in the twenty-two provinces that received government assistance during the famine.Footnote 60 District is the smallest unit of analysis for which data exist; it's particularly relevant for studying the distribution of relief because district zemstvos were in charge of apportioning taxes, collecting data on peasant economies, evaluating local needs, and requesting famine relief from higher authorities.
Death and Birth Rates during the Famine
To evaluate the human consequences of the crop failure, I use data on births and deaths from a five-year period (1885–96) around the 1891 harvest failure from mvd Central Statistical Committee (csc) yearbooks. District-level births and deaths are aggregated for all religious groups. These totals are converted to crude birth and death rates per one thousand people; the denominator, district-year population, is interpolated using information from 1870 and 1897.Footnote 61 Figure 2 shows a sharper spike in mortality in 1892 in districts with an above-average (μ = 6.4) share of the Muslim population. The figure also shows that in nonfamine years, both mortality and natality were significantly lower in districts with above-average Muslim population shares; these demographic differences were due to more infant breastfeeding and lower alcohol consumption.Footnote 62
Birth and Death Rates by District in Provinces Affected by the Famine, with the Share of Muslim Population above and below the Mean

Famine Relief Indicators
Data on the relief operation come from the 1894 report of the Interior Ministry. The report describes the distribution of food and seed loans and cash payments to the rural population in provinces that received assistance from the central government in 1891/1892.Footnote 63 The report distinguishes between central relief—disbursed from the provincial food supply capital funds and the central fund for the empire as a whole—and local relief disbursed from district capital funds and subdistrict granaries.
The duration and scale of central relief, the key variables of interest for this study, are based on the following indicators. Months on relief refers to the number of months in which more than 1 percent of the rural population received public assistance.Footnote 64 Relief onset is coded as 1 for July 1891, 2 for August 1891, and so on up to 14 for August 1892. Average share of population on relief refers to the share of a district's peasant population that received public assistance in the form of food and seed loans or cash payments during the fourteen-month relief campaign (July 1891–August 1892). Average loan size is defined as the average amount of grain (in pudy) received per individual per month over the fourteen months of the relief campaign.Footnote 65 Because an overwhelming share of famine relief was delivered in kind, this variable captures the generosity of the authorities in allocating public assistance. State relief is defined as total relief from the central government per capita. In addition to state relief, I calculated the amount of local relief, disbursed from village granaries, as distinct from provincial and empire-wide funds.Footnote 66
To avoid multiple comparisons and to minimize measurement error, I use principal component analysis to reduce these indicators to a scalar index. The first principal component (mostly state aid indicators) explains about 50 percent of the variance, while the second principal component (mostly local relief) explains 19 percent (see section D.1 in the supplementary material).
Religion and Linguistic Differences
Data on religious affiliation in 1870 were published by the mvd csc.Footnote 67 The population is divided into eight confessional categories: Orthodox, Old Believer, Armenian Gregorian, Roman Catholic, Protestant, Jewish, Muslim, and Idolaters (idolopoklonniki). The main explanatory variables are share Muslim and share other non-Orthodox, which mostly combines Western Christians and Old Believers. Aggregating these groups is necessary because their numbers are smaller, especially in the provinces affected by the famine.
Supplementary analyses use data on key language groups from the 1897 census.Footnote 68 Numbers of Turkic speakers (Tatar, Bashkir, Turkmen, Kirgiz, Uzbek, Chuvash, Teptiar) and Russian speakers (Russian, Belarusian, Ukrainian) were used to create two variables: share Turkic and share other non-Russian. Under this alternative classification, the Old Believers are considered part of the Russian-speaking in-group and some Orthodox believers are coded as Turkic speakers.Footnote 69
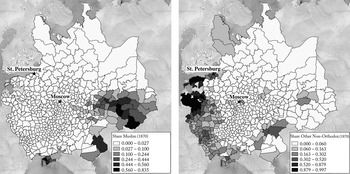
Figure 3 presents the spatial distribution of Russia's religious minorities.
Proportion of Muslims and Other Non-Orthodox Confessions in 1870, by District

Legibility and Tax Revenues
I consider two closely related dimensions of state capacity: information and revenue extraction. To measure informational capacity, I use the distribution of ages from the 1897 census.Footnote 70 The intuition is that age distributions follow a smooth curve, whereas errors in the age data reported in a census tend to produce heaping on specific numbers, typically those ending on the focal digits 0 and 5. The panel (a) of Figure 4, which depicts raw counts of age data, suggests considerable heaping on these focal digits between the ages of 30 and 80.
Frequency of Ages in Fifty Provinces of European Russia, Based on the 1897 Census and District-Level Distribution of the Myers Index

Two circumstances may give rise to age heaping: either people don't know their precise ages, or census enumerators have difficulty eliciting this information. Both factors were relevant in Russia at this time. Ignorance about exact ages was high among the peasantry, and there was widespread reluctance to cooperate with census enumerators; peasants may have feared that age data would be used to enforce conscription, or they simply refused to communicate with state officials. Muslims were particularly resistant to being counted. Religious intermediaries, tasked with conducting exploratory work ahead of the census and later recruited as enumerators, often withheld their cooperation after the state curbed their authority in the 1880s. In several provinces the military was even called in to help.Footnote 71 Under these circumstances, it's easy to imagine that enumerators reported inaccurate age data either because they deliberately misled the authorities or because they had to resort to guesswork in the absence of cooperation from the villages.
I quantify age heaping using the Myers index, which was developed by demographers. Because age heaping appears to be concentrated in the adult population, I exclude the youngest group (under fifteen years of age) and oldest (more than seventy-four years) in calculating the index. If ages are reported accurately, the proportion of the population with ages ending in each digit should make up 10 percent of the total; if ages are reported inaccurately, deviations from 10 percent are observed for some digits. These deviations were added up and the final sum was divided by two to compute the Myers index (for more detail, see the supplementary material). The index ranges from zero to ninety, where 0 indicates no age heaping and 90 indicates extreme age heaping (where all observed ages terminate on the same focal digit). The right panel of Figure 4 depicts the distribution of the Myers index across European Russia. The index is positively correlated with the share of Muslim population (ρ = 0.16, p < 0.05), negatively correlated with the share of other non-Orthodox minorities (ρ = −0.23, p < 0.05), and uncorrelated with the share of Russian speakers.
Because age heaping may depend on economic development and other factors, I condition on literacy, urbanization, remoteness, and economic welfare. I also use an additional indicator, direct taxes collected from peasant land in 1888–90, to capture a related, fiscal dimension of state capacity.Footnote 72 State and zemstvo alike levied taxes on peasant allotment (nadel'naia) land—that is, land set aside for the use of village communes under the terms of the emancipation settlement. Zemstvo and state revenues are combined to obtain the total tax receipts from peasant land in each district and standardized to obtain total tax receipts per unit land. Note that these figures represent not the official tax bill—that is, the amount of taxes owed on the basis of the land's assessed value—but actual receipts on taxes and arrears. I aggregate the annual tax receipts over the three prefamine years to account for idiosyncratic cross-sectional and temporal fluctuation in harvests.Footnote 73 Still, tax revenue fluctuates not only with state ability to gather information and to collect taxes, but also with local economic conditions, addressed by including covariates (see below).
Covariates
To account for the severity of the crop failure, I use data on the harvest (chistyi ostatok) of winter rye, spring rye, winter wheat, spring wheat, and oats, published by the mvd csc. These five crops were grown and consumed throughout the Russian Empire and suffered the most from the 1890/1891 weather anomalies. The unusually cold winter would have a greater effect on winter grains; spring and summer drought would harm the spring grains. The data on harvests are available for 1888–95 and are used in both temporal and cross-sectional analyses.
The remaining covariates are time invariant. Cross-sectional analyses of famine relief control not only for the 1891 harvest, but also for the 1891 drop in yields relative to the five-year average per unit land (1883–87).Footnote 74 I also measure distance between the district centroid and the nearest railway line in 1891, which affected aid delivery. And I control for the proportion of serfs in the district population in 1858, for the number of land captains per district area, and for the number of noble landowners per thousand people (in 1877), since during the famine the nobility was actively involved in providing food and credit to the impoverished peasants. Further, most local officials were recruited from the nobility, so a shortage of nobles would mean more vacancies and a larger number of officials unfamiliar with the region. Regressions control for urbanization as a proxy for economic development, which may be correlated with legibility and tax revenues as well as with state ability to deliver aid.Footnote 75
Different population groups may have differed in wealth, which could explain the variation in both taxation and access to state support. I account for this by controlling for the size of the peasant allotment and the number of horses owned per household, taken from the Cavalry Census of 1888–91. I also use data on the average height (in meters) of draftees into the army in 1883, which is correlated with nutrition and living standards.Footnote 76
I also control for the natural logarithm of population and area (in square kilometers), because larger, more populated regions are harder to govern. Cross-sectional estimations include geographic covariates as well: centroid latitude and longitude, their interaction, distance from St. Petersburg, and soil quality.Footnote 77 Specifications that examine the predictors of age heaping also control for male literacy in 1897.Footnote 78 Specifications that examine tax revenue condition on the average harvest in 1883–87 as well as on soil quality (both matter for economic productivity).
All models use province fixed effects to adjust for unobserved province-level characteristics. These include the incentives and abilities of the governors, who requested famine relief from the center and mediated between the zemstvos and the mvd.Footnote 79 The province dummy also accounts for differences between zemstvo and nonzemstvo provinces. Table A.1 in the supplementary material reports descriptive statistics on all variables.
Empirical Analysis
Famine Mortality
I first examine whether the consequences of the harvest failure varied with religious composition, interacting confessional makeup of the district with the famine dummy (coded 1 for 1892) and estimating two-way fixed-effects equations of the form,
 $$\eqalign{& {\rm m}_{{\rm it} + 1} = {\rm \beta }_1( {{\rm religio}{\rm n}_{\rm i} \times {\rm famin}{\rm e}_{\rm t}} ) + {\rm \beta }_2{\rm harves}{\rm t}_{{\rm it}} + {\rm \beta }_3( {{\rm harves}{\rm t}_{{\rm it}}}\cr &\hskip33pt {\times}\, {\rm famine}_{\rm t} ) + {\rm X}_{\rm i} \times {\rm famin}{\rm e}_{\rm t} + {\rm \gamma }_{\rm i} + {\rm \tau }_{\rm t} + {\rm \epsilon }_{{\rm it}}, }$$
where mit+1 is the crude death or birth rate in district i and year t + 1; religioni is the population share of a given religious group; faminet is a dummy variable that equals 1 for year 1892 (or for both 1892 and 1893, see the supplementary material); harvestit is per capita grain output; Xi are remaining district covariates, which vary by model and are interacted with the famine dummy; and γi and τt are vectors of district and year fixed effects, respectively.
Table 1 reports the baseline results from specifications that include grain output in year t, an interaction between grain output and the famine year,Footnote 80 and an interaction between the famine year and the share of urban population, since the famine was a rural phenomenon. The famine × share non-Orthodox interaction term is significant in all estimations, indicating both higher mortality and lower natality in districts with larger religious minorities during the crop failure. In substantive terms, one standard deviation increase in the share of non-Orthodox population (equivalent to 17 percent) predicts 2.3 more deaths and 1.2 fewer births per one thousand. Models 2 and 5 disaggregate the non-Orthodox group into Muslim and other minorities. The analysis indicates that one standard deviation increase in share Muslim (equivalent to 15 percent) predicts an increase in the number of deaths by 1.8 and a decrease in the number of births by 1.1 per thousand people in 1892. As the differences in birth and death rates by religion are imputed from aggregate district data, these estimates may be too low. Even so, they are substantively meaningful. In nonfamine years, the crude death rate among Muslims typically was within the range of twenty-five to thirty-five per one thousand and the crude birth rate was within the range of forty to fifty. The coefficient on the interaction term for other non-Orthodox populations is also significant, but smaller in substantive terms. One standard deviation increase in share other non-Orthodox (6 percent) predicts an increase in deaths by 1.3 per one thousand and decrease in births by 0.5 (models 2 and 5). Models 3 and 6 examine linguistic cleavages: only the interaction between Turkic speakers, who were predominantly Muslim, is statistically significant. One standard deviation increase in the share of Turkic speakers (18 percent) predicts an increase in deaths by 1.5 and decrease in births by 1.1 per one thousand, slightly lower estimates than those obtained for share Muslim. The presence of other non-Russian-speaking groups doesn't predict mortality or natality. To verify that these results aren't driven by the underestimation of standard errors due to spatial and temporal correlation, I estimate Conley standard errors in Table A.4 in the supplementary material, allowing for correlation of nine hundred kilometers.
Religion, Language, and District-Level Mortality and Natality during the Faminea

*p < 0.1, **p < 0.05, ***p < 0.01; standard errors clustered at the district level
a All models are OLS with district and year fixed effects. Data are from twenty-two provinces affected by the harvest failure and receiving relief. These are baseline specifications without additional covariates.
As a robustness check, Table A.5 in the supplementary material presents results with additional covariates that may affect mortality and religious demography (interacted with the famine dummy): the distance to St. Petersburg and the railroad, the proportion of serfs before emancipation, the average height of recruits, the number of noble landowners, the number of land captains, and the number of horses per household. The coefficients on interactions between share non-Orthodox and share Muslim with the famine year are consistent with the baseline specifications in Table 1, although the coefficient is slightly attenuated for birth rates. The coefficient on famine × other non-Orthodox is no longer statistically significant in any of the models. An alternative, language-based classification of the population confirms the results in Table 1: famine × share Turkic predicts higher mortality and lower natality, but the estimate is smaller and less precise; the presence of other non-Russian population groups doesn't predict the outcomes.
Adding too many variables that are collinear increases the risk of overfitting and false discovery. To reduce researcher discretion in variable selection, I implement the double-selection method.Footnote 81 This approach selects relevant covariates based on their ability to predict both treatment (famine × share Muslim) and outcome, and retains variables only with nonzero coefficients. The results (shown in Table A.8 in the supplementary material) remain robust to this analysis. Additional specifications include the famine dummy interacted with latitude, longitude, and their interaction in Table A.6; the estimates vary slightly but the key interactions remain significant. In Table A.7, I interact share Muslim with the year indicator. The interactions are positive (negative) and statistically significant for death (birth) rates for 1892 and 1893, two years after the 1891 harvest failure, but not for other years. I also consider an alternative coding of the famine years, with both 1892 and 1893 coded as 1. In this estimation (shown in Table A.3), the coefficient on famine × share Muslim increases in magnitude, while the coefficient on famine × share other non-Orthodox decreases. In sum, the famine was more devastating in districts with a greater share of Muslims. Muslim presence predicts higher mortality and lower natality, whereas the estimates for other religious groups or linguistic cleavages are less robust.
Province data disaggregate Muslim and Orthodox deaths, supporting the conclusion that Muslims fared worse during the famine (see Table A.2). In Kazan, Muslim mortality increased by 67 percent from 1891 to 1892, while Orthodox deaths rose by 22 percent; in Simbirsk, Muslim mortality rose by 75 percent, while Orthodox mortality rose by 24 percent; and in Astrakhan, Muslim deaths increased by 90 percent and Orthodox deaths by 71 percent.
Relief Campaign
The greater human toll in districts with greater Muslim presence suggests a more acute need for state relief. Did religious demography influence the allocation of public assistance?
In Table 2, I regress the first principal component, which corresponds to the generosity of relief by the central government, as well as separate indicators of relief on the share of the Muslim population, the share of other non-Orthodox population groups, and covariates. Standardized coefficients on key explanatory variables are plotted in Figure 5. The coefficient on share Muslim is negative and statistically significant for the first component of relief; one standard deviation increase in share Muslim (15 percent) predicts a decrease in this outcome by one quarter of a standard deviation, which is twice as large as the predicted effect of the 1891 drop in yields and exceeds most other covariates in magnitude.
Standardized Coefficients on Share Muslim and Share Other Non-Orthodox in Regressions of Various Indicators of Famine Relief from Table 2a
a Point estimates represent changes in each outcome equivalent to one standard deviation increase in each variable. Lines represent 95 percent confidence intervals.

Religious Composition of the Population and Main Relief Indicatorsa

*p < 0.1, **p < 0.05, ***p < 0.01; heteroskedasticity-robust standard errors in parentheses
a All models are OLS with province fixed effects. The first principal component (model 1) combines five relief measures: months on relief, relief onset, average loan size, population on relief, and total state aid. Models also include the following covariates: share urban, average land allotment, average recruit height, ln(railway distance), land captains per area, ln(distance to St. Petersburg), serfdom, horses per household, noble landowners per 1000, black soil, area, ln(population), longitude, and latitude, and their interaction.
It's also informative to examine separate relief indicators. Muslim presence predicts the onset and duration of the relief campaign as well as the size of the average monthly loan. One standard deviation increase in share Muslim predicts an approximately twenty-day delay in the delivery of food loans and a reduction of the relief campaign by almost one month (μ = 8, σ =3.28). These estimates are comparable to the effects of one standard deviation increase in the 1891 harvest. One standard deviation increase in share Muslim (15 percent) corresponds to a decrease in aid by 0.05 pud, or 0.8 kilograms (μ = 0.42, σ = 0.22). The standardized coefficient on share Muslim is twice as large as the coefficient on harvest pc 1891 and three times as large as the coefficient on harvest drop. The qualitative section unpacks this aggregate result further by showing that in some districts, loans for Muslims were set to half the size of loans for Orthodox peasants. The coefficient on share Muslim is negative but doesn't reach significance for the other two indicators.
By contrast, the coefficient on share other non-Orthodox changes signs across models, indicating more generous relief for some indicators and less generous relief for others.
Table A.11 in the supplementary material uses the same specifications but codes groups by language rather than religion. Language doesn't predict the generosity of state relief as consistently as religious cleavages do.
Figure 6 examines the sensitivity of the coefficient on share Muslim to unobserved confounding. The distance to the line indicates that the unobserved confounder, such as poverty, would have to be many times more powerful than the observed confounders, including ln(distance to the railway), harvest drop, serfdom, and harvest pc 1891, selected for their high explanatory power.
Sensitivity of the Effect of Share Muslim to Unobservables Based on Table 2, Model 1a
a The y-axis represents the effect of the confounder on principal component 1; the x-axis represents the effect of the confounder on share Muslim. The dashed line represents threshold for the covariate to reduce the treatment effect by half. Select observed covariates are plotted as benchmarks; the closer to the line, the more powerful the covariate.

In sum, districts with a larger Muslim minority (but not other non-Orthodox groups) were disadvantaged in the allocation of famine relief. They received smaller loans, and the relief campaign started later and lasted for a shorter time. Religious differences are stronger predictors of relief than are linguistic differences.
Understanding the Mechanisms
I hypothesize that greater information asymmetries and lower state revenues explain the less generous assistance in districts with a higher share of Muslims. If this is the case, the share of Muslims (but not of other minorities) should predict higher age heaping and lower prefamine tax revenues. In turn, both age heaping and taxes should predict famine relief, conditional on harvest. Alternatively, if officials are motivated by prejudice alone, Muslims should be disadvantaged not only in relief transfers, but also in taxes. The analysis presented below is more exploratory, given that legibility is measured indirectly, using postfamine data on ages.
Figure 7 shows that age heaping increases and tax revenue decreases with share Muslim. Analyses in Table 3 investigate the robustness of these relationships to conditioning on the distance to St. Petersburg and the railway, as well as on urbanization (proxies for development and accessibility), literacy (relevant for age heaping), average harvest and soil quality (most relevant for tax revenue), past incidence of serfdom, and several proxies for poverty (average recruit height, land allotment size, and horses per household). Model 1 indicates that a 15 percent increase in share Muslim corresponds to an increase in Myers index by 1.78 (μ = 15.02, σ = 4.06). This is a substantively meaningful difference: the (standardized) coefficient on share Muslim is twice as large as the coefficient on serfdom and 2.5 times larger than the coefficient on literacy. A 15 percent increase in share Muslim also predicts a decrease in tax revenues per unit of land by 0.46 rubles per desiatina Footnote 82 (μ = 4.37, σ = 2.13). The coefficient on share Muslim in model 3 is as large as the coefficient on soil quality and almost twice the size of the coefficient on average harvest when standardized.
Religion, Language, and State-Capacity Indicatorsa

*p < 0.1, **p < 0.05, ***p < 0.01; heteroskedasticity-robust standard errors in parentheses
a All models are OLS with province fixed effects. Models also include the following covariates: average harvest 1883–87, share urban, average land allotment, average recruit height, male literacy in 1897 (models 1 and 2 only), ln(railway distance), ln(distance to St. Petersburg), serfdom, horses per household, noble landowners per 1000, black soil, area, ln(population), longitude, and latitude, and their interaction.
District-Level Bivariate Relationship between Share Muslim and Informational and Fiscal Capacity

The share of other non-Orthodox minorities or linguistic differences (share other non-Russian and share Turkic) are not significant predictors of legibility or tax revenues, consistent with the analysis in the previous section. Model 5 in Table 3 shows that one standard deviation increase in the Myers index corresponds to a 0.32-ruble decrease in tax revenue. The coefficient on Myers index is twice as large as the coefficient on serfdom.
Next, I examine whether legibility and fiscal capacity predict famine relief. Results from Table 4 are summarized for standardized coefficients on share Muslim and share other non-Orthodox in Figure 8. The analysis supports the argument that legibility and the corresponding taxability of different population groups influenced the allocation of relief. The government was more generous in districts that were more legible (that is, those with lower Myers index) and that generated greater fiscal revenue. Myers index predicts the aggregate indicator of relief (principal component 1), the duration of the relief campaign, and the size of food loans; it is positive (as expected) but imprecisely estimated for the month of relief onset. Myers index doesn't predict total state aid or the size of the population on relief—the two outcomes for which share Muslim is insignificant. For principal component 1, the standardized coefficient on Myers index is slightly lower than the coefficient on harvest pc 1891 and 2.5 times the size of the coefficient on serfdom. One standard deviation increase in Myers index corresponds to a reduction in the average bread loans by one quarter, exceeding all other coefficients in the model.
Relationship between Legibility and the Provision of Relief, and Relationship between Tax Revenues and the Provision of Reliefa

*p < 0.1; **p < 0.05; ***p < 0.01; heteroskedasticity-robust standard errors in parentheses
a All models are OLS with province fixed effects. The first principal component model 1 combines five relief measures: months on relief, relief onset, average loan size, population on relief, and total state aid. Models also include the following covariates: share urban, average land allotment, average recruit height, ln(railway distance), ln(distance to St. Petersburg), serfdom, horses per household, noble landowners per 1000, black soil, area, ln(population), longitude, and latitude, and their interaction.
Standardized Coefficients on Myers Index (Higher Values Mean Lower Legibility) and Tax Revenue in Regressions of Various Indicators of Famine Relief, Based on Models in Table 4 with a Full Set of Covariates and Province Fixed Effectsa
a Point estimates represent changes in each outcome equivalent to one standard deviation increase in Myers index or tax revenue. Lines represent 95 percent confidence intervals.

As expected, tax receipts in the prefamine period predict higher values of principal component 1 and separate relief indicators, including the indicators for which share Muslim was insignificant. One standard deviation increase in tax revenue (σ = 2.13) corresponds to a decrease in the duration of the relief campaign by almost a month (0.89), a delay in relief onset by 0.66 months, and a reduction of the average bread loan by 0.06 pud, or 1.05 kilograms (μ = 0.42, σ = 0.22).
To the extent that informational capacity rather than prejudice determines fiscal payoff, legibility and tax revenues should affect famine relief even in districts with a negligible Muslim population. To investigate this, I repeat the analysis using a subset of districts where share Muslim is below the median of 0.0000948. The coefficient on Myers index remains negative and significant—that is, less-legible, non-Muslim districts received less-generous famine relief. The results are similar for taxes to land but the coefficient doesn't reach significance (N = 67) (see Table A.12 in the supplementary material). This indicates that it was the underlying state capacity, rather than ethnic prejudice as such, that shaped the distribution of aid. Furthermore, if Muslim presence matters primarily because it reduces state informational capacity and fiscal payoff, a district's religious composition should reduce relief only in districts with low state capacity. Figure A.3 in the supplementary material suggests that this is the case: the negative relationship between share Muslim and relief holds only at below-average legibility and taxes.Footnote 83
The null findings for non-Muslim religious minorities and for linguistic differences are also informative with respect to the prejudice explanation. The Old Believers were more legible, generated considerable tax revenues, and on the whole were not disadvantaged in the receipt of state aid, even though they were persecuted for their beliefs and treated unfairly in other domains. Furthermore, not all non-coethnics were disadvantaged. While the share of Muslims predicts discrimination in relief and legibility, the share of Turkic speakers (who converted to Orthodoxy but retained their language) or other non-Russians does not.
An alternative explanation for these patterns is the presence of more unrest in Muslim-dominated districts. Although the threat of unrest has been argued to increase public goods provision in autocracies, it's also possible that the government stayed away from restive districts altogether or denied them aid during the famine. Scholars of Imperial Russia argue that religiously heterogeneous districts posed a greater threat of rebellion, which reduced peasant representation in zemstvos and limited redistributive policies.Footnote 84 Share Muslim doesn't predict peasant protest in the decade before the famine or during the abolition of serfdom, nor does unrest predict legibility or tax revenue (see Table A.13 in the supplementary material). Still, the possibility remains that state policy was influenced by subtler or Muslim-specific forms of resistance not captured in these data. In a way, the state agents’ inability to extract revenue—and, more broadly, information—can be interpreted as Muslim resistance to imperial rule.
Qualitative Evidence
To provide qualitative evidence on the mechanisms tested above and to address the problem of ecological inference that arises from imputing differences in the treatment of Muslims from the analysis of religiously mixed districts, I draw on proceedings (zhurnaly) and reports (otchety, doklady) of the district and provincial zemstvos and food supply commissions. I also consult archival materials pertaining to the organization of the relief campaign in Kazan, Samara, and Simbirsk provinces, all of which had sizable Muslim populations.Footnote 85
First, the records highlight the difficulties in gathering reliable information about harvests and peasant needs. On the eve of the famine, the zemstvos in Kazan and Samara encountered particular challenges when surveying the Muslim population. Reportedly, members deliberately misled zemstvo officials for “fear that they might be baptized or evicted.” Muslim distrust was “so great that in some villages it was necessary to abandon the census.”Footnote 86 Some Muslim communes refused to be surveyed because it would “lead to higher taxes.” The population in Sultangulov Volost (Buguruslan district) had to be visited three times; the locals agreed only after they visited a neighboring locality to observe zemstvo work there.Footnote 87 Zemstvo officials also noted that whereas German peasants provided accurate information, the information from Old Believers was less trustworthy than that received from the Orthodox peasants. The officials remarked that literacy didn't guarantee “truthfulness.”Footnote 88
Inadequate information about local economies, in turn, complicated tax assessment and reduced fiscal payoff. In 1888, the Buzuluk zemstvo board (Samara province) discussed tax arrears and lamented that peasants (ethnicity unspecified) were still repaying the food and seed loans granted after the poor harvests of 1873 and 1880. The board favored petitioning the tsar to extend the loan repayment period because of the difficulties in collecting the arrears, and expressed skepticism that additional loans would be repaid.Footnote 89 One official questioned the need for providing seed loans to Bashkirs [Muslims] because the loan “would not be used for its intended purpose, since the Bashkirs there are generally bad landowners.”Footnote 90 Similarly, the Buguruslan zemstvo complained in 1888 that some Muslim communes had paid no taxes for six years, and asked the governor to allow bailiffs to accompany the zemstvo officials and facilitate collecting the arrears.Footnote 91 Another source notes, “Being bad farmers, Tatars [Muslims] are bad taxpayers. The indebtedness of the Tatar population … is enormous and significantly exceeds the indebtedness of other groups in the region.”Footnote 92 In Saratov, for instance, the arrears of the Orthodox peasants stood at 2.95 rubles per household in 1885, whereas the arrears of the Muslim population reached 65 rubles per household.Footnote 93
Monitoring the distribution of relief was particularly important during the famine. In Simbirsk, concern that aid wasn't reaching its target led the provincial zemstvo, in September 1892, to discuss alternative ways of distributing relief. The chairman of the provincial board admitted that “the genuinely needy did not receive enough [loans], while those with less urgent needs received [them] in excess.”Footnote 94 The zemstvo was especially concerned about misallocation of aid in the district of Buinsk, which had a large Muslim minority (36 percent). Buguruslan zemstvo (Samara province) stressed the importance of giving seed loans only to persons “who had land prepared for winter sowing,” and asked land captains to help monitor that the loans were “used for their intended purpose.”Footnote 95 Similar concerns about monitoring how loans were used were raised in Kazan province.Footnote 96
Zemstvos lacked the police power that would have allowed them to compel village communes to maintain their grain reserves in good order. Instead, they mostly relied on the rural population's quasi-voluntary compliance. To distribute food and cash loans among its members, a commune had to draw up a declaration (prigovor) specifying the beneficiary and the amount; the local (volost’) administration would then verify the declaration and the district zemstvo board would authorize it. This was no easy task in Muslim communes: the records had to be kept in Russian, and the requirement that villagers sign documents of unknown content incited fears of baptism, as noted above.Footnote 97
Second, zemstvo records confirm the main statistical finding: Muslims received less aid during the famine. The size of a loan was sometimes explicitly tied to the recipient's identity. In Buguruslan district (Samara), loans granted to Muslims were half the size of those granted to the Orthodox peasants, at sixteen pounds (or funty, equivalent to 6.6 kilos) of grain per person per month. Officials justified this by “the huge indebtedness […] for food loans given in previous years, incorrect universal requests for food loans at the present time, and […] the custom of eating horse meat, which is now extremely cheap.”Footnote 98 In late 1891, given the desperate situation, the Buguruslan zemstvo increased the loan size to thirty-two pounds, but this policy didn't take effect until February 1892.Footnote 99 Monthly loans granted to Muslims in Stavropol district (Samara) were initially set at twenty pounds per recipient, half the size of loans to non-Muslims.Footnote 100 In Novouzensk district (Samara), the zemstvo also initially decided to issue half rations to Muslims, but increased the rations in response to petitions.Footnote 101
Some officials were clearly motivated by prejudice. They questioned the needs of the Muslim communes, believing that “Tatars” [Muslims] exploited state generosity and suffered due to laziness. During the October 1891 session of the Samara provincial zemstvo assembly, a deputy argued that Muslims sold their grain immediately after the harvest in order to qualify for zemstvo loans.Footnote 102 Similarly, the zemstvo board of Spasskii district (Kazan) claimed that food loans had a “corrupting moral influence on the population, particularly the Tatars,” drawing attention to the latter's heavy indebtedness.Footnote 103
Yet much of the discussion focuses on high arrears, difficulties in securing the repayment of future loans, and other budgetary considerations. The Kazan provincial zemstvo board argued—with respect to peasants of all faiths—that “in view of the excessive debt of the population on food loans, the requirements for new food loans should be treated with the utmost caution, limiting them to cases of disasters and indisputable need.”Footnote 104 District zemstvos often invoked budgetary concerns when requesting aid from the central government. In Spasskii district (Kazan), the zemstvo noted that failing to provide assistance in 1892 would “create an artificial famine in 1893 and 1894” and result “in a heavy burden on the funds of the state.”Footnote 105 Relief was seen as ensuring that the fields were planted, which was necessary for future tax revenues and grain exports.
It seems that local officials used religion as a heuristic for tax-paying capacity because they lacked reliable information about peasant living standards, and Muslims were ipso facto less legible and less willing to pay up. It wasn't so much the poverty of the Muslim population that was to blame. Rather, in the words of the Stavropol district zemstvo's Audit Commission (Revizionnaia Komissia), it was the zemstvo's inability “to take any decisive measures” against the Muslims, which meant that the zemstvo was “forced to assist this population during poor harvests without any hope of repayment of the loans issued, which burdens the budget of the zemstvo and other taxpayers.” Indeed, the Commission pointed out that Muslims were the most recalcitrant payers, despite possessing “huge, in comparison with the rest of the population, land allotments.”Footnote 106
The “decisive measures” the Stavropol Audit Commission had in mind may be discerned from the zemstvo's 1888 petition to the mvd. The petition asked the authorities to compel indebted Tatar communes to rent out their excess allotment land and use the proceeds to pay down arrears in taxes and contributions to the food supply fund. As an alternative, villages in arrears could set aside land for communal tillage “in such a quantity and for as long a term as the Zemstvo Board deems necessary to liquidate the arrears.”Footnote 107 The provincial zemstvo in Samara observed “a stubborn unwillingness” to comply with this requirement among the Muslim population, which despite “really needing and demanding a loan, resolutely refused to accept communal tillage.”Footnote 108
The communal tillage requirement was designed to ensure adequate grain storage for future harvest failures and prompt repayment of grain loans from the state. The Muslims’ refusal to comply delayed the arrival of relief. In Samara district, for example, it wasn't until February 1892 that most Tatar villages finally agreed to introduce communal tillage and consequently began receiving food and seed loans. Even then, one village continued to hold out.Footnote 109
The fiscal rationale was also central to the response of the central government. The Finance Ministry pressured zemstvos to hold the line on requests for aid and keep loans to a minimum. The ministry dragged its feet on banning grain exports, worried about the fiscal impact of the ban. It waited until mid-August to ban rye exports, and then only at a few ports at a time. The main export crop, wheat, was exported until November 3rd.Footnote 110
The Interior Ministry (mvd) likewise distrusted local requests for aid and sent its own agent to gather additional information. The agent's telegrams to St. Petersburg called for a sharp reduction in the estimates of need and recommended “extreme caution in the disbursal of relief monies.” Distrusting zemstvo figures, the agent sometimes brought in local tax collectors.Footnote 111 The mvd insisted that the provinces affected by famine must “cover a part of their needs with … [the local] supplies,” which explains the zemstvos’ emphasis on communal tillage as a precondition for loans.Footnote 112
mvd circulars frequently mention tax collection. In August 1891, a circular issued to provincial governors emphasized the need to gather accurate information before suspending the collection of taxes and arrears; it suggested that deferment apply only to redemption payments and not to regular taxes, “lest the state lose revenue.” The mvd cautioned that some communes might be able to fulfill their fiscal obligations even when the harvest fails.Footnote 113
To summarize, zemstvo records confirm the main statistical finding: Muslims were often underserved in the provision of famine relief. This wasn't due to prejudice alone, although anti-Muslim sentiment was indeed widespread. Fiscal considerations and information asymmetries figure prominently as motivations in their own right. Muslim communes presented greater challenges than Orthodox communes to officials who were responsible for tax and debt collection. State agents’ inability to enforce communal tillage mandates and to monitor how loans were used meant that the fiscal payoff from assisting Muslims was lower than the fiscal payoff from assisting other population groups. These local incentives were in line with the central policy of minimizing expenditure and ensuring a steady stream of tax revenue—even during the famine.
Conclusion
States rarely treat all citizens equally. This article shows that one of the largest famines in Russia's history brought higher mortality and lower natality to districts with a larger Muslim population. At the same time, relief from the central government arrived in these districts later, lasted for a shorter period, and was less plentiful.
I argue that this pattern in the distribution of relief can be explained, in part, by greater information asymmetries with regard to the Muslim minority. State agents diverted famine relief away from groups that were difficult to monitor and tax and channeled it toward the more legible population, with the goal of maximizing revenues. Statistical analysis confirms that prefamine tax receipts decreased, while age heaping—a proxy for informational capacity—increased with the share of Muslims, but not with the share of other minorities. Legibility and tax revenue, in turn, predict the generosity of relief. Zemstvo reports support this interpretation, although they also highlight the prevalence of prejudice against Muslims. Local officials neglected the Muslims’ welfare because they didn't expect this minority group to repay state loans and pay tax arrears.
Politicians and bureaucrats often lack institutional capabilities to translate their preferences into policy outcomes when interacting with ethnic and religious minorities, whether or not they're motivated by electoral considerations, out-group prejudice, or revenue maximization. This argument implies that non-coethnics are disadvantaged in some domains of distributive politics because they benefit from low state capacity in others. The flip side of state discrimination against minorities in the distribution of resources is that when it comes to raising tax revenue and conscripts, state agents rely more heavily on coethnic areas where they have more reliable intermediaries or more direct access.
I emphasize the implications of legibility for state responsiveness during hard times, but the argument draws on equilibrium dynamics. In a longer period, discrimination by administratively weak states is both a cause of legibility and an effect. When ethnic minorities are illegible, state officials can't verify their needs or ensure that invested resources will pay off in the future, which lowers the incentives of officials to invest in minority-dominated areas. The resulting discrimination by the state further reduces minorities’ willingness to comply with taxation and other state obligations.
The theory is most applicable to states that have limited electoral accountability, are concerned with extracting maximum revenue from their populations, and lack easy access to rents from natural resources. Imperial Russia wasn't unique in seeking to maximize fiscal returns; many other colonial powers set up institutions to extract resources from the governed populations through excessive taxation, along with outright economic exploitation and plunder.Footnote 114 Maximizing revenue motivated the British in Bengal and Kenya, the Spanish Crown in the Americas, and the Belgians in the Congo.Footnote 115 The need for revenue only increased in times of war.Footnote 116 For instance, Alexander Lee shows that local intermediaries were incorporated in governance when the empire was militarily and financially secure, but not in times of European war, when fiscal pressures were higher and direct rule was preferred.
In an agrarian empire, harvest failures were closely tied to state revenues. The 1891/1892 famine occurred at a time when Russia faced immense pressure to increase state revenues and modernize its economy to remain competitive with the other great powers. The related objectives—maximizing domestic tax revenues and increasing grain exports—were needed to finance state-led industrialization and military modernization. Correspondingly, Russia embarked on a series of reforms to eliminate religious intermediaries and to standardize tax obligations across groups. In the years leading up to the famine, Russia imposed new duties on imports and increased excise taxes on basic consumer goods to encourage the sale of grain. During the famine, food and seed loans were supplied not only to help hungry peasants, but also to ensure that fields would be planted and taxes paid in the next harvest season. In this regard, the relief campaign of 1891/1892 succeeded: the long-term economic damage wrought by the crop failure was minimal.Footnote 117
Supplementary Material
Supplementary material for this article can be found at https://doi.org/10.1017/S004388712100023X.
Data
Replication files for this article can be found at https://doi.org/10.7910/DVN/Q4DMKK.
Acknowledgments
The author thanks Devin Caughey, Wenyan Deng, Evgeny Finkel, BreAnne Fleer, Nikhar Gaikwad, Yossi Harpaz, In Song Kim, Jeong Hyun Kim, Iacob Koch-Weser, Evan Lieberman, Avital Livny, Brendan McElroy, Richard Nielsen, Pavithra Suryanarayan, Ariel White, Jennifer Widner, and Bernardo Zacka, as well as three anonymous reviewers and the editors of World Politics. Nasir Almasri, BreAnne Fleer, and Ramil’ Gaptrakhimov provided excellent research assistance for this project. The article benefited from prior collaborations with Brendan McElroy. Helpful feedback on earlier versions of the project was provided by participants of the 2019 Summer Workshop in the Economic History and Historical Political Economy of Russia, at the University of Wisconsin-Madison; the Comparative Politics Workshop at Northwestern University; the Hudspeth Lecture Series at Rice University; the Politics Workshop at the University of Illinois, Urbana-Champaign; the Pittsburgh Online Historical Political Economy Workshop; the George Mason Public Choice Seminar Series; Boston University's Political Science Speaker Series, and the Conference on State Capacity and Public Goods Provision at Princeton University.