Introduction
Marine population connectivity, understood as the exchange of individuals among geographically separated groups (Cowen et al., Reference Cowen, Gawarkiewicz, Pineda, Thorrold and Werner2007; Pineda et al., Reference Pineda, Hare and Sponauge2007; Cowen and Sponaugle, Reference Cowen and Sponaugle2009) or discrete populations (Lowe and Allendorf, Reference Lowe and Allendorf2010), plays a fundamental role in the spatial configuration of species, their persistence over time, maintenance of genetic diversity, and, finally, in determining their evolutionary fates (Lowe and Allendorf, Reference Lowe and Allendorf2010). Despite the importance of knowledge regarding marine species connectivity, it is difficult to assess connectivity in species with benthic adults and planktonic larvae as the main dispersal element. For these species having planktonic larval development, a large number of produced larvae per individual during reproductive events and the small larval size make it almost impossible to directly survey larval movement between populations (Levin, Reference Levin2006; Cowen et al., Reference Cowen, Gawarkiewicz, Pineda, Thorrold and Werner2007; McQuaid, Reference McQuaid2010).
Different approaches have been developed to quantify this process, including the use of genetic variability (Palumbi, Reference Palumbi2003; Hellberg, Reference Hellberg2009; Lowe and Allendorf, Reference Lowe and Allendorf2010; Gagnaire et al., Reference Gagnaire, Broquet, Aurelle, Viard, Souissi, Bonhomme, Arnaud-Haond and Bierne2015; Veliz et al., Reference Veliz, Rojas-Hernández, Fibla, Dewitte, Cornejo-Guzmán and Parada2021, Reference Veliz, Rojas-Hernández, Vega-Retter, Zaviezo, Garrido and Pardo2022) and biophysical modelling (Lett et al., Reference Lett, Verley, Mullon, Parada, Brochier, Penven and Blanke2008). The use of genetic markers allows to describe the extent of the marine populations (Cowen and Sponaugle, Reference Cowen and Sponaugle2009), the dispersal potential of the species (Kinlan and Gaines, Reference Kinlan and Gaines2003), and the asymmetry of the migrant interaction between pairs of groups (e.g., Meerhoff et al., Reference Meerhoff, Yannicelli, Dewitte, Díaz-Cabrera, Vega-Retter, Ramos, Bravo, Concha, Hernández-Vaca and Veliz2018). Biophysical modelling studies estimate the number of larvae exchanged among populations based on the trajectories inferred from the model velocity field (e.g., Endo et al., Reference Endo, Gherardi, Pezzi and Lima2019), the importance of populations in releasing and receiving larvae (e.g., Crochelet et al., Reference Crochelet, Barrier, Andrello, Marsac, Spadone and Lett2020), and also enable an estimation of auto-recruitment (e.g., Santos et al., Reference Santos, Nieblas, Verley, Teles-Machado, Bonhommeau, Lett, Garrido and Peliz2018).
Due to their isolation, oceanic islands and their endemic fauna are interesting models for quantifying connectivity (Andrade and Feng, Reference Andrade and Feng2018). First, it is possible to obtain samples for the entire geographical range of these species; thus, the noise produced by unsampled populations (see Excoffier and Heckel, Reference Excoffier and Heckel2006) is reduced to zero, although recirculation patterns at the fine scale (sub to mesoscale) nearby the island can be influenced by the island itself (i.e., island mass effect) (Barton, Reference Barton, Steele, Thorpe and Turekian2001).
The easternmost islands in Polynesia are composed of Eastern Island (EI) and Salas & Gomez (SG), the first inhabited and the second not inhabited by humans. The Chilean government created Motu Motiro Hiva Marine Park (150,000 km2) close to SG, representing the largest fishing exclusion zone in the Americas (Friedlander et al., Reference Friedlander, Ballesteros, Beets, Berkenpas, Gaymer, Gorny and Sala2013). These islands are separated by 415 km from each other (Zylich et al., Reference Zylich, Harper, Lidandeo, Vega, Zeller and Pauly2014); the next closest islands are the Desventuradas (2000 km east) and Pitcairn (2600 km west) Islands. Both islands share most marine fauna, comprising 30–34% of endemic species (Fernandez et al., Reference Fernández, Pappalardo, Rodríguez-Ruiz and Castilla2014; Swearer et al., Reference Swearer, Treml and Shima2019); in the case of molluscs, 42% of the species have been found to be endemic to these two islands (Rehder, Reference Rehder1980), and the oceanographic patterns of the area show circulation corresponding to the anticyclonic rotation of the South Pacific, conditioned by a system of flows-counterflows and the average geostrophic current in the zone (Pollock, Reference Pollock1992; Rivera and Mujica, Reference Rivera and Mujica2004). Near the coast of EI, the geostrophic flow includes vertical and horizontal shears, which, combined with the vertical migration behaviour of fishes larvae, promote larval retention (Meerhoff et al., Reference Meerhoff, Ramos, Yannicelli, Bravo, Zambra and Varela2017).
These islands are inhabited by the endemic cowry gastropod Monetaria caputdraconis (Melvill, 1888), which has cultural and economic importance, referred to as ‘pure’ by the islanders. This species is abundant in shallow areas, where it has ecological significance as a herbivore (Osorio et al., Reference Osorio, Jara and Ramirez1993). M. caputdraconis is a dioecious species with internal fertilisation; eggs are deposited in capsules attached to rocks, and planktonic veliger larvae then develop after 7 days of incubation (Osorio and Gallardo, Reference Osorio and Gallardo1992); these planktonic larvae last approximately two weeks in the plankton (Osorio, personal communication). M. caputdraconis has historically been under exploitation both as a food resource and as an ornamental object (Seaver, Reference Seaver1986), leading to a significant decrease in its abundance (Rivera, Reference Rivera2003; Aburto et al., Reference Aburto, Gaymer, Haoa and Gonzalez2015).
Considering that M. caputdraconis is exploited on EI but not in SG Island where the Motu Motiro Hiva Marine Park is located, it is important to know about the degree of connectivity by migrants between these islands and the importance of this park in the species conservation. Here, the connectivity of M. caputdraconis between EI and SG was estimated using both genetic and biophysical modelling approaches. Whereas the variability of 11 microsatellite loci was used to infer the population structure and historical reciprocal migration between islands, a biophysical modelling procedure was employed to model larval transport between the two islands using biological and oceanographic information. Both genetic and biophysical modelling data are useful for determining the connectivity of M. caputdraconis populations in the entire geographical distribution of the species.
Materials AND Methods
Sampling, DNA extraction and microsatellite loci amplification
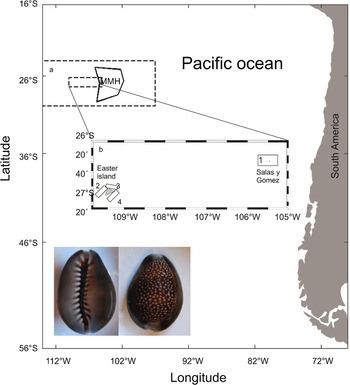
Seventy-seven specimens of M. caputdraconis were obtained from the intertidal zone by hand from EI (27°7′S; 109°22′W), and twenty-eight individuals of M. caputdraconis were collected in SG Island (SG, 26°28′S; 105°28′W) (Figure 1). Samples were stored in 95% ethanol, and a small piece of the muscular foot (approximately 1 mg) was used for DNA extraction with the Wizard Genomic DNA Purification Kit (Promega). DNA quantities were measured with a Nanodrop Spectrophotometer (Thermo Fisher). Eleven polymorphic microsatellite loci described for this species were amplified following the procedure of Vega-Retter et al. (Reference Vega-Retter, Briones and Veliz2016). Briefly, cycling conditions for all loci consisted of an initial denaturing step of 2 min at 95°C, followed by 35 cycles of 30 s at 95°C, 1 min at 55°C, 1 min at 72°C, and a final elongation step at 72°C for 3 min. We used three multiplexes to amplify the microsatellite loci with primers containing different fluorescent dyes (NED, FAM, VIC, or PET). The first plate amplified the following microsatellites: Pure7 (NED), Pure45 (NED), Pure18 (FAM), and Pure34 (FAM), the second plate: Pure33 (NED), Pure46 (NED), Pure31 (PET), Pure48 (PET), Pure47 (VIC), and Pure28 (FAM); and the third plate: Pure1 (FAM), Pure50 (FAM), Pure3 (VIC), Pure19 (VIC), Pure42 (PET), and Pure15 (NED). The polymerase chain reaction contained 2 μl template DNA (100 ng), 1 μl of each primer, and 10 ml of Type-it Microsatellite PCR Kit (Qiagen, Canada). PCR products were genotyped in the sequencing core at the Pontificia Universidad Católica, Chile, using the internal size standard LIZ 500 (Applied Biosystems) and with the reverse primers of each microsatellite locus marked with a fluorescent dye.
Location of Easter Island (EI) and Salas & Gómez (SG) Island where Monetaria caputdraconis inhabits. Rectangles located in EI and SG correspond to larval release/recruitment areas (1–4) for coupled simulations of the regional oceanic modelling system (ROMS). MMH: Motu Motiro Hiva Marine Park. The figure includes ventral and dorsal views of a specimen of Monetaria caputdraconis from Rapa Nui. Length size = 2.46 cm.

Population genetic structure
The number of alleles per locus and the expected (HE) and observed (HO) heterozygosity were estimated using Genetix software (Belkhir et al., Reference Belkhir, Borsa, Chikhi, Raufaste and Bonhomme2000); the allelic richness and genetic diversity with FSTAT software (Goudet, Reference Goudet1995). Using Genetix, linkage disequilibrium was tested using 5000 permutations on monolocus genotypes and departures from Hardy Weinberg Equilibrium (HWE) using 5000 allele permutations. To avoid related individuals in the population genetic analysis, we used the Identix software (Belkhir et al., Reference Belkhir, Castric and Bonhomme2002) to estimate the rxy relatedness index described by Queller and Goodnight (Reference Queller and Goodnight1989).
Testing for a possible population genetic structure between the two islands was carried out using three approximations. First, the F ST index (Weir and Cockerham, Reference Weir and Cockerham1984) was calculated with GENETIX (Belkhir et al., Reference Belkhir, Borsa, Chikhi, Raufaste and Bonhomme2000) with a statistical significance estimated with 10,000 permutations. Second, the G”ST index was calculated using GenAlEx 6.5 software (Peakall and Smouse, Reference Peakall and Smouse2012), and the statistical significance was estimated using 9999 permutations. This last estimator is not influenced by the heterozygosity of the samples and is not biased when the number of populations is low (Meirmans and Hedricks, Reference Meirmans and Hedricks2011). Third, STRUCTURE software (Pritchard et al., Reference Pritchard, Stephens and Donnelly2000) was used to estimate the most probable number of populations or clusters within the universe of samples. This analysis was performed using both admixture and correlated allele frequency models. The procedure was run five times for each K estimation (from K = 1 to K = 3) with a burn-in of 100,000 and then 200,000 MCMC each. Finally, a principal coordinate analysis (PCoA) was performed to summarise the variation within the data set using the package adegenet (Jombart and Ahmed, Reference Jombart and Ahmed2011) in R software (R Core Team, 2021).
Estimating the reciprocal migration rate
To estimate the migration pattern of M. caputdraconis between EI and SG, the historical migration rate (M H) was assessed using Migrate software (Beerli and Felsenstein, Reference Beerli and Felsenstein2001). This software employs a coalescent approach to estimate mutation-scaled migration rates (M) for each group over the last 4NE generations. The default settings were used except for the following run options: (i) the Bayesian inference module using the Brownian motion mutation model; (ii) one single long run utilising heating with temperatures of 1.0, 1.5, 3.0, and 10,000 [see Beerli (Reference Beerli2008) for more information about temperatures]; (iii) sampling ten replicates from each set of 400,000 at intervals of 100; and (iv) discarding the first 100,000 visits. The uniform prior distributions ranging from 0 to 100 with a delta of 10 were used for both mutations scaled by population size for theta (Θ) and M. The historical migration rate was calculated as M H = M × μ, where M = the historical gene flow rate scaled by the mutation rate and μ = the mutation rate. For this analysis, a mutation rate of μ = 2 × 10⁻³ was used, as in other gastropods (Gow et al., Reference Gow, Noble, Rollinson and Jones2005). The analysis was replicated four times and the effective number of migrants (Nm) was estimated as Nm = (Θ × M)/4. Migration analyses were performed at the National Center for High Performance Computing (NHLPC) of the Facultad de Ingeniería, Universidad de Chile.
Biophysical model for larval connectivity
The larval connectivity or exchange of individuals among islands was studied through a spatially explicit individual-based model (IBM) of larval transport that was coupled to the hydrodynamic output of a 3-D interannual configuration of the regional oceanic modelling system (ROMS) for the period 2011–2014 and at approximately 3 km resolution across the study area. The ocean model simulation setup is detailed in Meerhoff et al. (Reference Meerhoff, Yannicelli, Dewitte, Díaz-Cabrera, Vega-Retter, Ramos, Bravo, Concha, Hernández-Vaca and Veliz2018), who also analysed the connectivity between the two islands based on an IBM approach. The IBM was implemented with the Ichthyop code (Lett et al., Reference Lett, Verley, Mullon, Parada, Brochier, Penven and Blanke2008), and the larval connectivity between and within islands was calculated for larvae that successfully reached a recruitment area. The following features were used for the analysis:
a. Release/recruitment areas. Four areas were defined: three zones at EI following the morphology of the coast and one at SG (Figure 1). We used three areas in EI following the morphology of the island expecting different current circulation among these areas. We do not define different release areas in SG due to the size of the island.
b. Number of virtual larvae released. Due to computational limitations, a total of 250,000 virtual larvae were released from the release areas in each simulation.
c. Timing of larval release. Considering that the reproductive activity of M. caputdraconis occurs year round, with increased activity during spring and summer (Osorio and Gallardo, Reference Osorio and Gallardo1992), the analysis considered 250,000 virtual larvae liberated each month for three years: 2011, 2012, and 2013.
d. Depth of larval release. Because most species from the Family Cypraeaidae inhabit waters less than 30 m in depth (Kay, Reference Kay and Burgess1985), the release areas were defined at 0–50 m following information regarding the adults' distribution.
e. Planktonic larval duration: there is no published information about the pelagic larval duration of M. caputdraconis; hence, the model was evaluated for 14 days, following field observation performed by Osorio (personal communication).
For the analysis, a passive horizontal transport (forward Euler method, with a time step of 0.75 h) was implemented to run the model. A successful larva reached (or was found within) the ‘recruitment area’ at the end of its planktonic larval duration. Recruitment areas coincided with adult spawning areas (release areas).
Results
Population genetic analysis
The 11 loci were polymorphic at both islands; the allelic richness per locus varied from 1.92 (locus Pure50) to 11.86 (Pure18) at EI and from 1.62 (locus Pure 50) to 11.59 (locus Pure18) at SG (Supplementary Information S1). Genetic diversity (EI = 0.701, SG = 0.665) and allelic richness (EI = 7.213, SG = 6.974) were similar in both islands. Significant departures from HWE were detected consistently in one locus (Pure19); therefore, this microsatellite was not used in most of the analysis (Supplementary Information S1). Further, relatedness analysis performed with Identix software not detected related individuals (full or half-sibs) in the samples.
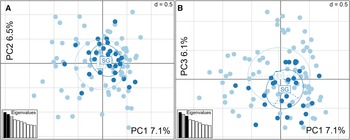
The three methods employed to determine the population structure suggested that M. caputdraconis of EI and SG belong to the same genetic population. The F ST and G”ST indexes (FST = 0.004, P = 0.128 and G”ST = 0.078, P = 0.101) did not detect a significant difference between EI and SG. The values of Ln(K) obtained from STRUCTURE showed a maximum likelihood value at K = 1 (Figure 2). The PCoA results demonstrated that most individuals shared the same space in the three main principal coordinates axis (Figure 3).
Population structure of M. caputdraconis inferred using the software STRUCTURE for K = 1 to K = 3 of the 105 individuals analyzed with ten microsatellites loci. A vertical bar represents each individual, and each colour represents the probability of belonging to one of the K genetic clusters.

PCoA plot for Monetaria caputdraconis samples using ten microsatellites. (a) PC1 vs PC2, (b) PC1 vs PC3. Individuals were coloured by their sampling locality; circles represent 95% of the variance from the centroid. PCoA axes are labelled with the variance that they represent; scree plots of eigenvalues represent variation explained by additional axes.

Measures of convergence and robustness of the four runs of Migrate software showed similar values (Supplementary Material S2); the effective sample sizes were in order of thousands as expected for robust analyses (see Beerli et al., Reference Beerli, Mashayekhi, Sadeghi, Khodaei and Shaw2019). Further, histograms of Θ showed an unimodal distribution (Supplementary Material S3), describing a correct runtime used for the analyses. The results of the four independent runs of the Migrate software are in Table 1. The mean mutation-scaled historical migration rates (M) were MSG→EI = 2.441 (SD = 0.927) and MEI→SG = 1.837 (SD = 0.163); the estimates of Θ were 9.68 (SD = 1.842) for EI and 3.826 (SD = 0.393) for SG. Using a mutation rate of 2 × 10⁻³, the migration rates between localities were MHSG→EI = 0.49% and MHEI→SG = 0.37%. The mean for self-recruitment (estimated as 1 − the total immigration rate) was 99.51% at EI and 99.63% at SG. The estimated Nm were NmSG→EI = 5.91 and NmEI→SG = 1.76 per generation.
Result of the migration analysis performed with Migrate software. Mean and standard deviation were calculated using data of each independent run

Population connectivity according to the biophysical model
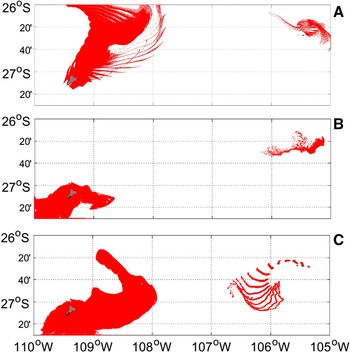
No larval connectivity or transport between islands was detected through the biophysical model for the 14 days of evaluated planktonic larval development (see Figure 4). The results were consistent for larvae released every month for 3 years. However, it is interesting to highlight that 1–45% of the total released larvae were self-recruited in EI (Figure 5). The maximum self-recruitment observed in EI was for larvae released in July 2012. However, self-recruitment was lower in SG and only occurred during some months (April and May 2012, Figure 5).
Particle trajectories obtained for particle released in (a) 2011, (b) 2012, and (c) 2013. The figure shows the final position after 14 days of simulations.

Time series of M. caputdraconis self-recruitment in both islands (monthly mean from three replicates is presented).

Discussion
The results of the genetic variability and biophysical model obtained for the gastropod M. caputdraconis showed a clear pattern of low connectivity between EI and SG. Whereas the number of migrant estimations obtained with genetic data showed an exchange of <1% between the islands, the biophysical model did not detect particles that moved between the islands at both monthly and annual timescales. These observations suggest that the length of pelagic larval duration and/or movement of the water would not allow a continuous flow of larvae between the islands.
It is known that the time of permanence of larvae in the water column is one of the best predictors of genetic connectivity of marine benthic organisms (Shanks, Reference Shanks2009; Modica et al., Reference Modica, Russini, Fassio and Oliverio2017). Empirical data confirmed that the longer the pelagic larval duration, the higher the probability of reaching remote zones and, thus, of having a distant connectivity. For example, Melarhaphe neritoides presents a pelagic development of 4–8 weeks (Johannesson, Reference Johannesson1992), and its populations have a large geographic extension in Europe (Fourdrilis and Backeljau, Reference Fourdrilis and Backeljau2019). In Chile, the muricid Concholepas concholepas has a planktonic larval development of up to 3 months (Disalvo, Reference Disalvo1988) and shows genetic populations with large geographic extensions (>500 km) (Cárdenas et al., Reference Cárdenas, Castilla and Viard2016). However, gastropod species with shorter larval development have shown a smaller distance of connectivity between populations. For example, Patella ferrugínea presented genetic differences in populations separated by more than 100 km in the island of Sardinia (Casu et al., Reference Casu, Casu, Lai, Cossu and Curini-Galletti2006). P. ferrugínea has a larval development with a similar length to M. caputdraconis, suggesting that the planktonic larval duration of M. caputdraconis is not sufficient to regularly connect EI and SG. Overall, gastropod species with short larval dispersal are candidates for low connectivity and endemism (Meyer, Reference Meyer2003; Meyer et al., Reference Meyer, Geller and Paulay2005).
Among the physical factors that could influence the larval movement between populations, the wind velocity (Bertness et al., Reference Bertness, Gaines and Wahle1996), internal waves (Shanks, Reference Shanks1986), mean direction of currents (Ellien et al., Reference Ellien, Thiébaut, Dumas, Salomon and Nival2004), eddies (Adams and Flierl, Reference Adams and Flierl2010), upwelling zones (Roughgarden et al., Reference Roughgarden, Gaines and Possingham1988), and other mesoscale processes (Wing et al., Reference Wing, Botsford, Ralston and Largier1998; Shulzitski et al., Reference Shulzitski, Sponaugle, Hauff, Walter, D'Alessandro and Cowen2018) are the main drivers. Perhaps, the most documented are the geographic breaks produced by changes in the oceanic currents flow, which prevent the passage of larvae from one region to another. Some breaks have been described in California (Pelc et al., Reference Pelc, Warner and Gaines2009) and Chile (Haye et al., Reference Haye, Segovia, Muñoz-Herrera, Gálvez, Martínez, Meynard, Pardo-Gandarillas, Poulin and Faugeron2014). In the case of the EI and SG system, there are no geographic breaks, and the mean surface currents are <6 cm s−1 between both islands (Chaigneau and Pizarro, Reference Chaigneau and Pizarro2005; Meerhoff et al., Reference Meerhoff, Yannicelli, Dewitte, Díaz-Cabrera, Vega-Retter, Ramos, Bravo, Concha, Hernández-Vaca and Veliz2018), which considering an approximate distance between the island of 400 km yields an average transit time of ~77 days at such speed (6 cm s−1). EI and SG are located in the east-central South Pacific gyre (von Dassow and Collado-Fabbri, Reference von Dassow and Collado-Fabbri2014), a typical gyre that circles around large areas of essentially stationary, calm water (Constantin and Johnson, Reference Constantin and Johnson2017). Hence, the mean water flow between the islands is relatively weak compared to other zones in the south-oriental Pacific Ocean. For example, surface currents measured between Juan Fernández and Desventuradas islands (Chaigneau and Pizarro, Reference Chaigneau and Pizarro2005) and surface geostrophic velocities in the coast off Chile are up to 20 cm s−1 (Letelier et al., Reference Letelier, Pizarro and Núñez2009). Overall, water currents between EI and SG may be too slow to promote larval movement between these islands. In addition, eddy activity around EI is relatively marked (Dewitte et al., Reference Dewitte, Conejero, Ramos, Bravo, Garcon, Parada, Sellanes, Mecho, Muñoz and Gaymer2021; their Figure 3b) and, thus, may act as a barrier for the connectivity through producing chaotic mesoscale recirculations.
The few migrants detected for M. caputdraconis through genetic data, but the lack of migrants obtained through the biophysical model shows that an alternative mechanism could be involved in the connectivity between the islands. One such mechanism might be the movement of adults through rafting. It is known that some gastropods can perform rafting to cross oceans. For example, it is suggested that Diloma nigerrima crossed the Pacific Ocean, from New Zealand to Chile, using macroalgae that drift with the currents (Donald et al., Reference Donald, Keeney and Spencer2011). This mechanism has also been suggested for other gastropod species that do not have free-swimming larvae but present populations with large geographic extensions (González-Wevar et al., Reference González-Wevar, Segovia, Rosenfeld, Ojeda, Hüne, Naretto, Saucède, Brickle, Morley, Féral, Spencer and Poulin2018). It is possible that the rafting is involved in the movement of the juvenile or adult M. caputdraconis, as suggested by Valencia et al. (Reference Valencia, Meerhoff, Díaz-Cabrera, Guerrero, Roja-Hernández, Vega-Retter and Veliz2021) for the fish K. sandwicensis between the same islands. Additionally, Rech et al. (Reference Rech, Gusmao, Kiessling, Hidalgo-Ruz, Meerhoff, Gatta-Rosemary, Moore, de Vine and Thiel2020) found that molluscs are frequently rafting taxa in anthropogenic debris in this area. However, it is important to consider that genetic analyses may be influenced by the limited number of loci employed to estimate population genetic structure, as well as the use of the same mutation rate for all microsatellites in the Migrate software. This limitation could impact the accuracy of the reciprocal migration rates calculation, as it may lead to an under or overestimation of the effective number of migrants between the islands. Overall, it is necessary to perform more studies to understand the importance of the number of loci used, debris, and the water circulation between the islands in the population connectivity of marine benthic species.
The self-recruitment of modelled M. caputdraconis larvae was higher in EI and presented interannual and monthly variability in both islands. It has been postulated that near the coast of EI, the geostrophic flow includes vertical and horizontal shears, which, combined with the vertical migration behaviour of the larvae, promote larval retention (Meerhoff et al., Reference Meerhoff, Ramos, Yannicelli, Bravo, Zambra and Varela2017). In addition, this hydrodynamic pattern that promotes larval retention is consistent with the high abundance of ichthyoplankton and insular ichthyoplankton species reported for the south coast off EI (Castro and Landaeta, Reference Castro and Landaeta2002; Landaeta et al., Reference Landaeta, Neira and Castro2003). Meanwhile, for the SG islands, more studies are required to understand the factors that explain the restricted periods of self-recruitment to a few months of the year.
What do we know from the EI and SG system until now?
These two islands share most of the endemic species (Friedlander et al., Reference Friedlander, Ballesteros, Beets, Berkenpas, Gaymer, Gorny and Sala2013). Hence, some degree of connectivity between their populations is expected. Although there are few species studied in the system, previous studies showed a similar pattern, with no genetic differentiation between the groups inhabiting both islands but with a low level of connectivity. In the case of the endemic lobster Panulirus pascuensis, a low but asymmetric connectivity, with considerably more flow from SG to EI, between the islands with both the genetic data and the biophysical model was detected (Meerhoff et al., Reference Meerhoff, Yannicelli, Dewitte, Díaz-Cabrera, Vega-Retter, Ramos, Bravo, Concha, Hernández-Vaca and Veliz2018). This species presents a larva that exceeds 10 months of planktonic life, which could explain the connectivity detected. On the other hand, for the rudderfish Kyphosus sandwicensis which has a larval stage of 1 month, it was not possible to detect particles migrating between both islands, but a historical migration rate of 0.15% from EI to SG and 0.2% from SG to EI was found (Valencia et al., Reference Valencia, Meerhoff, Díaz-Cabrera, Guerrero, Roja-Hernández, Vega-Retter and Veliz2021). The authors suggested that stochastic processes such as rafting could be involved in the connectivity of K. sandwicensis between these islands.
Thus, the distance between the islands, the relatively weak currents between the islands, and the larval development length would explain the low connectivity of M. caputdraconis. In this context, the Motu Motiro Hiva Marine Park located at SG Island could be a reservoir of M. caputdraconis conservation; however, larval export may not enough to replenish Easter Island population in the case of overexploitation. Other evidence also showing low connectivity has been reported between marine protected areas (MPAs) from Brazil and compromises the conservation of reef fishes by these MPAs (Endo et al., Reference Endo, Gherardi, Pezzi and Lima2019). These elements are important for understanding how populations of the species remain connected; therefore, they must be considered in the conservation plans proposed for different species with conservation goals.
Finally, in a global warming context, it is expected that there will be an overall increase in south-easterly trade winds of the South-eastern Pacific that are likely to increase the connectivity pattern between Juan Fernandez and Desventuradas islands and along the SG ridge, through increasing wind-driven mean ocean currents (Dewitte et al., Reference Dewitte, Conejero, Ramos, Bravo, Garcon, Parada, Sellanes, Mecho, Muñoz and Gaymer2021). However, in addition to changes in wind, it should be considered that plankton communities of the South Pacific sub-tropical gyre are also threatened by ocean acidification (Doney et al., Reference Doney, Ruckelshaus, Emmett-Duffy, Barry, Chan, English, Galindo, Grebmeier, Hollowed, Knowlton, Polovina, Rabalais, Sydeman and Talley2012), and larvae of marine gastropods are particularly vulnerable to this process (Bogan et al., Reference Bogan, McMahon, Pechenik and Pires2019), with possible impacts on larval survival and connectivity.
Supplementary material
The supplementary material for this article can be found at https://doi.org/10.1017/S0025315423000437
Acknowledgements
The authors thank the ESMOI Team for samples. Many thanks to Cecilia Osorio (Universidad de Chile) for sharing unpublished information and field observations of M. caputdraconis.
Author contributions
E. M. and ESMOI team collected specimens. N. R. H. and C. V. R. performed DNA extraction and microsatellite amplification. N. R. H., C. V. R., and D.V. run Migrate analysis. B. D. developed ROMS for the area. E. D. C. and E. M. performed the IBM approach. E. D. C. wrote the manuscript with support from D. V., E. M., and C. V. R. All authors discussed the results and contributed to the final manuscript.
Financial support
This study was supported by the Chilean Millennium Initiative ESMOI (Grant No. NC120030). Authors thank Supercomputing Infrastructure of the NLHPC (ECM-02). E. M. thanks Postdoctoral FONDECYT/Chile 3150419, Agencia Nacional de Investigación e Innovación (ANII) Grant Fondo Clemente Estable (FCE 3_2020_1_162359). and the National Science Foundation (USA) project ‘Shelf/Deep-Ocean Interactions in the Southwestern Atlantic’. D. V. thanks FONDECYT 1200589, 1191606, and ANILLO ATE220044. B. D. thanks ANID (Concurso de Fortalecimiento al Desarrollo Científico de Centros Regionales 2020-R20F0008-CEAZA) and EU H2020 Future Mares Project (Theme LC-CLA-06-2019, Grant No. 869300).
Conflict of interest
The authors declare no conflict of interest.
Ethical standards
All analyses were conducted in Chile and complied with its existing laws.
Data availability
The data that support the findings of this study are available from the corresponding author upon request.