I. INTRODUCTION
Electrooptic materials have been used for optical attenuatorsReference Jiang, Zou, Chen, Li, Zhang, Wang, Ming and Zheng1 and have potential applications such as fast phase modulators for three-dimensional (3D) imaging,Reference Cheng and Chen2 optical switches,Reference Tokuhashi, Ashizawa, Ishii, Okamoto, Yamanaka, Wakayama and Nashimoto3 beam deflectors,Reference Nakamura, Miyazu, Sasaura and Fujiura4 and fast-response varifocal lensReference Inagaki, Imai, Miyazu and Kobayashi5 for optical communications, due to the fast response of the refractive indices to the electric field. Recently, transparent Pb(Mg1/3Nb2/3)O3–PbTiO3 (PMN-PT) ceramics have attracted much attention because quadratic electrooptic properties larger than those of La-doped lead zirconate titanate (PLZT) ceramics were reported.Reference Jiang, Zou, Chen, Li, Zhang, Wang, Ming and Zheng1,Reference Ruan, Li, Zeng, Bian, Kamzina, Zeng, Zheng and Dingy6
Transparent PMN-PT ceramics have been prepared by a hot-press technique to achieve a dense microstructure with a reduced number of pores that increase light scattering and reflection due to a difference in the refractive indices of the ceramics and gas in the pores.Reference Haertling7–Reference Giniewicz, McHenry, Jang and Shrout12 However, the technique increases production cost and residual-strain-induced optical anisotropy, which reduces the transmittance.Reference Haertling7,Reference Yoshikawa and Tsuzuki13 For transparent PLZT ceramics, there are several reported hot-press-free fabrication processes that involve use of fine PLZT powdersReference Yoshikawa and Tsuzuki13–Reference Kong, Ma, Zhu and Tan15 and sintering of PLZT compacts in an oxygen atmosphere.Reference Snow16–Reference Choi, Ryu and Kim18 We previously demonstrated successful fabrication of transparent ceramics of compositions with large quadratic electrooptic coefficients,Reference Uchino19,Reference Kamzina, Wei, Li, Zeng and Ding20 0.9Pb(Mg1/3Nb2/3)O3–0.1PbTiO3 and La-doped 0.9(Pb0.97La0.03)(Mg1/3Nb2/3)O3–0.1(Pb0.97La0.03)TiO3, without using the hot-press technique. That is, compacts of fine calcined powders prepared by ball-milling with small zirconia media were sintered in an oxygen atmosphere.Reference Fujii, Yoshida, Imai, Yamazoe and Wada21
In this study, we applied this method to prepare transparent La-doped 0.67(Pb1−xLax)(Mg1/3Nb2/3)O3–0.33(Pb1−xLax)TiO3 (x = 0–0.05) ceramics, and the optical transmittance and other properties such as the crystal structure, microstructure and dielectric responses were investigated. The base composition of 0.67Pb(Mg1/3Nb2/3)O3–0.33PbTiO3 was reported to show an increased linear electrooptic coefficient.Reference Wan, Luo, Zhao, Wang, Chan and Choy22 La was substituted for Pb to increase optical transmittance, as reported for PMN-PT ceramicsReference Kamzina, Wei, Li, Zeng and Ding20,Reference Badillo, Eiras, Milton and Garcia23 and PLZT ceramics.Reference Haertling7 Although a systematic La concentration dependence of the crystal structure, microstructure, and dielectric and piezoelectric properties was reported for similar compositions of the La-doped 0.65PMN-0.35PT ceramics,Reference Viehland, Kim, Xu and Li24–Reference Gupta and Viehland26 that of the optical properties was not reported.
II. EXPERIMENTAL PROCEDURE
A. Ceramics processing
Transparent ceramics of 0.67(Pb1−xLax)(Mg1/3Nb2/3)O3–0.33(Pb1−xLax)TiO3 (x = 0, 0.01, 0.02, 0.03, 0.04, and 0.05) with excess 2 wt% PbO were prepared by a solid state synthesis and a conventional sintering process without using hot pressing. Powders of presynthesized magnesium niobate (MgNb2O6),Reference Fujii, Yoshida, Imai, Yamazoe and Wada21,Reference Swartz and Shrout27 lead oxide (PbO) (99.9%, Kojundo Chemical Lab. Co., Ltd., Saitama, Japan), lanthanum oxide (La2O3) (99.9%, Kojundo Chemical Lab. Co., Ltd.), and titanium dioxide (TiO2) (99.9%, Kojundo Chemical Lab. Co., Ltd.) were initially mixed with an agate mortar and pestle and calcined at 880 °C for 4 h in a closed magnesia crucible in air. Crystal structure of the calcined powder was checked by x-ray diffraction (XRD; RINT 2500, Rigaku Corporation, Tokyo, Japan) with CuKα radiation. The calcined powder was milled at 500 rpm for 20 min using a planetary ball mill (classic line P-7, Fritsch, Idar-Oberstein, Germany) with distilled water and stabilized zirconia balls with the diameters of 3 and 0.3 mm (YTZ ball, Nikkato Corporation, Osaka, Japan), with the weight ratio of 1:9, respectively. After drying at 120 °C, the powder was mixed with a 1 wt% polyvinyl alcohol binder and sieved through a mesh with 0.8-mm openings. Compacts pressed uniaxially at 70 MPa in a 10-mm-diameter die and then pressed cold isostatically at 200 MPa were embedded in a powder with a similar composition in a closed alumina crucible, which was initially heated at 700 °C for 2 h to remove the binder and then sintered at 1250 °C for 15 h in flowing O2 gas in a tube furnace.
B. Characterization
Density was measured by an Archimedes method. For microstructural observation, a surface of the sintered ceramics was initially polished with #400, #800, and #1200 SiC polishing papers, a #2000 Al2O3 lapping film, and 10, 5, and 1 µm diameter diamond slurries. Then, the polished ceramics were thermally etched at 1150 °C for 15 min in flowing O2 gas in the tube furnace. The surface was observed by scanning electron microscopy (SEM; VE-9800, Keyence Corporation, Osaka, Japan). Grain size and the error bar were determined to be an average and standard deviation of diameters of 60–80 grains observed on an SEM image. The ceramics were polished down to approximately 0.5 mm in thickness. The ceramic surface was mirror-polished using diamond slurry with the diamond particle diameter of 0.5 µm for optical measurement. Crystal structure was determined by XRD on the polished surfaces of sintered ceramics. Optical transmittance spectrum from 300 to 2000 nm was measured by ultraviolet-visible-near infrared spectroscopy (PMA-12, Hamamatsu Photonics, Shizuoka, Japan). For electrical measurements, silver paste was applied on the top and bottom surfaces of the ceramics and heated at 550 °C. The dielectric properties were determined from impedance measured at 1, 10, and 100 kHz using an impedance analyzer (4194A, Hewlett-Packard, Palo Alto, CA) at temperatures from room temperature to 150°. Polarization – electric field (P–E) loops were measured at 10 Hz using a ferroelectric tester (TF analyzer 2000, aixACCT Systems GmbH, Aachen, Germany).
III. RESULTS AND DISCUSSION
A. Optical properties, microstructure, and crystal structure
Figure 1 shows a photograph of the 0.67(Pb1−xLax)(Mg1/3Nb2/3)O3–0.33(Pb1−xLax)TiO3 ceramics with diameter of about 1 cm and thickness of about 0.5 mm. As can be seen, all of the ceramics were transparent. At x = 0, the ceramics was dark yellow. Note that La-undoped 0.9Pb(Mg1/3Nb2/3)O3–0.1PbTiO3 ceramics we previously prepared without hot-pressing were more transparent.Reference Fujii, Yoshida, Imai, Yamazoe and Wada21 With increasing x from 0 to 0.03, the ceramics became brighter and appeared the most transparent at x = 0.03. Further increase in x deteriorated the transparency, that is, the ceramics became yellowish. This result indicated that the fabrication method of transparent ceramics that was tuned for the composition of 0.9(Pb1−xLax)(Mg1/3Nb2/3)O3–0.1(Pb1−xLax)TiO3 (x = 0 and 0.03)Reference Fujii, Yoshida, Imai, Yamazoe and Wada21 was also effective for the composition of 0.67(Pb1−xLax)(Mg1/3Nb2/3)O3–0.33(Pb1−xLax)TiO3 (x = 0–0.05). Important factors for preparation of transparent ceramics are use of fine powder and an oxygen atmosphere, in which compacts of the fine powder were sintered. To prepare fine powder, we used fine pulverization media with the diameter of 0.3 mm. Previously, translucent 0.65Pb(Mg1/3Nb2/3)O3–0.35PbTiO3 ceramics were prepared without using a hot-press technique.Reference Kong, Ma, Zhu and Tan28 The ceramics were at least translucent, because nanosized powder was used. However, the ceramics were not transparent, probably because they were sintered in air. It was believed that oxygen could easily diffuse in the oxide and therefore the pores could be eliminated and ceramics appeared transparent while nitrogen could not.Reference Yoshikawa and Tsuzuki13,Reference Choi, Ryu and Kim18
Photograph of 0.67(Pb1−xLax)(Mg1/3Nb2/3)O3–0.33(Pb1−xLax)TiO3 ceramics. Diameter and thickness of ceramics were about 1 cm and 0.5 mm, respectively.

Figure 2 shows the transmittance spectra of the 0.5-mm-thick 0.67(Pb1−xLax)(Mg1/3Nb2/3)O3–0.33(Pb1−xLax)TiO3 ceramics. At x = 0, the transmittance gradually increased near the wave length of 400 nm, which was associated with a band edge of the ceramics, and reached 1–6% at 500–800 nm of visible wave lengths and 29% at 2000 nm of an infrared wave length. At x = 0–0.03, the transmittance increased with x; at x = 0.03, it was 21–50% at 500–800 nm and 66% at 2000 nm. On the other hand, at x = 0.04 and 0.05, the transmittance at the low-wave length region of 400–700 nm decreased with x, while the transmittance at 2000 nm increased to about 68%. Compared with the transparent La-doped 0.9Pb(Mg1/3Nb2/3)O3-0.1PbTiO3 ceramics for quadratic electrooptic applications, the transmittance of 800–2000 nm for x = 0.03–0.05 was comparable, while that at 400–800 nm was smaller.Reference McHenry, Giniewicz, Jang, Bhalla and Shrout8,Reference Fujii, Yoshida, Imai, Yamazoe and Wada21 The wave length dependence of the transmittance in visible wave lengths corresponded to the sample color. That is, the ceramics appeared yellow because of the lower transmittance at the wave lengths of the complementary color of purple. Also, the ceramics appeared the most transparent at x = 0.03 because of the largest transmittance at most visible wave lengths. Note that the reflection loss should occur at the interface between air and the 0.67(Pb1−xLax)(Mg1/3Nb2/3)O3–0.33(Pb1−xLax)TiO3 ceramics due to the difference in refractive indexes. Reflection can be calculated as ((n a − n c)/(n a + n c)),Reference Cheng and Chen2 where n a is the refractive index of air and n c that of ceramics.Reference Peelen and Metselaar29 It was reported that the refractive index of 0.67Pb(Mg1/3Nb2/3)O3–0.33PbTiO3 single crystal was 2.593 at 633 nm wave length at room temperature,Reference Wan, Chan, Choy, Zhao and Luo30 leading to the reflection of 20%. Similar refractive indices and reflection are expected for the ceramics prepared in this study. To understand the La content dependence of the transmittance spectra, the microstructure and crystal structure were investigated.
Wave length dependence of optical transmittance of 0.67(Pb1−xLax)(Mg1/3Nb2/3)O3–0.33(Pb1−xLax)TiO3 ceramics. Thickness of ceramics is about 0.5 mm.
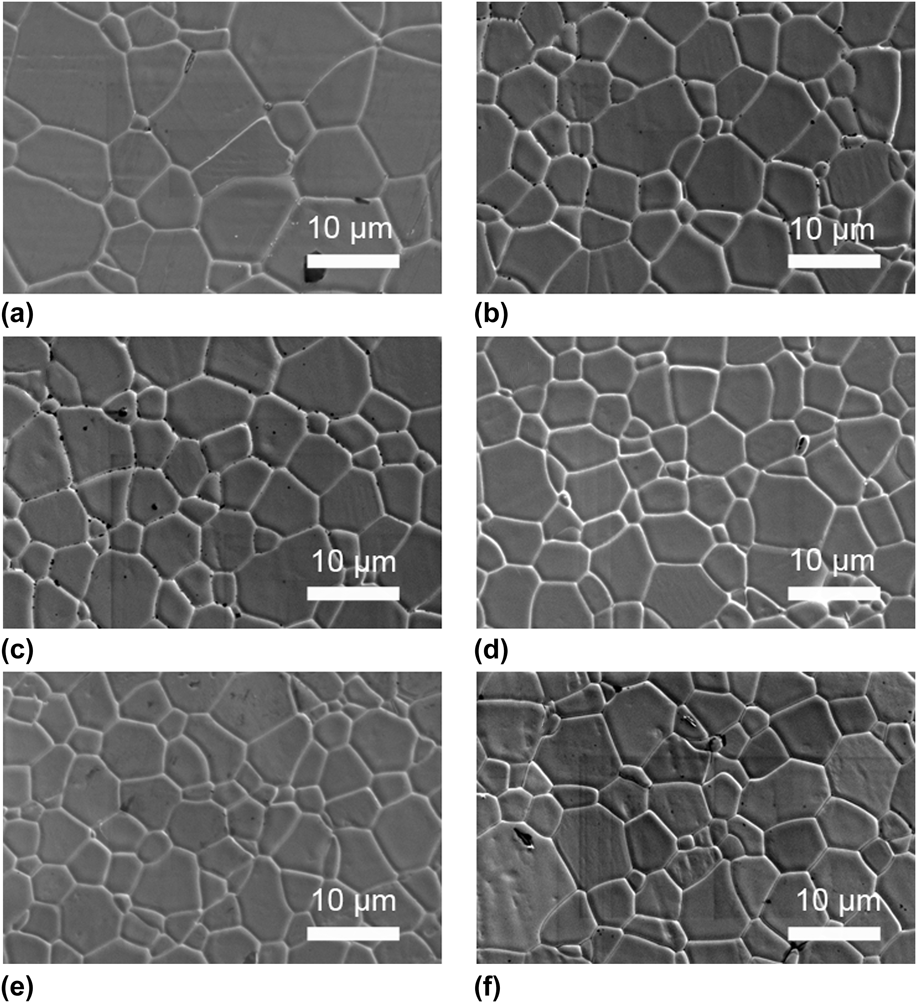
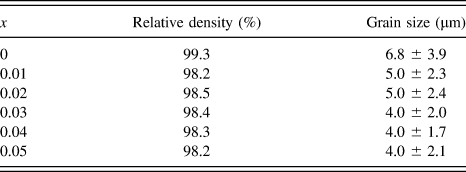
Figure 3 shows the microstructures of the 0.67(Pb1−xLax)(Mg1/3Nb2/3)O3–0.33(Pb1−xLax)TiO3 ceramics. For all the samples, dense microstructures were observed. At x = 0, a relatively large average grain size of 6.8 µm and a high density of 99.3% were observed. At x = 0.01–0.05, the grain size and density decreased to 4.0–5.0 µm and 98.2–98.5%, respectively (see Table I). It was reported that La was a grain growth inhibitor for Pb(Mg1/3Nb2/3)O3 and Pb(Mg1/3Nb2/3)O3–PbTiO3 ceramics.Reference Kim, McHenry, Jang and Shrout11,Reference Kim, Huebner, Jang and Shrout31 For example, a similar reduction in the grain size on La-doping was previously reported for La-doped 0.65(Pb1−yLay)(Mg1/3Nb2/3)1−y/4O3–0.35(Pb1−yLay)Ti1−y/4O3 ceramics sintered at 1250 °C for 4 h, in which the average grain size of ∼7–8 µm at y = 0 decreased to ∼4 µm at y = 0.1.Reference Gupta and Viehland26 Because grain boundaries and pores can act as a scattering source of light,Reference Haertling7 the transmittance at x = 0 would be larger than that at x = 0.01–0.05. However, this was not true, and therefore they were not primal factors that determined the La concentration dependence of the transmittance.
Microstructure of 0.67(Pb1−xLax)(Mg1/3Nb2/3)O3–0.33(Pb1−xLax)TiO3 ceramics: (a) x = 0, (b) x = 0.01, (c) x = 0.02, (d) x = 0.03, (e) x = 0.04, and (f) x = 0.05.
Relative density and grain size of 0.67(Pb1−xLax)(Mg1/3Nb2/3)O3–0.33(Pb1−xLax)TiO3 (x = 0–0.05) ceramics.
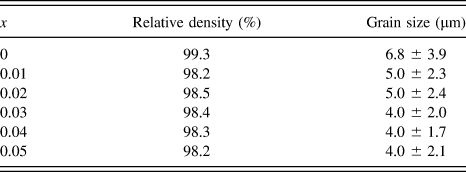
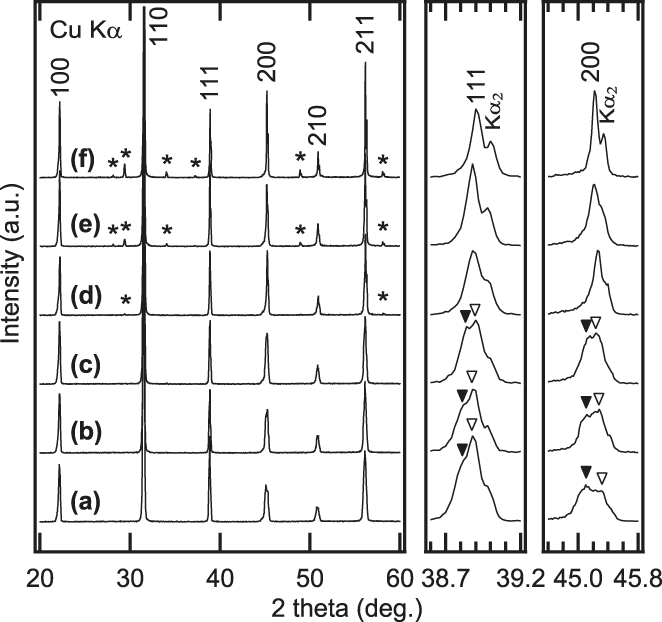
Figure 4 shows the XRD patterns of the 0.67(Pb1−xLax)(Mg1/3Nb2/3)O3–0.33(Pb1−xLax)TiO3 ceramics. A single perovskite phase was observed at x = 0. A peak separation in the 111 and 200 perovskite peaks (indexed based on the cubic symmetry) was observed, which indicated that the dominant macroscopic phase at x = 0 was monoclinic with a Pm space group.Reference Singh, Pandey and Zaharko32,Reference Noheda, Cox, Shirane, Gao and Ye33 At x = 0.01 and 0.02, the monoclinic phase persisted although the separation became smaller. At x = 0.03–0.05, the peaks merged into a single peak and became sharper with x, indicating that the crystal system became pseudocubic. For those compositions (x = 0.03–0.05), a pyrochlore phase was observed in addition to the perovskite phase, and the peak intensity of the pyrochlore phase increased with x, which suggested an increase in the pyrochlore phase concentration. A pyrochlore phase has been reported for La-doped 0.65(Pb1−yLay)(Mg1/3Nb2/3)1−y/4O3–0.35(Pb1−yLay)Ti1−y/4O3 ceramics.Reference Gupta and Viehland25,Reference Gupta and Viehland26 It was explained that the pyrochlore phase was formed as a result of a charge unbalance in the ceramics. Substitution of La3+ ions for the Pb2+ ions resulted in an increase in the charge, which was compensated by a decrease in Nb5+ ion concentration and an increase in Ti4+ ion concentration in the perovskite phase. This promoted formation of an Nb-rich phase of a pyrochlore (e.g., a Pb0.93La0.08Mg0.06Nb0.69Ti0.22O3.26 pyrochlore phase was reported for a nominal composition of 0.65(Pb0.9La0.1)(Mg1/3Nb2/3)O3–0.35(Pb0.9La0.1)TiO3).Reference Gupta and Viehland25 These results suggested that the overall transmittance that increased with x was associated with the change from the monoclinic phase to the pseudocubic phase in the perovskite structure because the higher symmetry phase of the pseudocubic phase was isotropic in refractive indices, which resulted in reduced light scattering. However, the formation of the pyrochlore phase might reduce the optical transmittance at wave lengths shorter than 800 nm. It is believed that some defects were produced in the PMN-PT phase as a result of the formation of the pyrochlore phase, which absorbed light with wave lengths longer than the band edge. We do not know what the defects are at present.
XRD patterns of 0.67(Pb1−xLax)(Mg1/3Nb2/3)O3–0.33(Pb1−xLax)TiO3 ceramics: (a) x = 0, (b) x = 0.01, (c) x = 0.02, (d) x = 0.03, (e) x = 0.04, and (f) x = 0.05. Asterisk indicates peaks associated with pyrochlore phase.
B. Dielectric properties
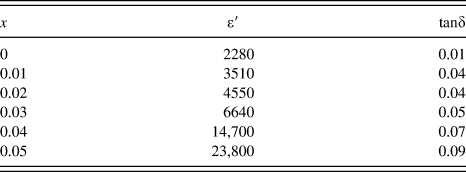
As shown by the XRD study, the crystal system of the ceramics was either monoclinic or pseudocubic, suggesting that the ceramics had a domain structure. Since the domain structure affects the optical properties (mainly through domain walls), it is important to know the domain structure. One way to do this is to measure the dielectric properties. Figure 5 shows the temperature dependence of the dielectric properties measured at 1, 10, 100 kHz for the 0.67(Pb1−xLax)(Mg1/3Nb2/3)O3–0.33(Pb1−xLax)TiO3 ceramics with x = 0, 0.03, and 0.05. At x = 0, a peak associated with a paraelectric to ferroelectric phase transitionReference Singh, Pandey and Zaharko32 was observed at 165 °C. The peak showed a weak dielectric dispersion. With increasing x, the peak temperature was lowered (which was also indicated by an increase in the dielectric properties with x, as shown in Table II) and a relaxor behavior was observed; the dispersion became stronger with an increase in the peak temperature upon increasing frequency.Reference Cross34 These results were consistent with previous studies.Reference Viehland, Kim, Xu and Li24–Reference Gupta and Viehland26 Since the relaxor behavior was attributed to nanosized domains (nanodomains),Reference Samara35 these data suggested that domains at x = 0 were reduced to a nanosize by the La-doping. In fact, the effect of La-doping on the domain structure was observed by transmission electron microscopy in La-doped 0.65(Pb1−yLay)(Mg1/3Nb2/3)O3–0.35(Pb1−yLay)TiO3 ceramics; a tweed-like domain structure with a domain length of ∼200 nm and a domain width of ∼20 nm at y = 0 was reduced upon La-doping and a nanodomain structure coexisted at y = 0.05.Reference Viehland, Kim, Xu and Li24 Since the reduction in the domain size accompanied the increase in symmetry (as indicated by XRD patterns), the overall transmittance increased with x. This explained that relaxor (La-doped) 0.9Pb(Mg1/3Nb2/3)O3–0.1PbTiO3 ceramics were more transparent than ferroelectric (La-doped) 0.67Pb(Mg1/3Nb2/3)O3–0.33PbTiO3 ceramics.
Temperature dependence of dielectric properties measured at 1, 10, and 100 kHz for 0.67(Pb1−xLax)(Mg1/3Nb2/3)O3–0.33(Pb1−xLax)TiO3 ceramics with x = 0, 0.03, and 0.05. Arrows indicate directions of increasing frequency. La content dependence of room temperature dielectric properties measured at 1 kHz.
Dielectric constant (ε′) and loss (tanδ) of 0.67(Pb1−xLax)(Mg1/3Nb2/3)O3–0.33(Pb1−xLax)TiO3 ceramics, measured at 1 kHz and at room temperature.
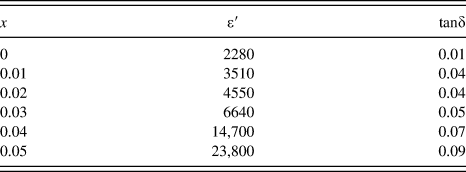
Figure 6 shows the P–E loops of the 0.67(Pb1−xLax)(Mg1/3Nb2/3)O3–0.33(Pb1−xLax)TiO3 ceramics. At x = 0, a ferroelectric hysteresis loop was observed. The 1% La substitution increased the remanent polarization. This result was different from a previous study of La-doped 0.65(Pb1−yLay)(Mg1/3Nb2/3)1−y/4O3–0.35(Pb1−yLay)Ti1−y/4O3 ceramics (where the remanent polarization did not increase but an electric field-induced strain increased at y = 0.015),Reference Gupta and Viehland26 while an increase in squareness of a hysteresis loop of PLZT ceramics was reported.Reference Haertling7 The increase in the remanent polarization might be caused by a donor doping effect. With increasing x, the remanent polarization and the coercive field decreased. In particular, a slim loop with a reduced remanent polarization was observed at x = 0.05. At x = 0.03 and 0.04, the ferroelectric P–E loops were observed, even though the XRD patterns and the temperature dependent dielectric properties indicated the pseudocubic crystal structure and the relaxor behaviors, respectively. This could be attributed to an electric field-induced change in the domain structure from relaxor nanodomains to ferroelectric macro domains, as reported for 0.8PMN-0.2PT and 0.74PMN-0.26PT single crystals.Reference Cao, Li and Viehland36 At x = 0.05, the domain size was so small that the ferroelectric phase was believed to be only induced when the electric field was applied, resulting in the reduced remanent polarization. To use the ceramics for linear electrooptic applications, it needs to be poled. The ceramics with x = 0.03 and 0.04 showed large remanent polarization with large transmittance spectra, which suggests that they could be potential linear electrooptic materials. The transmittance, especially at visible wave lengths, can further be increased by poling the ceramics,Reference Tu, Wang, Chien, Schmidt and Tuthill37 which eliminates domain walls that scatter light.Reference Haertling7
P–E loops of 0.67(Pb1−xLax)(Mg1/3Nb2/3)O3–0.33(Pb1−xLax)TiO3 (x = 0–0.05) ceramics. Arrow indicates direction of increasing x.
IV. CONCLUSIONS
Transparent 0.67(Pb1−xLax)(Mg1/3Nb2/3)O3–0.33(Pb1−xLax)TiO3 (x = 0–0.05) ceramics were prepared by conventional solid-state synthesis without using a hot-press technique. The optical transmittance measured at the wave lengths of 400–2000 nm increased with x at x = 0–0.03. At x = 0.04 and 0.05, the transmittance measured at 400–600 nm decreased while that measured at 600–2000 nm tended to increase. The reduction in the transmittance at 400–600 nm was related to the formation of the pyrochlore phase, while the increase in the transmittance at 600–2000 nm was attributed to the increase in the macroscopic symmetry. At x = 0.03 and 0.04, large remanent polarization was observed, which suggested that the ceramics could be potential linear electrooptic materials.