Prescription drug expenditures rose considerably faster in the US than expenditures for hospital and physician services from the mid-1990s until 2004 (‘Prescription drug trends’, 2004). In 2000, the annual increase in drug expenditures topped out at 20%, but data from 2004 show that the annual increase in prescription drug expenditures has slowed to approximately 8% and is on par with the annual increases of other medical services (Catlin et al., Reference Catlin, Cowan, Heffler and Washington2007).
Catlin et al. (Reference Catlin, Cowan, Heffler and Washington2007) partly attribute the slowing of prescription expenditures to the use of tiered co-payments. Tiered co-payments encourage people to consider the cost of medication they are taking and provide incentives to use less expensive, typically generic, drugs. Many health plans use tiered co-payment structures to share costs with consumers and thereby encourage use of generics (tier 1 with the lowest co-payments) over branded medications (tier two). Some health plans use a three-tiered system with discounts for preferred branded medications.
Even with lower co-payments for many generic medications, patients with chronic diseases or other serious health problems frequently have difficulty affording their pharmacotherapy. Some patients use a variety of behaviours to limit their out-of-pocket expenses, including taking fewer doses, postponing taking a medication, failing to fill the prescription at all, or taking the medication less frequently than prescribed (Piette et al., Reference Piette, Heisler and Wagner2004, Reference Piette, Heisler and Wagner2004, Reference Piette, Heisler and Wagner2004, Reference Piette, Heisler and Wagner2006; Heisler et al., Reference Heisler, Wagner and Piette2004, Reference Heisler, Wagner and Piette2005).
Evaluations of administrative pharmacy data provide some insights into the relationship between patients’ co-payment (price) and cost-related underuse. Goldman and colleagues (2004) evaluated over 500,000 private insured persons from 1997 to 2000. They observed large increases in co-payment prices during this period, with concomitant decreases in drug use associated with higher co-payment costs. Although they found patients were most sensitive to price for symptom-related medications (e.g., antihistamines), patients were also price sensitive when considering medications for chronic asymptomatic conditions such as hypertension.
Huskamp and colleagues (Reference Huskamp, Deverka, Epstein, Epstein, McGuigan and Frank2003) analyzed claims data to examine employee sensitivity to changes in co-payments. They found that greater patient cost-sharing through the implementation of tiered co-payments resulted in considerable shift from the use of tier-3 branded medications to tier-1 or tier-2 medications. However, they also observed that many people discontinued some medications, including statins, altogether.
The administrative data used in the Goldman et al. (Reference Goldman, Joyce, Escarce, Pace, Solomon, Laouri, Landsman and Teutsch2004) and Huskamp et al. (Reference Huskamp, Deverka, Epstein, Epstein, McGuigan and Frank2003) studies are useful in identifying global changes in the volume of medication used by patients associated with changes in price. However, the full extent of cost-related underuse may not be evident with claims data because claims data over-estimate patients’ adherence to medications (Choo et al., Reference Choo, Rand, Inui, Lee, Cain, Cordeiro-Breault, Canning and Platt1999; Steiner and Prochazka, Reference Steiner and Prochazka1997). Conversely, some patients may be observed in administrative files as failing to refill a regular prescription, even though they are continuing to use that treatment with payment from another source of coverage that is not captured in administrative files (Evans and Crawford, Reference Evans and Crawford1999).
To complement insights from administrative files, researchers have used survey data to investigate the different behaviours associated with cost-related medication underuse. In the past, most surveys employed a single, global question to measure cost-related underuse. For example, Steinman and colleagues (Reference Steinman, Sands and Covinsky2001) and Mojtabai et al. (Reference Mojtabai and Olfson2003) analyzed a question from the Survey of Asset and Health Dynamics Among the Oldest Old (AHEAD), which asked, ‘At any time in the last 2 years have you ended up taking less medication than was prescribed for you because of the cost?’ Recent studies have asked multiple questions about the type and frequency of cost-related underuse in relation to medications for a specific illness (Piette et al., Reference Piette, Heisler and Wagner2004).
Many of the studies using survey data employ multivariate models and control for self-reported insurance type (e.g., government funded, private, or uninsured). However, selection could bias the estimates of cost-related underuse by insurance type, and as Mojtabai et al. (Reference Mojtabai and Olfson2003) note, caution is warranted in interpreting these regression results. To avoid selection bias, Goldman et al. (Reference Goldman, Joyce, Escarce, Pace, Solomon, Laouri, Landsman and Teutsch2004) and Huskamp et al. (Reference Huskamp, Deverka, Epstein, Epstein, McGuigan and Frank2003) estimated co-payment prices with their administrative claims data. Nevertheless, there has not been a detailed investigation with survey data focusing on the relationship between co-payment levels and medication cost problems, including those types of problems that may not be evident with claims data. These analyses are important for policy makers because of well-known limitations with claims data and because co-payments are one of the few levers that policy makers can use to encourage greater use of generics, but increasing co-payments may backfire, resulting in greater non-adherence and worse health outcomes. Cost-related underuse has been associated with increased inappropriate utilization (emergency department visits) and declines in health status (Soumerai et al., Reference Soumerai, Avorn, Ross-Degnan and Gortmaker1987, Reference Soumerai, McLaughlin, Ross-Degnan, Casteris and Bollini1994, Reference Soumerai, Ross-Degnan, Avorn, McLaughlin and Choodnovskiy1991; Tamblyn et al., Reference Tamblyn, Laprise, Hanley, Abrahamowicz, Scott, Mayo, Hurley, Grad, Latimer, Perreault, McLeod, Huang, Larochelle and Mallet2001; Melfi et al., Reference Melfi, Chawla, Croghan, Hanna, Kennedy and Sredl1998). In addition, without considering all of the co-payments that a patient faces, increasing medication co-payments alone could result in increases in hospital utilization and greater overall health care costs.
In this paper, we use survey data from a large, national sample of adults age 50 and older using one or more prescription medication for a chronic illness to examine the relationship between average co-payment levels and cost-related medication underuse. We investigate four types of cost-related underuse: taking fewer doses, postponing taking a medication, failing to fill a prescription at all, and taking medication less frequently than prescribed. With multivariate regression models, we predict the probability of cost-related underuse at different co-payment amounts. We focus on co-payments because they have been increasing in recent years and they remain an important tool that policy makers can use to affect consumer behaviour.
Methods
Data
We conducted a national survey of adults age 50 and over with chronic medical conditions requiring regular use of prescription drugs. The survey was administered in November and December 2002 by Knowledge Networks, who established a survey panel using random digit dialling. Their panel is designed to be nationally representative of US households with telephones. The Knowledge Networks data have been used in other studies with comparisons to other large national surveys finding many similarities (Baker et al., Reference Baker, Wagner, Singer and Bundorf2003; MMWR, 2000; Harris, Reference Harris2002). Elsewhere, papers describe analyses from this survey including the frequency with which patients talk to their providers about cost-related underuse and the frequency with which people report underuse (Piette et al., Reference Piette, Heisler and Wagner2004; Piette et al., Reference Piette, Heisler, Krein and Kerr2005; Piette et al., Reference Piette, Heisler and Wagner2004). The current study adds to this body of work by assessing the relationship between cost-related underuse and co-payments, thereby bridging the gap between research using claims data and research using self-reported survey data.
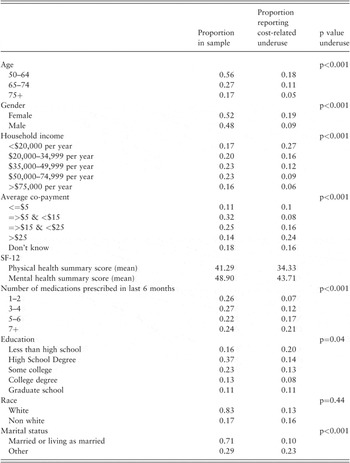
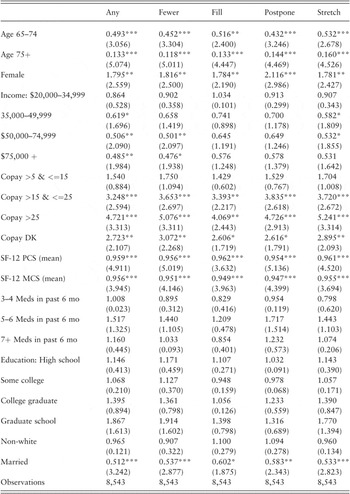
For the current study, we used sociodemographic and health status information to identify all 5,644 Knowledge Networks panel members aged 50 and over who reported taking prescription medication for diabetes, depression, heart problems, hypertension, or high cholesterol. After three personalized email requests, 4,264 (75.5%) people completed the on-line informed consent and our survey. For the current study, we limited the sample to participants who reported paying a co-payment when they filled a prescription (n = 2,869). Although our sample had 2,869 persons, for some of our analyses a person could contribute more than one observation (i.e., Tables 1 and 2 report 8543 observations).
Sample characteristics and proportion reporting cost-related underuse (n = 2,869)

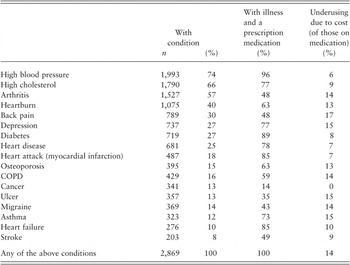
Respondents with condition, taking medication and underusing due to cost

The survey asked respondents about whether they had any of 17 chronic health conditions: arthritis; asthma; chronic back pain or sciatica; high cholesterol; COPD (chronic bronchitis, emphysema, or COPD); depression; diabetes; heartburn, acid reflux, or irritable bowel syndrome; atherosclerosis (blocked arteries in the heart, angina, or chest pain from heart disease); heart failure; high blood pressure or hypertension; myocardial infarction (heart attack); migraine headache; osteoporosis; stomach or duodenal ulcers; and stroke. Open ended questions also allowed respondents to identify other illnesses. One author reviewed the open-ended responses and identified a respondent as having one of the 17 chronic conditions when appropriate. Other unlisted illnesses were also identified using the open-ended responses, but because of very small samples these illnesses were excluded from further analysis.
Patients were asked whether they used prescription medication for each condition they reported. For each medication type, we inquired whether they took less of their medication in the prior 12 months because of the cost. Specifically, respondents reported the frequency with which they: ‘took fewer pills or a smaller dose [because of cost]’, ‘did not fill a prescription at all’, ‘put off or postponed getting a prescription filled’, ‘used herbal medicines or vitamins when [they] felt sick rather than take [their] prescription medication’, and ‘took the medication less frequently than recommended to “stretch out” the time before getting a refill’. In this study, use of herbal medicine was reported rarely and therefore we excluded it from further analysis. Also in the survey, respondents were asked about health insurance coverage for prescription drugs.
To identify the co-payment per medication, people were asked how much they usually pay out of pocket (money that isn’t reimbursed later) when they get a brand name or generic prescription medication. Brand name or generic co-payments were collected using an open-ended response, with an ‘I don’t know’ option. Table 3 describes the characteristics of the study participants. These estimates take into account survey weights and the complex survey design. This analytic sample generalizes to chronically ill older adults who pay co-payments for pharmaceutical treatments in the US.
Logit regression models of cost-related underuse in past year

Notes: The dependent variables came from the following question: Thinking specifically about your XX medicine, in the past twelve (12) months, how often did you do each of the following because of the cost? (a) Take fewer pills or a smaller dose; (b) Not filled a prescription at all; (c) Put off or postpone getting a prescription filled (d) Take the medication less frequently than recommended to ‘stretch out’ the time before getting a refill
The regressions included dummy variables for each of the 17 chronic conditions, but those results were omitted to shorten the table.
Coefficients are odds ratios
Robust z statistics in parentheses
*significant at 10%; **significant at 5%; ***significant at 1% (two-sided test).
Analysis plan
We used regression analysis to estimate the association between average co-payments (prices) and cost-related medication underuse. An observation represents the underuse of a prescribed medication. In the regression models, people contribute an observation for each medication type they were prescribed (e.g., one observation for medication treating diabetes, hypertension, etc.). Since medication use behaviour is likely to be correlated within patient, and because respondents could provide more than one observation, we adjusted standard errors for clustering.
Our key independent variable was the average prescription drug co-payment. Although the survey asked respondents about co-payments for branded and generic medications, we did not ask people to identify their medications and whether they were generic or branded because we felt that responses to such questions would be inaccurate. Therefore co-payments are not directly related to a specific medication for which there is cost-related underuse. To address this issue, we calculated the average co-payment (i.e. (branded co-payment + generic co-payment)/2). This is an unweighted average; prior studies with claims data have calculated weighted averages (Goldman et al., Reference Goldman, Joyce, Escarce, Pace, Solomon, Laouri, Landsman and Teutsch2004), but we do not know the number of generic and branded drugs for each respondent. We address this limitation in sensitivity analyses, where we re-analyzed the data assuming that people always minimize their co-payment. This represents the lower bound of a weighted average. As is discussed later, the results were quite robust to the sensitivity analyses.
To allow for non-linear relationships between co-payment and medication underuse, we categorized co-payments into five dummy variables <$5, $5 to <$15, $15 to <$25, ≥$25, and ‘don’t know’. We also examined other categories and functional forms for co-payment, including linear and log-linear. There were few differences in these models, and we report the dummy variable option to allow for a wider range of non-linearities in the relationship between co-payments and underuse. We believe that the marginal effect of the co-payment depends on the number of medications a person takes, so we controlled for the total number of prescriptions reported by each respondent.
The regression includes dummy variables for the 17 chronic conditions. We also include health status as measured by the mental and physical summary scores from the SF-12 (Ware et al., Reference Ware, Kosinski and Keller1996). Finally, we controlled for demographic characteristics including age, gender, and income.
We consider four types of cost-related medication underuse: taking FEWER pills or a smaller dose, not FILLING a prescription at all, POSTPONING getting a prescription filled, and taking the medication less frequently than recommended to STRETCH out the time before getting a refill. The exact questions are included in the footnotes to Table 1. Respondents were asked about underuse in the past 12 months, and responses were on a five-point ordinal response scale where 1 = at least once a week, 2 = at least once a month, 3 = about every two to three months, 4 = less than every two or three months, and 5 = never.
We fit logit models evaluating underuse at least once a month or more and underuse ever in the last year. We also assessed linear probability models with the five-point response scale. There were few meaningful differences between the models; we report odds ratios from the logit models to ease interpretation.
The data in this study are cross-sectional and identification is obtained by the changes in the average co-payment across individuals. Of particular concern is unobserved heterogeneity related to health status. Sicker individuals are likely have less income than healthy individuals and therefore more apt to underuse medication due to cost. We control for health status in a number of ways. First, we include dummy variables for the 17 chronic conditions asked about in the survey. As is shown in Table 4, there is considerable variation in cost-related underuse across the chronic conditions. In addition, we use the mental and physical summary scores from the SF-12. Finally, we expect a positive correlation between number of prescriptions and the likelihood that a person underuses medication. Consequently, we control for the number of prescriptions reported in the last six months. All analyses were conducted using Stata version 9.2.
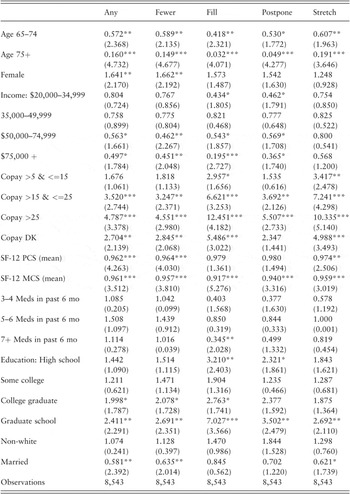
Logit regression models of cost-related underuse in past month

Notes:
The regressions included dummy variables for each of the 17 chronic conditions, but those results were omitted to shorten the table.
Coefficients are odds ratios
Robust z statistics in parentheses
* significant at 10%; **significant at 5%; ***significant at 1% (two-sided test).
Results
In this sample of chronically ill Americans aged 50 and older, the regression models indicated that co-payment level was significantly associated with cost-related underuse. This result was very robust to model specifications. Universally, increasing co-payments were positively associated with cost-related underuse. Tables 1 and 2 report the odds ratios from the logistic regression models; Table 1 shows underuse in the past year, while Table 2 shows underuse at least monthly.
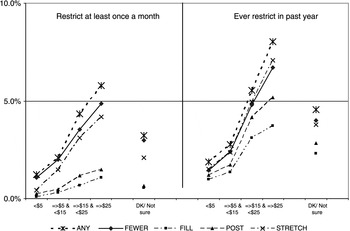
The relationship between co-payment and cost-related underuse is further shown in Figure 1, where we present predicted probabilities estimated from the regression models. For the figures, the probabilities were predicted at the means of the other covariates. Estimating predicted probabilities removes variation associated with health status, income and the number of medications the person takes. Had we estimated the predicted probabilities for a hypothetical adult with many medications, low income and poor health status, the intercept would have been higher, indicating a greater proportion of cost-related underuse. Hence, when viewing Figure 1, caution is warranted when interpreting the absolute percentages of cost-related underuse. Also, the slope of the curve for underuse in the past year appears steeper than the slope for underuse in the past month, but these slopes were not statistically different.
Relationship between co-payments and cost-related underuse

Two things stand out in Figure 1. First, postponing taking a medication and not filling a medication were less commonly reported than taking fewer medications or taking medications less frequently than prescribed. This is especially true when considering cost-related underuse in the past month. For example, for a co-payment of $5, the predicted probability of taking fewer pills or a smaller dose in the past month was 2% and the predicted probability of not filling a prescription was 0.3%.
Second, the summary line for any restriction is only slightly higher than the other lines. Hence, most people who report cost-related underuse use multiple strategies when underusing their medication. In other words, people who report taking fewer medications than prescribed also stretch out their supply of drugs to extend the time between refills. Similarly, there is little difference in magnitude between restricting at least monthly and restricting during the last year. This indicates that most people who restrict do so relatively frequently.
In the above analyses, we used the average co-payment. We conducted a sensitivity analysis in which we calculated a person’s minimum co-payment, assuming they always attempted to minimize their co-payment amount. The results, which are available upon request, were very robust to the method of calculating co-payment.
In addition to co-payments, Tables 1 and 2 show that age, marital status, and health status, measured according to SF-12 domains, were consistently related to cost-related underuse. Adults over the age of 65 were statistically less likely to report cost-related underuse that adults 50–64 years of age. Marital status was negatively associated with cost-related underuse, while women were more likely to report cost-related underuse. This suggests that there may be additional ways to address cost-related underuse than by solely focusing on the co-payment.
Income was frequently, but not consistently, negatively related to cost-related underuse. In general, as income increased, the odds of reporting cost-related underuse decreased. Few chronic conditions were consistently related to cost-related underuse. Although the multivariate models included dummy variables for each of the conditions, we do not report them in Tables 1 and 2 to make the tables easier to read. In addition, the large number of conditions, small sample sizes and moderate correlations between some of them, make the condition-specific information challenging to interpret. Elsewhere we report that cost-related underuse was higher for medications for symptoms than preventive medications (Piette et al., Reference Piette, Heisler and Wagner2006).
Discussion
Patients who reported paying higher co-payments were substantially more likely to report cost-related medication underuse. People with co-payments of $30 or more had 4.5 higher odds of underusing medication due to cost in the last year than people whose co-payment was less than $5. Although not immediately evident in Figure 1, the results in Tables 1 and 2 suggest that there is a threshold around $15 to $25; a more precise threshold is not possible with the current sample, but, even if it were, it may be misleading because of changes in the cost of medications since these data were collected. This threshold is similar to the results from Roblin et al. (Reference Roblin, Platt, Goodman, Hsu, Nelson, Smith, Andrade and Soumerai2005) who analyzed data from the late 1990s and found that $10 was the threshold for adherence with oral hypglycemics.
Cost-related underuse is problematic because patients do not get therapeutic doses of medication and this leads to worse health outcomes. Prior research suggest that cost-related underuse is associated with increased emergency department visits, nursing home admissions, acute psychiatric hospitalizations, and decrements in self-reported health status (Soumerai et al., Reference Soumerai, Avorn, Ross-Degnan and Gortmaker1987; Soumerai et al., Reference Soumerai, McLaughlin, Ross-Degnan, Casteris and Bollini1994; Soumerai et al., Reference Soumerai, Ross-Degnan, Avorn, McLaughlin and Choodnovskiy1991; Tamblyn et al., Reference Tamblyn, Laprise, Hanley, Abrahamowicz, Scott, Mayo, Hurley, Grad, Latimer, Perreault, McLeod, Huang, Larochelle and Mallet2001; Melfi et al., Reference Melfi, Chawla, Croghan, Hanna, Kennedy and Sredl1998). There is also some new evidence to suggest that attempts to shift costs to patients may backfire, resulting in greater overall health care costs. Hsu and colleagues (Reference Hsu, Price, Huang, Brand, Fung, Hui, Fireman, Newhouse and Selby2006) analyzed data from Kaiser Permanente, comparing people with a prescription drug cap to those without. They found that caps did affect utilization of medications, but that these savings were offset by greater hospital and emergency department utilization. This offset was observed in a single year, and given that many prescription medications can prevent serious long-term complications, it may turn out that caps are cost-ineffective when considering cost offsets over more than one year.
Efforts to reduce cost-related underuse by lowering co-payments seems unlikely in the near term, given the widespread trend to increase co-payments and patient cost-sharing. If the trend increases, then we will likely see more people reporting cost-related underuse. This may sound pessimistic, but the problem does not lay with the co-payments per se, but rather with the connection between the co-payments and the clinical benefit. When patients are using essential drugs for chronic conditions, tiered co-payments may be helpful in steering patients toward generic medication. But as Hsu and colleagues (Reference Hsu, Price, Huang, Brand, Fung, Hui, Fireman, Newhouse and Selby2006) showed, efforts to reduce costs in the near term by increasing patient cost sharing may backfire in the long run.
Given that patients respond to co-payments, developing a value-based insurance design may hold the most promise (Fendrick et al., Reference Fendrick, Smith, Chernew and Shah2001; Neumann et al., Reference Neumann, Lin, Greenberg, Berger, Teutsch, Mansley, Weinstein and Rosen2006; Goldman and Lakdawalla, Reference Goldman and Lakdawalla2002; Goldman et al., Reference Goldman, Joyce and Karaca-Mandic2006; Kleinke, Reference Kleinke2004). Co-payments in a value-based design are aligned with the cost-effectiveness data such that there are no co-payments for treatments that have been shown to be cost effective. The co-payment then increases as the net benefits of a treatment decrease. A number of employers are exploring this option, and the preliminary results are encouraging (Rosen, Reference Rosen2006).
Another option that may partially alleviate cost-related medication underuse is to get health providers more involved in the patient’s decision to underuse medication. Currently, only a third of patients report talking to their physician prior to underusing their medication (Piette, Heisler, and Wagner, 2004). Patient–provider communication may lead to improved adherence by informing the patient about the importance of the medication or by minimizing the number of more expensive branded medications. It is not clear how patients choose which medications to underuse, although data suggest that patients are more likely to underuse medications for symptomatic and not-life threatening conditions (Piette, Heisler, and Wagner, Reference Piette, Heisler and Wagner2006). Therefore, improving patient–provider communication might also help the patients identify the clinical value of their medications and which medications can be underused, if necessary. It is not clear whether providers could handle the additional time involved in extensive conversations with patients about their regimens and drug coverage. Some larger health care systems may be able provide this counselling with the help of health educators, social workers, or other allied health staff. Although patients’ health care teams inevitably must assume a central role in educating patients about their medications, placing the burden of counselling to prevent cost-related underuse solely on to provider organizations creates a patchwork of systems, that may exacerbate current disparities in care.
One limitation of this study is its reliance on self-reported data. The accuracy of self-reported data is a function of the underlying cognitive capacity of the respondents and the questions being asked of them, and these factors can vary within and across samples (Bhandari and Wagner, Reference Bhandari and Wagner2006). In the current study, we did not attempt to ascertain the names of specific medications that patients were using, whether a given medication was branded or generic, or whether their drug coverage used a tiered benefit structure and how that may have affected their adherence. Co-payment levels were also based on self-report data, and although all of the respondents were taking at least one medication, approximately a quarter reported that they did not know the co-payment amount.
In summary, co-payments for prescription medication may be useful in encouraging people to use generic medications instead of more expensive branded drugs. Yet, using co-payments to dissuade patients to stop using medications with marginal clinical value seems problematic given that patients are not fully informed. Efforts to inform patients through improved patient–provider communication may help. Yet, the most promise is with value-based insurance design, which result in low (or no) co-payments when evidence shows a strong relationship between taking the medication and improvements in health outcomes. Value-based designs would not eliminate all cost-related underuse, but they would focus on minimizing cost-related underuse in illnesses where this behaviour results in worse outcomes and higher costs.