Gelatinases A and B are members of the matrix metalloproteinase (MMP) family that initiates degradation of native fibrillar components of vertebrate extracellular matrix (ECM). These ECM-degrading proteinases are up-regulated in diverse human diseases including rheumatoid arthritis and cancer and high level of them are often correlated with poor prognosis in human patients (Page-McCaw et al. Reference Page-McCaw, Ewald and Werb2007). Relatively less attention has been focused on the physiological role of these proteinases in tissue remodelling. Involution of mammary gland indicates that the rate of mammary cell proliferation is exceeded by the rate of cell death, leading to a gradual decrease in the parenchymal mass in the udder (Capuco et al. Reference Capuco, Wood, Baldwin, McLeod and Paape2001). Premature apoptosis of mammary epithelial cell was observed when basement membrane was partially degraded (Akers, Reference Akers and Akers2002). Therefore, dynamic turnover of ECM is presumed to play a crucial role in the progression of mammary gland involution.
However, remodelling of mammary architecture during the dry period of dairy animals cannot be properly revealed by morphological and histological examination (Holst et al. Reference Holst, Hurley and Nelson1987; Sordillo & Nickerson, Reference Sordillo and Nickerson1988). A relatively low degree of alveolar disintegration was observed under the microscope as contrasted to the extensive DNA fragmentation detected on bovine mammary tissue in a short interval after cessation of milking (Wilde et al. Reference Wilde, Knight and Flint1999). Profiling ECM-degrading proteinases of mammary secretion might be informative about the actual turnover of glandular matrix during the transition period and may form a basis for future profitable lactation cycle manipulation.
Our previous study on goats demonstrated a correlation between milk plasmin (EC 3·4·21·7) and caseinolysis (Weng et al. Reference Weng, Chang, Chen, Chou, Peh and Huang2006). Since the activation mechanisms of MMP family involve an initiation step by plasmin (Cuzner & Opdenakker, Reference Cuzner and Opdenakker1999) the same research group subsequently reported a correlation of milk gelatinolytic capacity with time in lactation or milk somatic cell counts (SCC) (Chen et al. Reference Chen, Weng, Chen, Peh, Liu, Yu, Huang, Chen, Nagahata and Chang2007). Studies on the involvement of gelatinase in veterinary diseases indicate that gelatinases are associated with arthritis in the horse (Jouglin et al. Reference Jouglin, Robert, Valette, Gavard, Quintin-Colonna and Denoix2000) and mastitis in cows (Raulo et al. Reference Raulo, Sorsa, Tervahartiala, Latvanen, Pirila, Hirvonen and Maisi2002). The purposes of the present study were to examine the role of gelatinase in the progression of gradual (induced by decreasing milking frequency) and acute (induced by milk stasis) involution of mammary gland in dairy animals. Gelatin zymography was applied for gelatinase phenotyping and specific activity quantification on milk, plasma, milk somatic cells and dry secretions. Potential sources of gelatinases present in mammary secretion during involution were discussed.
Material and Methods
Experimental protocol and care of animals of this study complied with the guidelines of the Animal Welfare Committee of National Chung Hsing University (Taichung, Taiwan).
Gradual involution trial
This trial was conducted in parallel with work published earlier (Weng et al. Reference Weng, Chang, Chen, Chou, Peh and Huang2006). Briefly, 21 Toggenberg and Alpine crossbreed goats (Capra ibex ibex) were selected from a herd of 50 goats in the Experimental Dairy Farm of National Chung Hsing University (Taichung, Taiwan). Goats were routinely fed and hand-milked twice a day. Stepwise decrease of milking frequency, to once a day, once every other day and less, was introduced to individual goats when milk yield dropped to less than one tenth of peak production. Complete stasis was practised within a month. Selected goats were 2–5 months into their second to fourth lactation and were mastitis free based on the latest two consecutive milk reports (total bacterial counts <20 000 cfu/ml and SCC <200 000 cells/ml) (City Bureau of Animal Disease Prevention and Diagnosis, Taichung, Taiwan). Among them, 10 goats were in a regular twice-milking scheme (lactation group) and 11 goats were milked in reduced frequency (involution group). Three goats of the involution group were milked once a day and the remaining 8 goats of this group were dried up 1 week–1 month before the commencement of the trial. Two goats of the lactation group were sampled twice intermittently over 2 months, while all the other experimental goats were sampled once during the study period. Sampling was conducted aseptically prior to the afternoon feeding. Overall 12 regular milk samples and 11 involution secretion samples were obtained. Jugular blood samples were simultaneously collected into heparinized tubes. Within 15 min of collection, goat milk was skimmed (2000 g at room temperature for 20 min) and decaseinated by centrifuging at 100 000 g centrifuge at 4°C for 1 h. Aliquots of original, skimmed and decaseinated milk samples, and goat milk whey were stored at −70°C in 1-ml eppendorf tubes until analysis.
Acute involution trial
Six Holstein cows housed in the Experimental Dairy Farm of National Chung Hsing University were used in the second trial. These cows produced about 5 kg milk/d at the time of study and were mastitis free judged from udder exterior appearance and milk quality records. They were transferred to the dry stall immediately after the last milking where Bermuda hay (4 kg/d) was fed as a supplement to a 2 kg/d of dry cow concentrate containing 16% crude protein. Sampling was conducted prior to afternoon feeding; the first few strips of udder secretion were discarded and about 20 ml of sample were collected by hand. Samples were collected at dry-off (week 0) and weekly thereafter (week 1 to week 3). No appreciable amounts of udder secretion were collectable at week 4. Sampling and laboratory processing were performed aseptically and samples of dry secretion were processed as described for the gradual involution trial.
Estimation of casein ratio
Samples of goat milk or involution secretion from the gradual involution trial were subjected to estimation of casein ratio, which was presumed to reflect the progression of gradual involution of mammary gland. Skimmed serum and the homologous decaseinated supernatant were determined for protein content using a dye-binding based (Bradford, Reference Bradford1976) commercial kit (Bio-Rad Laboratories Inc., Hercules CA, USA). Casein ratio was calculated as the difference in protein content between skimmed serum and decaseinated whey over the protein content of skimmed serum.
Preparation of milk somatic cells
Somatic cells were isolated from samples of goat milk and involution secretion of the gradual involution trial by first filtering through sterile cheesecloth to remove visible colloidal solids and then diluting with equal volume of sterile DPBS devoid of Ca2+ and Mg2+ (Sigma-Aldrich Chemicals, St. Louis MO, USA). Cell pellet recovered after centrifuging at 500 g at 25°C for 20 min was washed twice with DPBS and finally suspended in Hank's balanced salts solution (HBSS) containing Ca2+ and Mg2+ (Sigma-Aldrich). Suspensions of dispersive cells with no silky clustering were regarded as satisfactory for analyses. Total cell count and differential cell typing were conducted on cell suspension as previously described (Tian et al. Reference Tian, Chang, Chiang, Peh, Huang, Lee and Zhao2005).
An incubation study slightly modified from that of Tian et al. (Reference Tian, Chang, Chiang, Peh, Huang, Lee and Zhao2005) was used to estimate the spontaneous degranulation capacity of milk somatic cells. In brief, the fraction of HBSS cell suspension containing 2×10⁶ somatic cells was conditioned at 37°C without exogenous stimulant for 1 h. Cell-free conditioned medium was recovered by centrifuging at 2000 g at 25°C for 10 min and subjected to gelatin zymography.
Somatic cells were also lysed using a lysis buffer containing 50 mm-Tris–HCl, 1 % NP-40, 150 mm-NaCl, 1 mm-EDTA, pH 7·4 mixed with proteinase inhibitor solutions (1 mm-PMSF, 1 mm-EDTA, leupeptin 1 μg/ml, aprotinin 1 μg/ml, pepstatin 1 μg/ml) and phosphatase inhibitor (1 mm-NaF) immediately before use. Lysis mixture (5×10⁶ cells/ml) was incubated with occasional shaking on ice for 20 min. Cell lysate collected by centrifuging at 37 800 g at 4°C for 15 min was allocated (2×10⁶ cells/vial), stored at −80°C and subjected to gelatin zymography within 1 week.
Gelatin zymography
Decaseinated goat milk whey, goat plasma and skimmed cow milk serum were appropriately diluted with PBS buffer (138 mm-NaCl, 27 mm-KCl, pH 7·4) before being subjected to electrophoresis. Aliquots of decaseinated goat milk whey (of 6·4 μg protein), goat plasma (of 160 μg protein), and skimmed cow milk serum (of 100 μg protein), respectively, were applied for a non-reducing, 10 % SDS PAGE (Laemmli, Reference Laemmli1970) where 0·3% gelatin was included in the separating gel (Tian et al. Reference Tian, Chang, Chiang, Peh, Huang, Lee and Zhao2005). After electrophoresis, gel was soaked for 30 min in renaturing solution (2·5 % Triton X-100), washed with sufficient distilled H2O and then developed in 50 mm-Tris buffer (200 mm-NaCl, 0·02 % Brij-35, 5 mm-CaCl2, pH 7·4,) at 37°C for 16 h. Gelatinase standard (Chemicon International, Temecula CA, USA), molecular weight markers (Bio-Rad) and volunteer's blood sample were loaded in parallel for phenotyping (Makowski & Ramsby, Reference Makowski and Ramsby1996) and validating quantification.
Quantification of the photographic negative band on the zymogram was performed by using TotalLab software (v. 1·11, Ultra Lum Inc., Claremont CA, USA) and calibrated with reference blood.
Statistical analysis
Statistical analysis was performed using the PROC GLM procedure of SAS Institute Inc., (SAS Inst. Inc., Cary NC, USA). Differences between groups of goats (lactation or involution) were tested on the least square means (LSM) of total protein, casein ratio, and specific capacity of gelatinase of milk (or involution secretion), plasma and degranulation medium/lysate of milk somatic cells. Variations of individual animal, parity, milk yield and days in milk were included in the error term. Similar analysis was carried out in cows during weeks after milk stasis (weeks 0, 1, 2 and 3) on the specific capacity of gelatinase of dry secretion, which was transformed into folds relative to that of week 0 within cows to reduce heterogeneity of animals.
Results
Qualitative and quantitative validation of gelatin zymography
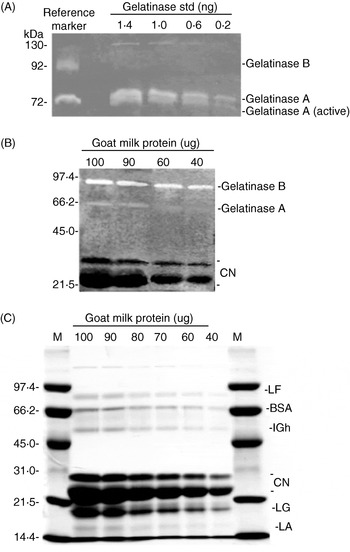
Zymography serves to characterize proteinases qualitatively based on substrate specificity and molecular weight. Since zymographic procedures separate proteinase from potential co-existing inhibitors, the hindered catalytic site of latent proteinase is exposed, digested bands of both latent and active forms of gelatinase A, with reference to volunteer's blood, were detectable in commercial gelatinase standard (Fig. 1A). Although gelatinase B was apparently not included in commercial gelatinase standard, it constituted the major gelatinase subtype of a typical goat milk (Fig. 1B) as cross-referenced to molecular weight standard on a parallel SDS-PAGE (Fig. 1C). The intensity of gelatinase band on zymogram, therefore, reflects capacity rather than activity in vivo.
Qualitative and quantitative validation of gelatin zymography using gelatinase standard and a representative goat milk sample. (A) Gelatin zymogram of gelatinase standard applied in serial amounts from 0·2 to 1·4 ng with reference to a human plasma marker. (B) A representative gelatin zymogram of goat mammary secretion sample applied in serial content of protein from 40 to 100 μg after skimming and decaseination. (C) Paralleling SDS-PAGE of the same goat mammary secretion sample as in (B). LF, BSA, IGh, CN, LG and LA indicate lactoferrin, serum albumin, immunoglobulin heavy chain, caseins, β-lactoglobulin and α-lactalbumin, respectively.

The semi-quantitative nature of zymography was evaluated by loading serial quantities of gelatinase standard (0·2–1·4 ng protein, Fig. 1A) and a typical goat milk whey sample (40–100 μg protein, Fig. 1B). The Intensity of casein band (21–24 kDa) visible on the parallel gels of zymography (Fig. 1B) and SDS-PAGE (Fig. 1C) increased with increasing loading amount of whey protein which validated the zymographic procedure of this study.
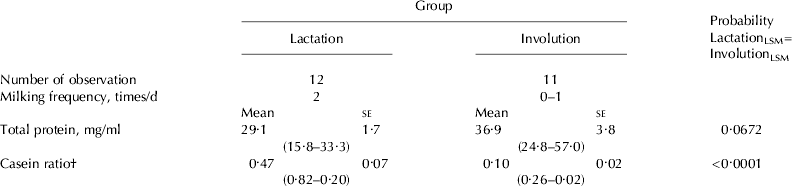
Casein ratio of goat milk and involution secretion
In the gradual involution trial milking frequency was used as the criteria to group goats (Table 1). Protein content of involution secretion tended (P=0·067) to be higher than the milk protein content of the lactation group, and broad individual variation was noticed. The casein ratio of milk, on the contrary, was highly significantly (P<0·0001) greater than that of involution secretion. Casein represented 20–82% of total milk protein in the lactation group while only 2–26% of protein of involution secretion was represented by casein. Therefore, in spite of all the goats of the lactation group being regularly milked during the study, they varied greatly in the production status of the mammary gland.
Total protein and casein ratio† (range) of mammary gland secretion of experimental goats
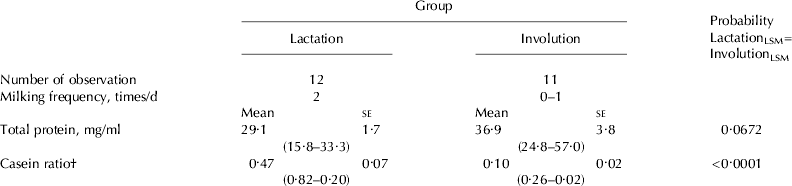
† Casein ratio:the ratio of ultracentrifuge-precipitated casein to total protein of mammary secretion
Specific capacity of gelatinase in goat milk and involution secretion
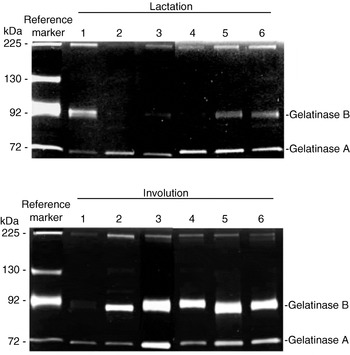
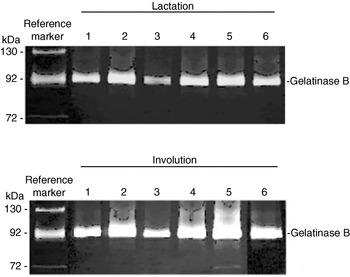
Zymograms of goat milk samples and involution secretion samples from six representative goats of each group are shown in Fig. 2. Each sample was loaded with the same amount of decaseinated whey protein as described in Material and Methods. The 72-kDa gelatinase A, cross-referenced to the four subtypes in volunteer's blood, was found to be constitutive in both milk and involution secretion. The 92-kDa gelatinase B was apparently more prevalent and greater in intensity in involution secretion than in milk. There were exceptional goats within the group that were not typical, for example, goats no. 5 & no. 6 in the lactation group showed slight gelatinase B band whereas goat no. 1 of the involution group expressed no visible gelatinase B band (Fig. 2).
Gelatin zymograms of mammary secretion samples from six representative goats in each of the lactation and involution group. Volunteer's plasma was used as reference marker to indicate gelatinase subtypes.

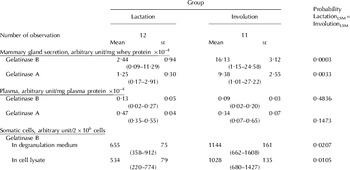
After normalization to reference markers, LSM of specific capacities of gelatinases of 12 milk samples and 11 involution secretion samples expressed as arbitrary units of scanned intensity per mg protein loaded are shown in Table 2. Capacity of gelatinase A was about half the abundance of gelatinase B in goat milk as well as in goat involution secretion. Specific capacities of both gelatinases A and B were significantly (P<0·01) higher in goat involution secretion than in goat milk.
Specific capacities of gelatinases (range) of mammary gland secretion, plasma and degranulation medium/lysate of somatic cells of experimental goats

Specific capacity of gelatinase in blood of goats
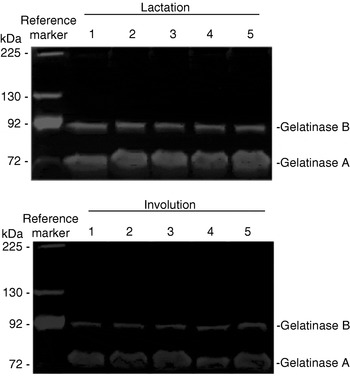
Zymograms of plasma samples of five representative goats from each of the lactation or involution groups are shown in Fig. 3. Each sample was loaded with the same amount of plasma protein as described in Material and Methods. Contrary to what was observed in goat involution secretion, gelatinase A was much more abundant than gelatinase B regardless of groups.
Gelatin zymograms of plasma samples from five representative goats of each lactation and involution group. Volunteer's plasma was used as reference marker to indicate gelatinase subtypes.

After normalization, LSM of specific capacities of gelatinases of 12 and 11 plasma samples of goats of lactation and involution group, respectively, expressed as scanned intensity per mg plasma protein loaded are shown in Table 2. Neither of the specific capacities of gelatinase A or B in plasma was significantly different for goats of either lactation or involution group (P>0·05).
Specific capacity of gelatinase in somatic cells of goat milk and involution secretion
Cell typing of somatic cells indicated that PMN was by far the most populated cell type in goat milk and goat involution secretion. It represented more than 85% of total somatic cells and fluctuated 1·7-fold among all samples.
Zymograms of spontaneous degranulation medium from six representative goats of the lactation or involution groups are shown in Fig. 4. Degranulation medium or cell lysate equivalent to 2×10⁶ milk somatic cells was loaded as described in Material and Methods. Results indicated that the 92-kDa gelatinase B was the only gelatinase subtype detectable for somatic cells whether from milk or involution secretion. Similar results were observed for zymograms of somatic cell lysate from either the lactation or involution group (zymograms not shown).
Gelatin zymograms of milk somatic cell degranulation medium (2×10⁶ cells) prepared from six representative goats in each of the lactation group and involution group. Volunteer's plasma was used as reference marker to indicate gelatinase subtypes.

After normalization, LSM of specific capacity of gelatinase B per 2×10⁶ somatic cells from 12 milk samples and 11 involution samples of goats, respectively, are shown in Table 2. Both approaches resulted in greater specific gelatinase B capacity in somatic cells of involution secretion than in milk, about 1·75 folds (P=0·02) by degranulation study and 1·93 folds (P=0·01) by lysis study, respectively.
Specific capacity of gelatinase in dry secretion of cows
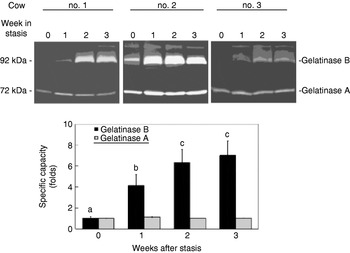
Cows were used as an animal model to profile the chronological change of gelatinase specific capacity of dry secretion during milk stasis-induced acute involution. As was noticed in representative zymograms of three cows displayed individually in Fig. 5, the specific capacity of 92-kDa gelatinase B in dry secretion increased gradually along with the advancement of acute involution but was not observed for 72-kDa gelatinase A. After transformation of the scanned intensity of gelatinase band into folds relative to that of corresponding band of week 0 within cows, the LSM of specific capacity of gelatinase B of dry secretion increased significantly (n=6, P<0·05) to about 4 folds at week 1 and about 7 folds at week 2 and week 3 relative to week 0.
Gelatin zymograms of dry secretion samples from three representative cows immediately following milk stasis. The photonegative bands were scanned, integrated and normalized with reference marker. a,b,cSignificant difference (P<0·05) among weeks is indicated by different letters. Each bar represents mean±se of 6 cows.

Discussion
A dry period of 40–60 d is thought indispensable in cows for optimal milk production of next lactation (Grummer & Rastani, Reference Grummer and Rastani2004). Milk cessation is thought to accelerate mammary secretory cell turnover, which would otherwise be insufficient and less efficient. A recent study indicated that continuous milking reduced subsequent milk yield in primiparous cows through altered mammary epithelial cell turnover and secretory capacity. These negative effects of continuous milking on the subsequent lactation of primiparous cows were not alleviated by bST (Annen et al. Reference Annen, Fitzgerald, Gentry, McGuire, Capuco, Baumgard and Collier2007). The benefit of the dry period, however, is uncertain for dairy goats (Annen et al. Reference Annen, Collier, McGuire and Vicini2004). On the other hand, ECM of mammary gland is also subject to dynamic remodelling throughout the lactation cycle (Capuco & Akers, Reference Capuco and Akers1999) and slight alteration of ECM microenvironment exerts great impacts on the survival and function of mammary epithelial cell (Akers, Reference Akers and Akers2002). Although it has long been recognized that the alveolar structure of bovine mammary gland is largely maintained for several weeks after involution, which is in great contrast to rodents (Capuco & Akers, Reference Capuco and Akers1999) the actual rate of ECM degradation of mammary gland during involution remained ill-defined. Our basic postulation for this study was that the capacity of gelatinases of mammary secretion reflects the remodelling of mammary glandular structure under either spontaneous gradual or stasis-induced acute involution. Moreover, milk somatic cells contribute a significant part of the overall gelatinase capacity of mammary secretion. We used goats receiving different milking frequencies, according to their production status in regular lactation cycle, to serve as the model of gradual mammary gland involution. We further used cows, producing less than 5 kg/d and receiving an immediate milk stasis, to serve as the model of acute mammary gland involution. Results of our trials indicate a significant elevation of protein content-adjusted gelatinase capacity in milk during gradual involution and in dry secretion of an established non-lactating gland.
In the gradual involution trial, the production status among individual goats in the lactation group was not homogenous as reflected by the broad range of content of total milk protein and casein ratio (Table 1). Our observation is consistent with the results of an earlier study indicating that goat milk is inherently lower and more variable in casein ratio than cow milk because the casein micelle of the former is smaller and less homogenous in size (Renner, Reference Renner1982). Furthermore, the length of lactation of dairy goats has been reported to vary significantly among individuals, breeds, seasons and parturition frequency (Salama et al. Reference Salama, Caja, Such, Casals and Albanell2005) possibly related to the reported fact that goats differ greatly in rate of yield decline during late lactation and, consequently, lactation length (Faurschou & Borregaard, Reference Faurschou and Borregaard2003; Sanchez et al. Reference Sanchez, Sierra, Luengo, Corrales, Morales, Contreras and Gonzalo2006). This is, however, desirable considering the original design for this trial was to cover a long term and gradual progression of involution of goat mammary gland. Several goats in the lactation group expressed casein ratio that out-skirted the lower end of casein ratio range reported for goats (Renner, Reference Renner1982). Since casein-synthesis capacity of mammary epithelial cells decreases and casein hydrolysis accelerates with regression of mammary function, we postulate that goats, while receiving regular twice-daily milking scheme in this study but with low casein ratio, are representatives of those at a late stage of lactation. The slight gelatinase B capacity detected in milk of some goats in the lactation group (Fig. 2) is consistent with the results of casein ration (Table 1). In combining both results, it is suggested that early involution of mammary gland probably appears during late lactation.
Compared with the lactation group, goats of the involution group were even more heterogeneous in production status, i.e., 3 in the reduced milking frequency scheme and 8 at 1 week to 1 month to the last milking. Casein ratio of the involution secretion of this group was considerably lower (Table 1) and specific capacities of gelatinases A and B of involution secretion were higher (Table 2). Again, a seemingly negative trend between casein ratio and gelatinase level of mammary secretion was noticed as in the gradual involution trial. The observation of greater overall specific capacities of gelatinases in mammary secretion of goats during gradual involution was similarly observed in mammary secretion of dry cows (Fig. 5), where specific capacity of gelatinase B in dry secretion increased with weeks after milk stasis. Altogether, the results of these two trials demonstrate that the regional accretion of gelatinase in mammary secretion was closely associated with mammary tissue remodelling.
In both the gradual and the acute involution trials, capacity of gelatinase B in mammary secretion apparently overrode that of gelatinase A during involution, while a reverse order was present in regular milk (Fig. 2) and most week-0 dry secretion (Fig. 5). The pattern of gelatinase subtype reported in this study for involution samples is similar to that found for mastitic milk of cows (Raulo et al. Reference Raulo, Sorsa, Tervahartiala, Latvanen, Pirila, Hirvonen and Maisi2002). Synovial fluids of horses with articular cartilage alterations, however, contained a much higher capacity of gelatinase A compared with gelatinase B (Jouglin et al. Reference Jouglin, Robert, Valette, Gavard, Quintin-Colonna and Denoix2000). Nevertheless, it was the level of gelatinase B that was reported to be correlated with the severity of lesion (Jouglin et al. Reference Jouglin, Robert, Valette, Gavard, Quintin-Colonna and Denoix2000). The regulatory functions of gelatinase can be initiated by a minimal change of amounts. Gelatinases are capable of activating signals through proteolysis of ECM components and adhesion factors (Atkinson & Senior, Reference Atkinson and Senior2003). The interaction between MMP proteolytic activity and the multifaceted functions of tissue inhibitors of metalloproteinases (TIMP) collaboratively modify the ECM environment and the breakdown of connective tissue barriers (Visse & Nagase, Reference Visse and Nagase2003). Therefore, fine tuning of gelatinase activity might in many cases also be very critical in tissue remodelling.
Our study also attempted to explore the extent of contribution of somatic cells to the accreted gelatinase B in milk Although many intrinsic cells of organs can be stimulated to produce gelatinase B, much of the information regarding gelatinase B in remodelling tissues deals with gelatinase B from inflammatory cells (Atkinson & Senior, Reference Atkinson and Senior2003). Being the most abundant and fluctuating gelatinase B subtype in milk after stasis, gelatinase B was considered to be mainly derived from infiltrated PMN of all milk somatic cells during involution. It is the basis on which the gelatinase B content of milk somatic cells was evaluated in this study. As the major defence mechanism against infection of the mammary gland, PMN constitutes the primary granulocytes of somatic cells of goats during late lactation and the dry period (Su et al. Reference Su, Chang, Peh, Lee, Huang and Zhao2002; Tian et al. Reference Tian, Chang, Chiang, Peh, Huang, Lee and Zhao2005). Gelatinase B was released by PMN prior to recruitment (Shuster et al. Reference Shuster, Lee and Kehrli1996). A correlation of gelatinase B level with PMN count in infected human synovial fluid has been reported (Makowski & Ramsby, Reference Makowski and Ramsby2003). Studies on the production of gelatinase B by leucocytes from human type-1 diabetic patients demonstrated the role of leucocytes in pathogenesis and complications of this disease (Xue et al. Reference Xue, Thompson, Clifton-Bligh, Fulcher, Gallery and Jackson2005). In our study, somatic cells were the only cellular component evaluated for gelatinase expression besides other humoral components (milk, involution secretion, dry secretion and plasma). We confirmed that gelatinase B was the only gelatinase subtype contained and released in appreciable amounts in somatic cells of goat milk and involution secretion (Fig. 4). However, our study detected only slightly greater gelatinase B releasing-potential in somatic cells (Table 2) during involution than during lactation, as compared with the massive accretion of gelatinase B in involution secretion. Since the release of gelatinase B from PMN is instantaneous and spontaneous, our results might have underestimated these values owing to artifacts caused in preparing somatic cells. Since gelatinase B capacity of milk somatic cells was expressed based on cell number (2×10⁶ cells) in this study, contribution of somatic cells to gelatinase B in mammary secretion during involution might have been attenuated considering the apparently highly condensed and significant amount of total SCC especially after milk stasis. Nevertheless, the contribution of gelatinase B from stromal and epithelial cells of mammary gland cannot be overlooked.
Conclusion
This study demonstrated that gelatinase B selectively accumulated in mammary secretion is related to decreasing milking frequency and milk stasis and is associated with actual mammary tissue remodelling. PMN of milk somatic cells is a potential source of gelatinase B in mammary secretion during involution. Our results provide a rational basis for applying a potential inhibitor to intervene in gelatinase expression in mammary gland for profitable lactation/involution cycle manipulation, as is currently under intensive study for chemotherapeutic purpose in human tumour progression (Annabi et al. Reference Annabi, Currie, Moghrabi and Beliveau2007; Jeong et al. Reference Jeong, Lee, Yoon and Lee2007; Strek et al. Reference Strek, Gorlach, Podsedek, Sosnowska, Koziolkiewicz, Hrabec and Hrabec2007).
This work was supported by National Science Council (NSC92-2313-B005-121) and Council of Agriculture (COA 050101U110), Taiwan, Republic of China.