I. INTRODUCTION
In the past decades, many efforts have been focused on the synthesis and property studies of TiO2 photocatalysts for designing, selecting, and developing highly reactive photocatalysts due to its wide band gap, strong oxidizing power, long-term stability against photo and chemical corrosion, low cost, and low toxicity. Reference Fox and Dulay1–Reference Xu, Bao and Zhang6 It has been well documented that besides chemical compositions, the structural and morphology properties, such as the size, shape, and crystal planes, also greatly influence the performance of photocatalysts. TiO2 nanocrystals, especially those with sizes within sub-10 nm, exhibit superior photocatalytic activity to the corresponding bulk material, due to their unique shape/size depended properties, surface effect, and quantum confinement effect. Reference Anpo, Shima, Kodama and Kubokawa7,Reference Kormann, Bahnemann and Hoffmann8
However, there are still some technical difficulties in the practical applications of these TiO2 nanocrystals as photocatalysts in the field of water treatments. First, many successful synthetic method of TiO2 nanocrystals adopts the nonaqueous system or use some organic capping agents, such as oleylamine, Reference Dinh, Nguyen, Kleitz and Do9 CTAB, and hexamethylenetetramine. Reference Li, Yu, Chen and Xu10 As a result, the synthesized TiO2 nanocrystals have a hydrophobic surface, which prevents the dispersion of the TiO2 nanocrystals in polar solvent and limits their application in water. Second, it is difficult to separate and recycle the photocatalysts after photocatalytic treatment due to the tiny size of TiO2 nanocrystals, which cost additional energy to separate these particles from wastewater.
Aiming at addressing these problems, magnetic photocatalysts, the photoactive TiO2 nanoparticles coated on the surface of the magnetic core, have been used, which have attracted considerable interests for their easy separation ability from the suspended solution. The synthesis approaches for Fe3O4@TiO2 magnetic photocatalysts include the sol–gel method, Reference Li, Zhang, Guo and Wang11 template method, Reference Xuan, Jiang, Gong, Hu and Chen12,Reference Agrawal, Gupta, Pich, Zafeiropoulos, Rubio-Retama, Jehnichen and Stamm13 hydrolysis method, Reference Ma, Zhang, Li, You, Zhang, Zhang, Li, Yu, Guo and Lu14 etc. Herein, a facile straight dipping approach has been applied to construct magnetic photocatalysts containing sub-10-nm TiO2 nanocrystals with two different morphologies. Through this approach, hydrophobic monodisperse TiO2 nanocrystals were coated on the surface of Fe3O4 hollow spheres by electrostatic adsorption to form core–shell magnetic photocatalysts which show excellent photocatalytic performance and high recycling ability under magnetic field.
In this work, the photocatalytic performance of the magnetic photocatalysts was examined by six different pollutant degradation reactions. A comparative study has been carried out between TiO2 nanoparticles and TiO2 nanorods, which demonstrates that catalysts containing TiO2 nanorods with high surface energy show better photocatalytic performances than the catalysts containing TiO2 nanoparticles. Furthermore, several Fe3O4@TiO2 magnetic photocatalysts were prepared by the sol–gel method, template method, and hydrolysis method, as comparisons. Compared with the comparisons, the magnetic photocatalysts containing sub-10-nm TiO2 nanocrystals show superior photocatalytic activities due to the strong quantum size effect.
II. EXPERIMENTAL SECTION
A. Materials
Ferric chloride hexahydrate (FeCl3 6H2O), sodium acetate (NaAc), ethylene glycol, cyclohexane, and methyl red are from Tianjin YongDa Chemical Reagent Company Limited (China). Acetic acid, ammonium bicarbonate (NH4HCO3), tetrabutyl orthotitanate (TBT), oleic acid (OA), ammonia (NH3H2O), triethylamine, hydrogen peroxide (H2O2), methylene blue, and methyl orange are from Beijing Chemical Plant (Beijing, China). Dodecyl sulfate sodium salt (SDS), polyethylene glycol 6000 (PEG6000), phenol, malachite green, and rhodamine B are from Tianjin FuChen Chemical Reagent Company Limited (China). All raw materials are of analytical grade and without further purification. Deionized water is used throughout all processes.
B. Preparation of Fe3O4 magnetic particle
Fe3O4 nanoparticles were obtained by the solvothermal method using glycol as the reducing agent.15 Briefly, FeCl3·6H2O (3.0 mmol), NaAc·3H2O (15.0 mmol), SDS (4.0 mmol), PEG (0.4 g, ∼7 mmol of the repeating units), and HAc (0.4 mL) were added to ethylene glycol (25 mL) to obtain an orange colloid mixture under vigorous stirring at room temperature. Then, put the mixture into a Teflon-lined stainless-steel autoclave of 50 mL capacity at 200 °C for 20 h and cool it down in ambient naturally. The obtained products were washed several times with pure ethanol and dried for further use.
C. Preparation of TiO2 nanoparticles and nanorods
The syntheses of TiO2 nanoparticles and nanorods are according to the predecessor's article. Reference Li, Peng, Yi, Wang and Li16 To obtain the TiO2 nanoparticles, 1 g of NH4HCO3, 25 mL of oleic acid (OA), 5 mL of triethylamine, and 5 mL of cyclohexane were dissolved in a beaker with strong magnetic stirring to get a uniform mixture. Afterward, another 1 mL of TBT was added into the solution drop by drop. Mix them up until it becomes uniform and then transfer it into a Teflon-lined stainless autoclave at 150 °C for 24 h. The way to get TiO2 nanorods is similar to nanoparticles but for NH4HCO3. OA (7 mL), triethylamine (5 mL), and cyclohexane (20 mL) were mixed with the help of magnetic stirring. After that, TBT (1 mL) was slowly added dropwise into the mixed solution before sealed in a Teflon-lined stainless autoclave at 180 °C for 24 h. Both nanoparticles and nanorods are cleaned by ethanol and centrifugal separation for 3 times, which we got after the above treatment. Finally, we get the pure TiO2 nanoparticles and nanorods for next section.
D. Preparation of Fe3O4@TiO2 magnetic particles
Straight dipping process was used when the composite particles were made. Fe3O4 (0.1 g), with the hollow structure we obtained above, dispersed into cyclohexane (50 mL) for 1 h with the aid of ultrasonic vibration. Moreover, TiO2 nanoparticles/nanorods (1.5 mmol, ∼0.12 g) were dissolved in another 50 mL cyclohexane and stirred continuously until the nanocrystals dissolved completely. Then blend the two mixtures mentioned above together by ultrasonic vibration for 20 min and dry them in a drying oven at 100 °C. Repeat the above procedure once and wash the products with ethanol and cyclohexane alternately by magnetic separation. In this FT magnetic photocatalysts, the mass ratio of Fe3O4 and TiO2 is nearly 1.
E. Photocatalytic experiment on Fe3O4@TiO2 composite particles
The photocatalytic activities of the products are estimated by the degradation of a series of organics. Some quality of catalysts, some hydrogen peroxide (H2O2), and a certain concentration of the organic were added into a 3-neck flask, stirring for a while before the photocatalytic degradation to ensure the establishment of an adsorption–desorption equilibrium among the photocatalyst, solvent, and the organics. Then the solution was exposed to the 400 w UV radiations with a wave length of 357 nm at room temperature. The degraded samples under UV were taken out for different time intervals and analyzed by the UV spectrophotometer. The photocatalytic activities of FT magnetic composite particles after repeated utilization were also tested. The photocatalysts were recycled with the assistant of external magnetic field and washed by water and ethanol several times. Dry the catalysts out in an oven at 80 °C for the next experiments.
F. Characterization
The samples were characterized by powder x-ray diffraction (XRD) performed on a D8 Focus diffractometer (Bruker, Germany). Transmission electron microscopy (TEM) images were obtained using a JEOL 2010 transmission electron microscope operating at 200 kV (Tokyo, Japan). UV-vis spectra were determined on a Hitachi U3100 UV-vis spectrophotometer (Japan). The specific surface areas of the samples were obtained on a JW-RB24 static nitrogen adsorption analyzer with pretreatment conditions of 2 h calcination at 200 °C.
III. RESULTS AND DISCUSSION
Scheme 1 illustrates the synthesis approach for the Fe3O4@TiO2 (FT) core–shell magnetic photocatalysts via straight dipping process. The synthetic process involves three steps: first, Fe3O4 hollow spheres were synthesized through an ethylene-glycol-assisted hydrothermal method. Second, nearly monodisperse sub-10-nm TiO2 nanoparticles and nanorods were synthesized through a reported oleic-acid-assisted hydrothermal approach. By tuning the content of OA and the water which was decomposed by NH4HCO3 in the synthetic system, TiO2 nanoparticles and nanorods could be selectively synthesized. Reference Li, Peng, Yi, Wang and Li16 Then, TiO2 nanoparticles/nanorods were deposited on Fe3O4 hollow spheres to form FT core–shell photocatalysts by straight dipping process with the assistance of electrostatic interaction between Fe3O4 hollow spheres and TiO2 nanocrystals.
Schematic diagram of the fabrication of FT magnetic photocatalysts.

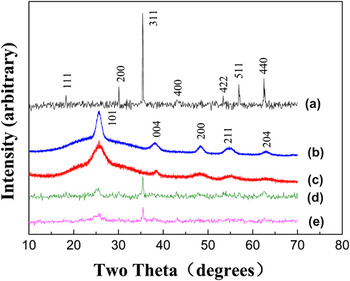
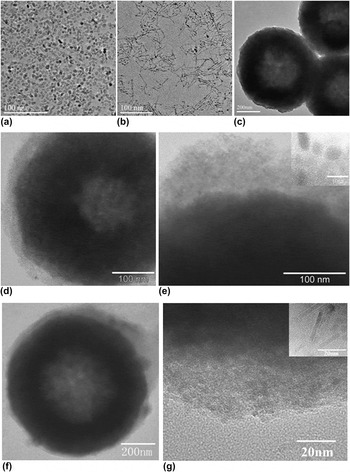
XRD analysis was carried out to investigate the phase purity of as-prepared samples. The XRD patterns shown in Figs. 1(a)–1(c) demonstrate the pure phase of as-synthesized Fe3O4 spheres, TiO2 nanoparticles, and TiO2 nanorods, respectively. All the peaks in Fig. 1(a) can be indexed to the face-centered-cubic phase of Fe3O4 (JCPDS No. 19-629). The diffraction peaks in Figs. 1(b) and 1(c) could be well indexed to anatase-phase TiO2 (JCPDS No. 21-1272), and the broad diffraction peak implies the tiny size of TiO2 samples. XRD patterns for Fe3O4 hollow spheres, TiO2 nanoparticles/nanorods (TNP/TNR), and as-prepared Fe3O4@TiO2 nanoparticles/nanorods (FTNP/FTNR) are compared. Clearly, XRD peaks of Fe3O4@TiO2 photocatalysts [Figs. 1(d) and 1(e)] contain two sets of peaks: one set matching with that of Fe3O4 and the other set matching with that of anatase-phase TiO2. The intensity of diffraction peaks in Figs. 1(d) and 1(e) is lower than that in Figs. 1(a)–1(c), indicating the interaction between TiO2 and Fe3O4. Figure 2 shows typical TEM images of TiO2 nanoparticles/nanorods, Fe3O4 hollow spheres, and as-synthesized magnetic photocatalysts. The average particle size of TiO2 nanoparticles shown in Fig. 2(a) is about 10 nm, whereas as-synthesized TiO2 nanorods show an average diameter of ∼5 nm and a length of about 15 nm [Fig. 2(b)]. TEM images of prepared Fe3O4 powders [Fig. 2(c)] show that magnetic Fe3O4 particles are hollow spheres with an average particle size of about 600 nm. These hollow magnetic spheres were ideal support materials to construct magnetic heterogeneous photocatalysts for their high surface area, low density, and high magnetization. Figures 2(d) and 2(e) show TEM images of as-synthesized magnetic photocatalysts FTNP and the partial enlarged details of a core–shell FTNP sphere. Obvious core–shell structure can be observed from TEM images, indicating that the TiO2 nanoparticles were effectively absorbed on the surface of Fe3O4 hollow spheres. Figures 2(f) and 2(g) showed morphology of FTNR and its enlarged TiO2 layer. The coating layer of TiO2 nanoparticles can be clearly observed, demonstrating that TiO2 nanoparticles were absorbed on the surface of Fe3O4.
XRD patterns of (a) Fe3O4, (b) TiO2 nanoparticles, (c) TiO2 nanorods, (d) FTNP, and (e) FTNR.

TEM images of as-prepared TiO2 nanoparticles (a), TiO2 nanorods (b), Fe3O4 (c), FTNP (d–e), FTNR (f–g).

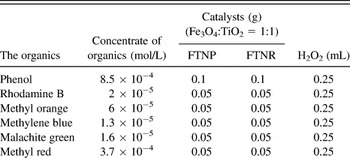
These FTNP/FTNR photocatalysts provide an ideal model system to investigate the morphology effect on photocatalytic properties in nanoscale. TiO2 nanoparticles and TiO2 nanorods were synthesized in almost identical synthetic system expect some variance in the amount of the reactants. As a result, the species adsorbed on the TiO2 nanoparticles and TiO2 nanorods are the same, which could exclude the species influence of adsorbent on their photocatalytic activity. Moreover, both TiO2 nanoparticles and TiO2 nanorods are located at the region of the quantum size level (∼10 nm), which conduces to the investigation on the morphology effect in nanoscale. Based on the above analysis, a series of comparative experiments between FTNP and FTNR were carried out to investigate the morphology effect on the photocatalytic activities. Table I illustrates the concrete data for the quality of catalysts and the concentrate of the organics.
Conditions of different organics' photocatalytic reaction.

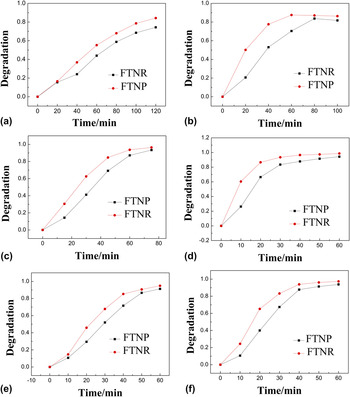
The photocatalytic activities of these magnetic photocatalysts were evaluated by the degradation of six kinds of organic pollutants under UV irradiation, such as phenol, rhodamine B, methyl orange, methyl blue, malachite green, and methyl red. The differences in photocatalytic activities between FTNP and FTNR were illustrated in Fig. 3. It clearly shows that both FTNP and FTNR exhibit high photocatalytic activities for these organic pollutants (maximum conversion 75–100%) and FTNR shows higher photocatalytic activities than FTNP for all six kinds of organic pollutants. For example, in the case of phenol degradation, after UV irradiation, the conversion of phenol is 90% for FTNR, whereas the conversion is 80% for FTNR. Moreover, FTNR shows a faster degradation rate than FTNP in these degradation experiments.
Degradation of methyl red (a), phenol (b), methylene blue (c), rhodamine B (d), methyl orange (e), and malachite green (f) by FTNP and FTNR.

Herein, Langmuir–Hinshelwood kinetic model was applied to study the kinetics in our photocatalytic system. It was well documented that Langmuir–Hinshelwood kinetic model is powerful in addressing the kinetics of the degradation of organics under photoirradiations. Reference Al-Ekabi and Serpone17–Reference Domènech and Peral19 The function between the concentration of the original organics and reaction time can be described as Eq. (1) according to Langmuir–Hinshelwood kinetic model.
 $$- {{{\rm{d}}C} \over {{\rm{d}}t}} = v = {{k \times K \times C} \over {1 + K \times C}}\quad ,$$
where C is the concentrate of organics, t is the reaction time, K is the ratio between the adsorption rate and desorption rate. When the concentration C (mol/L) of the reactant is low (<10−3), the reaction of adsorption occurred slowly (K × C << 1). Reference Laoufi, Tassalit and Bentahar20 Equation (1) could be simplified into the form listed in Eq. (2).
 $$- {{{\rm{d}}C} \over {{\rm{d}}t}} = k \times K \times C\quad .$$
Through a differential transformation, Eq. (3) was acquired.
 $${\rm{ln}}{{{C_{\rm{0}}}} \over C} = k \times K \times t = {K^\prime } \times t\quad ,$$
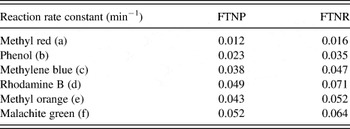
where C 0 is the initial concentration of the organics, K′ is the specific reaction rate constant. The reaction is essentially an apparent first order reaction. Therefore, K′ could be calculated from the slope of the ln(C 0/C) versus t plots. Table II summarized the specific reaction rates for FTNP and FTNR in various degradation processes. For all six degradation processes, the values of K′ for degradation using FTNR as the photocatalyst are higher than that using FTNP as the catalyst. For example, the specific reaction rate of degradation of phenol is 0.035 min−1 for FTNR, which is higher than 0.023 min−1 for FTNP. The kinetics study confirmed that FTNR has a higher reaction rate than FTNP.
Specific reaction rates of different organics under FTNP and FTNR.

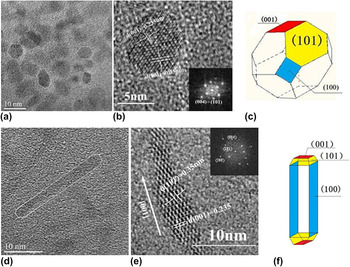
The specific surface areas of Fe3O4@TiO2 nanoparticles and nanorods are 93.96 m2/g and 71.49 m2/g, respectively. The morphology effect was believed to play an important role on their photocatalytic performance. To further investigate the underlying mechanism of the morphology effect on the photocatalytic activities for these FTNP/FTNR, high resolution transmission electron microscopy (HRTEM) provides further insight into the microstructural details of the core–shell FTNP/FTNR catalysts. In Fig. 4(a), monodispersed TiO2 nanoparticles can be clearly observed. TiO2 nanoparticles can be viewed as polyhedrons. HRTEM and selected area electron diffraction (SAED) patterns of TiO2 nanoparticles shown in Fig. 4(b) supported detailed structural analysis for the structural model and exposed crystal planes of TiO2 nanoparticles. The lattice fringes were from (101) and (001) crystal planes of anatase-phase TiO2. Combined with previous studies, Reference Yang, Sun, Qiao, Zou, Liu, Smith, Cheng and Lu21 the structural models of TiO2 nanoparticles were built as polyhedrons in Fig. 4(c), which were enclosed by dominated (101) surface and minority (001) surface.
TEM image of TiO2 nanoparticles (a), HRTEM images of TiO2 nanoparticles (b), structural model of TiO2 nanoparticles (c), TEM image of TiO2 nanorods (d), HRTEM images of TiO2 nanoparticles (e), and structural model of TiO2 nanorods (f).

Following TiO2 nanoparticles, a detailed structural analysis was carried out on the anisotropic TiO2 nanorods. Figure 4(d) reveals that TiO2 nanorods are not the perfect rectangle but the ones without their four angles. Figure 4(e) illustrates a clear crystal structure with lattice fringes of around 0.235 nm corresponding to the (001) plane of anatase TiO2. (001) plane is perpendicular to the growth direction of TiO2 nanorods, which approves that TiO2 nanorods grow along the [001] direction. FFT pattern of TiO2 nanorods shown in Fig. 4(g) indicates that there were (200), (004), (101) crystal planes in the nanorods. The FFT pattern of TiO2 nanorods is different from that of TiO2 nanoparticles in the diffraction dot corresponding to (200) planes, which indicates that in TiO2 nanorods, more (200) crystal planes are exposed. On the basis of the above crystal plane analysis, Reference Penn and Banfield22–Reference De Angelis, Vitillaro, Kavan, Nazeeruddin and Grätzel25 a crystal model was built up in Fig. 4(f). TiO2 nanorods were enclosed by majority (101) and (100) planes and a small amount of (001) planes.
It is well known that TiO2 can produce photogenerated conduction band electrons (e−) and photogenerated valence band holes (h+) after photoirradiations during the photocatalytic reactions. Then, hydroxyl radical (OH·) and superoxide radical (
 ${{\rm{O}}^{{\rm{2}} - }}$
) are created via the combination of (H+) and O2, (e−) and OH−. Both (OH·) and (
 ${{\rm{O}}^{{\rm{2}} - }}$
) with strong oxidizability can oxidize various organics to CO2 and H2O.
Reference Anandan, Sathish Kumar, Pugazhenthiran, Madhavan and Maruthamuthu26,Reference Harir, Gaspar, Kanawati, Fekete, Frommberger, Martens, Kettrup, El Azzouzi and Schmitt-Kopplin27
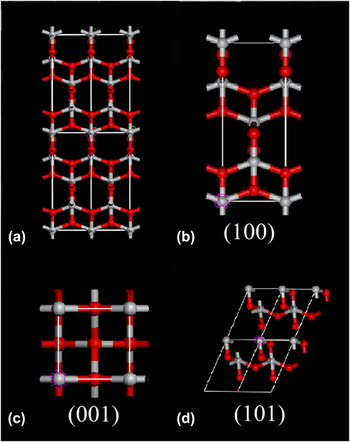
For the degradation of organics, organics were adsorbed on the surface of TiO2 nanocrystals. The photocatalytic reaction can be viewed as a surface reaction process, and the surface state of TiO2 nanocrystals has crucial influence on their photocatalytic activity. TiO2 nanocrystals with high surface energy reveal high activity in reaction to achieve a stable state of low energy. To investigate the surface energy of TiO2 nanorods and nanoparticles, the crystal models of TiO2 crystals and surface atom arrangement of (001), (100), and (101) crystal planes were carefully studied in Fig. 5. It can be observed that different density and arrangement of titanium atoms lead to the diversity of TiO2 crystal planes. Through a simple calculation, it can be acquired that the densities of the titanium atom in crystal planes (001), (100), and (101), were 3.5, 1.39, 0.645 atoms/nm2, respectively. Higher densities of the titanium atom would offer more dangling bonds and defects for the production of (OH·) and (
 ${{\rm{O}}^{{\rm{2}} - }}$
) and have higher catalytic activities. It was reported that the average surface energies of anatase TiO2 crystal planes follow the order of 0.9 J/m2 for (001) > 0.53 J/m2 for (100) > 0.44 J/m2 for (101).
Reference Lazzeri, Vittadini and Selloni28,Reference Diebold29
So, it can be concluded that (101) crystal planes with lowest surface energy are not very reactive. When the photocatalytic reaction happened, the combination and degradation of organics occur on (001) and (100) crystal planes first and prompt due to their higher surface energy. By comparing the two crystal models for TiO2 nanoparticles and nanorods, it can be concluded that the large exposing ratio of (100) plane in TiO2 nanorods might bring higher catalytic activity and faster reaction rate compared with TiO2 nanoparticles which have amount of (101) crystal planes.
Crystal structure of (a) TiO2, and its crystal planes of (b) (100), (c) (001), and (d) (101). Oxygen: gray; titanium: red.

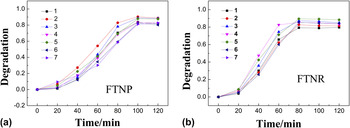
These FTNP/FTNR magnetic photocatalysts can be easily collected after photocatalytic reactions under magnetic fields and show advantages in the recycling utilizations. The photocatalytic activity of as-synthesized FTNP/FTNR magnetic photocatalysts in repeated utilization was tested in the degradation of phenol as an example. Figure 6 illustrates the curves for recycling degradation of phenol (80 mg/L) over FTNP/FTNR for seven times. Both FTNP and FTNR show excellent recycling properties, and the photocatalytic activity remains stable after seven cycles.
Photodegradation of phenol 7 times in the presence of (a) FTNP and (b) FTNR.

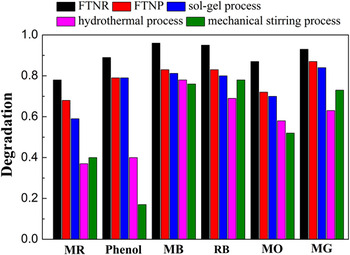
Besides the morphology effect, the capacity of photocatalysis was observed by comparing as-prepared FTNP/FTNR with other common FT magnetic photocatalysts. As shown in Figs. S1–S3, a series of FT comparisons were synthesized by various approaches such as the sol–gel process, hydrothermal process, and mechanical stirring process. For the synthesis of the comparisons, Fe3O4 hollow cores were synthesized by the identical approach in this work, and the loading amount of Ti atoms were kept the same in the original synthetic steps. From TEM images in Figs. S1–S3, it can be observed that all the comparisons have a FT core–shell structure. The comparative experiments were carried out over samples and comparisons in the degradation on a series of organics. The results in Fig. 7 show that FTNP and FTNR display superior photocatalytic performance than other comparisons. These should be contributed to the quantum size arising from the tiny size of TNP and TNR in the magnetic photocatalysts. Reference Anpo, Shima, Kodama and Kubokawa7,Reference Kormann, Bahnemann and Hoffmann8
Comparison of different organics' degradation by FT magnetic particles synthesized via various approaches. (MR: methyl red; MB: methylene blue; RB: rhodamine B; MO: methyl orange; MG: malachite green).

IV. CONCLUSIONS
In summary, we successfully synthesized magnetic photocatalysts containing TiO2 nanocrystals with two different morphologies (nanoparticles and nanorods) through straight dipping process. A series of photocatalytic experiments on the degradation of various organics under UV illuminations show that photocatalysts containing TiO2 nanorods show enhanced photocatalytic activity than photocatalysts containing TiO2 nanoparticles. We propose the crystal models for TiO2 nanoparticles and nanorods according to the analyses of HRTEM to study the influence of different crystal planes. TiO2 nanorods expose more (100) crystal planes and have relative higher surface energy than TiO2 nanoparticles do, which make nanorods have superior photocatalytic activity. Besides high photocatalytic activity, these FT magnetic catalysts were demonstrated to be of good recycling properties. Such FT magnetic photocatalysts with simple synthesis process, high photocatalytic activity, easy-recycling, and reusability would be of a great potential in the fields of environmental photocatalysis.
ACKNOWLEDGMENTS
This work was financially supported by NSFC (Grant Nos. 21001015 and 21121064), RFDP (Grant No. 20100010120003), and the State Key Project of Fundamental Research for Nanoscience and Nanotechnology (Grant No. 2011CB932402).