



1 Introduction
Transport of scalars, such as heat, salt and pollutants, by fluid flow is a universal phenomenon in nature, and is of importance in geophysics and engineering. The key parameter that characterises the diffusivity of those scalars is the Prandtl number
 $Pr=\unicode[STIX]{x1D708}^{\ast }/\unicode[STIX]{x1D705}^{\ast }$
, which is defined by the ratio of the kinematic viscosity
 $\unicode[STIX]{x1D708}^{\ast }$
of fluid to the diffusion coefficient
 $\unicode[STIX]{x1D705}^{\ast }$
of the scalar. (In this study, variables with or without an upper asterisk denote dimensional or non-dimensional quantities, respectively.) Since the diffusion coefficient of a substance in a liquid is generally much smaller than that of heat, the corresponding Prandtl number is much higher. For example, the value of
 $Pr$
for salt in water is 700, and the passive scalars in water often have even higher Prandtl numbers of order
 $10^{3}$
, while the Prandtl number for thermal diffusion in water is only 7.
For turbulent stratified flows, the eddy viscosity and eddy diffusivity are often used instead of their molecular values to model the effects of turbulent mixing that occur at unresolved small scales. For example, ocean circulation models parametrise the small-scale diffusion, often using the same value of turbulent eddy diffusivity for heat and salt. With the intention to investigate the effects of ‘differential diffusion’ of scalars, Gargett, Merryfield & Holloway (Reference Gargett, Merryfield and Holloway2003) numerically simulated the turbulence in a fluid stratified by both heat and salt, using different molecular-diffusion coefficients (
 $Pr=7$
and 70) for the two scalars. They showed that the turbulent diffusivity of the scalar of
 $Pr=7$
exceeds that of
 $Pr=70$
by 6 %–22 %, and argued that the difference of the turbulent diffusivity in seawater (
 $Pr=7$
and 700) would be even larger. While there is an uncertainty in the relation between the molecular and turbulent diffusion, the thermohaline circulation predicted by the geophysical fluid dynamics laboratory (GFDL) ocean model is indeed very sensitive to the ratio of the turbulent eddy diffusivity between temperature and salinity (Gargett & Holloway Reference Gargett and Holloway1992). Therefore, we need to know the effect of molecular diffusivity on the structure of stratified turbulence, especially at high Prandtl numbers.
The behaviour of small-scale fluctuations of a high-Prandtl-number scalar has been investigated theoretically by Batchelor (Reference Batchelor1959), assuming that the scalar is passive, i.e. the scalar does not contribute to the fluid density and the buoyancy force is absent. Batchelor showed that the scalar dissipates at the length scale of
 $L_{B}^{\ast }=Pr^{-1/2}L_{K}^{\ast }$
, and the scalar variance spectrum is proportional to
 $k^{\ast \,-1}$
in the viscous–convective subrange (
 $1/L_{K}^{\ast }<k^{\ast }<1/L_{B}^{\ast }$
). The scale
 $L_{K}^{\ast }=(\unicode[STIX]{x1D708}^{\ast 3}/\unicode[STIX]{x1D716}_{K}^{\ast })^{1/4}$
is the Kolmogorov scale (
 $\unicode[STIX]{x1D716}_{K}^{\ast }$
is the dissipation rate of kinetic energy) and
 $L_{B}^{\ast }$
is now called the Batchelor scale. Batchelor’s
 $k^{-1}$
spectrum has actually been observed in a water channel experiment by Gibson & Schwarz (Reference Gibson and Schwarz1963) and in oceanic measurements by Grant et al. (Reference Grant, Hughes, Vogel and Moilliet1968).
In a three-dimensional direct numerical simulation (DNS) of the forced isotropic turbulence, Bogucki, Domaradzki & Yeung (Reference Bogucki, Domaradzki and Yeung1997) found the
 $k^{-1}$
power spectrum for passive scalars with a Prandtl number up to 7, showing the applicability of Batchelor’s prediction even when the Reynolds number was not very high, i.e. when the microscale Reynolds number
 $Re_{\unicode[STIX]{x1D706}}=u_{rms}^{\ast }\unicode[STIX]{x1D706}^{\ast }/\unicode[STIX]{x1D708}^{\ast }$
is 77, where
 $u_{rms}^{\ast }$
is the root-mean-square (r.m.s.) turbulent velocity and
 $\unicode[STIX]{x1D706}^{\ast }$
is the Taylor microscale. Batchelor (Reference Batchelor1959) indeed argues in his original paper that his scalar spectrum (
 $\propto k^{-1}$
) below the Kolmogorov scale does not require a high Reynolds number, which would realise an inertial subrange in the kinetic-energy spectrum. Yeung, Xu & Sreenivasan (Reference Yeung, Xu and Sreenivasan2002) subsequently performed a DNS of forced isotropic turbulence with a uniform mean scalar gradient, and found that the scalar shows the
 $k^{-1}$
power spectrum at a higher Prandtl number (
 $Pr=64$
) but with a low Reynolds number (
 $Re_{\unicode[STIX]{x1D706}}=38$
). Yeung et al. (Reference Yeung, Xu, Donzis and Sreenivasan2004) obtained the similar results with even higher
 $Pr~(=1024)$
and lower
 $Re_{\unicode[STIX]{x1D706}}~(=8)$
.
The above results are all for a passive scalar in isotropic turbulence. In stratified fluids, the distribution of the active scalars such as salt generates the buoyancy force, and the scalars behave differently from passive scalars. In the studies of decaying stratified turbulence, the suppression of vertical motion due to the exchange between the vertical kinetic energy and the potential energy has been observed in both experiments (e.g. Webster Reference Webster1964; Lin & Pao Reference Lin and Pao1979) and DNS (e.g. Riley, Metcalfe & Weissman Reference Riley, Metcalfe, Weissman and West1981; Métais & Herring Reference Métais and Herring1989). After the initial fluctuations have decayed, the buoyancy Reynolds number (
 $Re_{b}=\unicode[STIX]{x1D716}_{K}^{\ast }/(\unicode[STIX]{x1D708}^{\ast }N^{\ast 2})$
with
 $N^{\ast }$
being the Brunt–Väisälä frequency) becomes small, and the turbulence eventually takes a horizontally layered structure, which is often called a pancake vortex (e.g. Pao Reference Pao1973; Métais & Herring Reference Métais and Herring1989; Fincham, Maxworthy & Spedding Reference Fincham, Maxworthy and Spedding1996; Kimura & Herring Reference Kimura and Herring1996). Majda & Grote (Reference Majda and Grote1997) obtained a similar pancake structure as an exact solution of the linear advection–diffusion equations, in modelling the low-Froude-number limiting dynamics. The Froude number was a measure of the ratio between the Brunt–Väisälä period and the eddy turnover time, and was defined by
 $Fr=U^{\ast }/(N^{\ast }L^{\ast })$
, with
 $U^{\ast }$
being the characteristic velocity and
 $L^{\ast }$
the characteristic length.
In a salt-stratified water channel (
 $Pr=700$
), evolution of the grid-generated turbulence has been investigated at moderate mesh Froude numbers of order
 $10^{1}$
(Stillinger, Helland & Van Atta Reference Stillinger, Helland and Van Atta1983; Itsweire, Helland & Van Atta Reference Itsweire, Helland and Van Atta1986). The transition from isotropic turbulence to flow with internal waves was observed when the Ozmidov scale
 $L_{O}^{\ast }=(\unicode[STIX]{x1D716}_{K}^{\ast }/N^{\ast 3})^{1/2}$
decreased below the integral scale, where the Ozmidov scale is the scale above which the stratification effect is significant (Ozmidov Reference Ozmidov1965). In wind tunnel experiments for thermally stratified turbulence (
 $Pr\sim 0.7$
), Lienhard & Van Atta (Reference Lienhard and Van Atta1990) have shown that the counter-gradient vertical density flux (i.e. conversion of potential energy into kinetic energy) is weaker for a lower Prandtl number. The difference between thermally stratified water (
 $Pr\sim 6$
) and salt-stratified water (
 $Pr\sim 600$
) was investigated by Komori & Nagata (Reference Komori and Nagata1996). They realised the same initial disturbance using the same turbulence grid, but still found that a higher Prandtl number generates a stronger and smaller-scale counter-gradient flux. This Prandtl-number dependence could be explained also by linear processes (Hanazaki & Hunt Reference Hanazaki and Hunt1996). The low-Froude-number turbulence was realised in the long-time development of the flow generated by a rake in a salt-stratified fluid (Fincham et al.
Reference Fincham, Maxworthy and Spedding1996; Praud, Fincham & Sommeria Reference Praud, Fincham and Sommeria2005), and the vertical shearing of horizontal flow, which dominates the kinetic-energy dissipation, was found.
Recently, the decaying stratified turbulence at
 $Pr=1$
with initially high Reynolds numbers has been simulated by Bartello & Tobias (Reference Bartello and Tobias2013) and Maffioli & Davidson (Reference Maffioli and Davidson2016). In those papers, the theory of strongly stratified turbulence (Lindborg Reference Lindborg2006) is examined, and the horizontal spectra of horizontal kinetic energy and potential energy in the inertial range are shown to follow the Kolmogorov and the Corrsin–Obukhov spectrum if the buoyancy Reynolds number is
 $O(10)$
or larger. Recent studies on forced stratified turbulence (e.g. de Bruyn Kops Reference de Bruyn Kops2015; Maffioli, Brethouwer & Lindborg Reference Maffioli, Brethouwer and Lindborg2016; Maffioli Reference Maffioli2017) also achieved a high Reynolds number (
 $Re_{\unicode[STIX]{x1D706}}\gtrsim 400$
), for which the
 $k^{-5/3}$
spectrum in kinetic energy was observed.
However, there have been only a few numerical studies intended for a Prandtl number larger than unity, due to the difficulty in resolving the very small Batchelor scales at high Prandtl numbers, while we know that the simulation at
 $Pr\sim 700$
is necessary for direct comparison with the salt-water experiments. The counter-gradient scalar flux, which is stronger for
 $Pr=2$
than for
 $Pr=1$
, has been observed in DNS by Gerz & Yamazaki (Reference Gerz and Yamazaki1993). They argued that the potential energy of a high-
 $Pr$
(
 $Pr>1$
) scalar would not be dissipated directly by its molecular diffusion, but would first be converted into kinetic energy and then dissipated by viscosity. The turbulence triggered by Kelvin–Helmholtz instability in an initially two-layer fluid was computed by Smyth (Reference Smyth1999), and the dissipation-range scalar spectrum at Prandtl numbers as high as 7 was investigated. The results showed that the spectral form of the scalar dissipation agrees better with the spectrum proposed by Kraichnan (Reference Kraichnan1968) than with that by Batchelor (Reference Batchelor1959), with similarity to the results for passive scalars (e.g. Bogucki et al.
Reference Bogucki, Domaradzki and Yeung1997). More recently, Salehipour, Peltier & Mashayek (Reference Salehipour, Peltier and Mashayek2015) investigated the Prandtl-number dependence (
 $1\leqslant Pr\leqslant 16$
) of a turbulent mixing layer caused by the Kelvin–Helmholtz instability, and suggested the possibility of an ‘ultraviolet catastrophe’ in the limit of high
 $Pr$
, where a very abrupt transition to turbulence occurs due to a direct and simultaneous injection of energy into all scales of motion. In their subsequent paper (Salehipour & Peltier Reference Salehipour and Peltier2015), they reformulated the diapycnal diffusivity, and showed that the corresponding turbulent Prandtl number decreases monotonically with the buoyancy Reynolds number
 $Re_{b}$
.
In this paper we describe the results of a DNS of decaying stratified turbulence at Prandtl numbers up to 70, with a higher resolution (up to
 $2048^{3}$
grid points) than the previous numerical simulations. This will realise conditions more similar to the salt-stratified experiments (
 $Pr\sim 700$
) compared to the previous numerical studies, which were intended mostly for
 $Pr\leqslant 7$
. The number of grid points necessary to resolve the smallest scale of a scalar fluctuation in turbulent flow is estimated by
 $(L^{\ast }/L_{B}^{\ast })^{3}=(L^{\ast }/L_{K}^{\ast })^{3}(L_{K}^{\ast }/L_{B}^{\ast })^{3}\sim Re^{9/4}Pr^{3/2}$
(
 $L^{\ast }$
being the integral scale), where the Reynolds number is defined by
 $Re=U^{\ast 4}/(\unicode[STIX]{x1D708}^{\ast }\unicode[STIX]{x1D716}_{K}^{\ast })$
, with
 $U^{\ast }$
being the mean horizontal velocity. Therefore, as long as the grid resolution
 $L^{\ast }/L_{B}^{\ast }$
is the same,
 $Re\,Pr^{2/3}$
is constant, showing that the maximum attainable Reynolds number for a simulation with
 $Pr=70$
becomes
 $70^{2/3}~({\sim}17)$
times smaller than that with
 $Pr=1$
. Then, our Reynolds number (figure 1) would become one order of magnitude smaller than that of Maffioli & Davidson (Reference Maffioli and Davidson2016), who also used 2048 grid points in the horizontal direction. On the other hand, our Reynolds number is close to that of Staquet & Godeferd (Reference Staquet and Godeferd1998), while the grid resolution is eight times higher than theirs (
 $256^{3}$
grid points). Then, the Prandtl number can be increased approximately up to
 $8^{2}~(=64)$
. Brethouwer et al. (Reference Brethouwer, Billant, Lindborg and Chomaz2007) argued that the parameter map in figure 1 can be divided into four regimes, i.e. classical Kolmogorov turbulence (
 $Fr_{h}>1$
), weakly stratified turbulence (
 $Re_{b}=Re\,Fr_{h}^{2}>1$
and
 $0.02<Fr_{h}<1$
), strongly stratified turbulence (
 $Re_{b}=Re\,Fr_{h}^{2}>1$
and
 $Fr_{h}<0.02$
), and viscosity-affected stratified flow (
 $Re_{b}=Re\,Fr_{h}^{2}<1$
), where the horizontal Froude number is defined by
 $Fr_{h}=\unicode[STIX]{x1D716}_{K}^{\ast }/(N^{\ast }U^{\ast 2})$
. Our simulations start from the weakly stratified turbulence regime, and enter the viscosity-affected stratified flow regime. Therefore, after the turbulence has decayed, a clear dependence on the molecular effects of the Prandtl number would be observed.
Reynolds number
 $Re$
and inverse horizontal Froude number
 $1/Fr_{h}$
in decaying stratified turbulence analysed by DNS. Symbols show the initial values, i.e. the values when the kinetic-energy dissipation rate becomes maximum and small-scale velocity fluctuations have fully developed: ●, present study; ○, Riley et al. (Reference Riley, Metcalfe, Weissman and West1981) (RMW); ▵, Staquet & Godeferd (Reference Staquet and Godeferd1998) (SG); ▿, Bartello & Tobias (Reference Bartello and Tobias2013) (BT); ▫, Maffioli & Davidson (Reference Maffioli and Davidson2016) (MD). Temporal variations of parameters in the present study are shown by three curves (
 $Pr=1$
, 7 and 70, from right to left). The classification into four regimes is due to Brethouwer et al. (Reference Brethouwer, Billant, Lindborg and Chomaz2007). The buoyancy Reynolds number becomes unity (
 $Re_{b}=Re\,Fr_{h}^{2}=1$
) on the oblique dotted line.

We will show first the Prandtl-number dependence of the statistical quantities such as energies and vertical density flux (§ 3.1), then investigate the spatial distribution of density fluctuations, which exhibits vertically small-scale structures at the highest Prandtl number of 70 (§ 3.2), and examine the relevant spectra (§ 3.3). We finally discuss the generation mechanism of the vertically thin structures of the density fluctuations, modifying the theory for a passive scalar (Batchelor Reference Batchelor1959) into a theory for a buoyant scalar (§ 3.4).
2 Numerical procedure
We consider the turbulent flow of a density-stratified fluid whose stratification is generated by a buoyant scalar of Prandtl number unity or larger (
 $Pr=\unicode[STIX]{x1D708}^{\ast }/\unicode[STIX]{x1D705}^{\ast }\geqslant 1$
). The quiescent fluid has the density distribution of
 $\bar{\unicode[STIX]{x1D70C}}^{\ast }(z^{\ast })=\unicode[STIX]{x1D70C}_{0}^{\ast }+(\text{d}\bar{\unicode[STIX]{x1D70C}}^{\ast }/\text{d}z^{\ast })z^{\ast }$
(where
 $z^{\ast }$
is the vertical coordinate and
 $\unicode[STIX]{x1D70C}_{0}^{\ast }$
is a representative density of the fluid) with a constant vertical density gradient
 $\text{d}\bar{\unicode[STIX]{x1D70C}}^{\ast }/\text{d}z^{\ast }=\text{const.}<0$
. The Brunt–Väisälä frequency is given by
 $N^{\ast }=\sqrt{-(g^{\ast }/\unicode[STIX]{x1D70C}_{0}^{\ast })(\text{d}\bar{\unicode[STIX]{x1D70C}}^{\ast }/\text{d}z^{\ast })}$
, where
 $g^{\ast }$
is the gravitational acceleration. As an initial condition for the decaying turbulence, we consider an isotropic velocity fluctuation with the integral length scale of
 $L_{0}^{\ast }$
and the r.m.s. velocity of
 $U_{0}^{\ast }$
.
The temporal variation of velocity,
 $u_{i}^{\ast }$
(
 $i=3$
denotes the vertical component), is governed by the Navier–Stokes equations under the Boussinesq approximation, i.e.
 $$\begin{eqnarray}\frac{\unicode[STIX]{x2202}u_{i}}{\unicode[STIX]{x2202}t}+u_{j}\frac{\unicode[STIX]{x2202}u_{i}}{\unicode[STIX]{x2202}x_{j}}=-\frac{\unicode[STIX]{x2202}p^{\prime }}{\unicode[STIX]{x2202}x_{i}}+\frac{1}{Re_{0}}\frac{\unicode[STIX]{x2202}^{2}u_{i}}{\unicode[STIX]{x2202}x_{j}^{2}}-\frac{1}{Fr_{0}^{2}}\unicode[STIX]{x1D70C}^{\prime }\unicode[STIX]{x1D6FF}_{i3},\end{eqnarray}$$
the density perturbation from its mean field
 $\unicode[STIX]{x1D70C}^{\prime \ast }~(=\unicode[STIX]{x1D70C}^{\ast }-\bar{\unicode[STIX]{x1D70C}}^{\ast }(x_{3}^{\ast }))$
is governed by the transport equation of density, i.e.
 $$\begin{eqnarray}\frac{\unicode[STIX]{x2202}\unicode[STIX]{x1D70C}^{\prime }}{\unicode[STIX]{x2202}t}+u_{j}\frac{\unicode[STIX]{x2202}\unicode[STIX]{x1D70C}^{\prime }}{\unicode[STIX]{x2202}x_{j}}=\frac{1}{Re_{0}Pr}\frac{\unicode[STIX]{x2202}^{2}\unicode[STIX]{x1D70C}^{\prime }}{\unicode[STIX]{x2202}x_{j}^{2}}+u_{3},\end{eqnarray}$$
and the incompressibility condition is given by
 $$\begin{eqnarray}\frac{\unicode[STIX]{x2202}u_{i}}{\unicode[STIX]{x2202}x_{i}}=0.\end{eqnarray}$$
Hereafter,
 $(u,v,w)$
and
 $(x,y,z)$
are read as
 $(u_{1},u_{2},u_{3})$
and
 $(x_{1},x_{2},x_{3})$
, respectively, and the quantities without an asterisk denote the values non-dimensionalised by the length scale
 $L_{0}^{\ast }$
, the velocity scale
 $U_{0}^{\ast }$
, the pressure scale
 $\unicode[STIX]{x1D70C}_{0}^{\ast }U_{0}^{\ast 2}$
and the density scale
 $-L_{0}^{\ast }\,\text{d}\bar{\unicode[STIX]{x1D70C}}^{\ast }/\text{d}z^{\ast }$
. Throughout this study, the initial Reynolds number and the initial Froude number are fixed at
 $Re_{0}=U_{0}^{\ast }L_{0}^{\ast }/\unicode[STIX]{x1D708}^{\ast }=100$
and
 $Fr_{0}=U_{0}^{\ast }/(N^{\ast }L_{0}^{\ast })=1$
, and we examine the Prandtl-number dependence of the flow using three Prandtl numbers (
 $Pr=1$
, 7 and 70).
In this study, only the kinetic energy is assumed to exist initially, since there would be no initial potential energy due to density perturbations in the grid-generated stratified turbulence (e.g. Stillinger et al. Reference Stillinger, Helland and Van Atta1983; Lienhard & Van Atta Reference Lienhard and Van Atta1990). The initial energy spectrum is given in dimensional form by
 $$\begin{eqnarray}E_{K}^{\ast }(k^{\ast })=16\sqrt{\frac{2}{\unicode[STIX]{x03C0}}}U_{0}^{\ast 2}\frac{k^{\ast 4}}{k_{0}^{\ast 5}}\exp \left\{-2\left(\frac{k^{\ast }}{k_{0}^{\ast }}\right)^{2}\right\}.\end{eqnarray}$$
This corresponds to the final period of decay of isotropic turbulence (Orszag & Patterson Reference Orszag and Patterson1972; Townsend Reference Townsend1976), and has been used for the initially isotropic stratified turbulence (e.g. Staquet & Godeferd Reference Staquet and Godeferd1998). Integration of the spectrum in the whole range of wavenumber
 $k^{\ast }$
gives the initial kinetic energy
 $KE_{0}^{\ast }=3U_{0}^{\ast 2}/2$
and the initial integral scale
 $L_{0}^{\ast }$
as
 $$\begin{eqnarray}L_{0}^{\ast }=\frac{3\unicode[STIX]{x03C0}}{4KE_{0}^{\ast }}\int _{0}^{\infty }\frac{E_{K}^{\ast }(k^{\ast })}{k^{\ast }}\,\text{d}k^{\ast }=\frac{\sqrt{2\unicode[STIX]{x03C0}}}{k_{0}^{\ast }}.\end{eqnarray}$$
We note that the statistical quantities shown in the following section are not very sensitive to the form of the initial energy spectrum, as long as the initial r.m.s. velocity and integral scale are the same.
In the actual numerical simulation, isotropic fluctuations satisfying (2.4) are developed in time without stratification until the enstrophy reaches its maximum, so that an isotropic turbulence is well developed. We then apply the undisturbed vertical density gradient, and set the time at
 $t=0$
. The simulation is terminated at
 $t=U_{0}^{\ast }t^{\ast }/L_{0}^{\ast }=40$
, which is equal to approximately six Brunt–Väisälä periods (the non-dimensional Brunt–Väisälä period is
 $T_{BV}=2\unicode[STIX]{x03C0}U_{0}^{\ast }/(N^{\ast }L_{0}^{\ast })=2\unicode[STIX]{x03C0}Fr_{0}\sim 6.3$
). The microscale Reynolds number at
 $t=0$
is
 $Re_{\unicode[STIX]{x1D706}}=42$
. The
 $k^{-1}$
spectrum for passive scalars has been observed in stationary turbulence at such a low Reynolds number (e.g.
 $Re_{\unicode[STIX]{x1D706}}=38$
in Yeung et al. (Reference Yeung, Xu and Sreenivasan2002);
 $Re_{\unicode[STIX]{x1D706}}=8$
in Yeung et al. (Reference Yeung, Xu, Donzis and Sreenivasan2004)).
The vorticity equation obtained by taking the curl of (2.1) and the transport equation of the density perturbation (2.2) are solved by the Fourier spectral method in a cube with boundary conditions of period
 $4\unicode[STIX]{x03C0}$
in all directions. The nonlinear terms are evaluated pseudospectrally and the aliasing errors are removed by the
 $3/2$
rule, so that the maximum wavenumber
 $k_{max}$
is 341 (and the minimum wavenumber
 $k_{min}$
is 0.5) when
 $2048^{3}$
grid points are used. The parameters used for the numerical simulations are summarised in table 1. For all cases, the value of
 $k_{max}/k_{B}$
is always larger than 1.55, so that phenomena down to the Batchelor scale could be resolved. For the case with the highest Prandtl number (
 $Pr=70$
), we begin the simulation at
 $t=0$
with
 $2048^{3}$
grid points, and reduce the resolution to
 $1024^{3}$
at
 $t=6$
. The decrease of grid resolution at
 $t=6$
does not affect the numerical results since the Batchelor scale is well resolved (
 $k_{max}/k_{B}=1.60$
) even with the coarser grid (cf. figure 7
a). For the time integration, the diffusive terms are calculated analytically using the integrating factor, while the other terms are approximated by the fourth-order Runge–Kutta method (Rogallo Reference Rogallo1977).
List of parameters used for the present DNS. The minimum value of
 $k_{max}/k_{B}$
appears initially (figure 7
a), i.e. when the Batchelor wavenumber
 $k_{B}$
is largest.

The numerical code is parallelised using the message passing interface (MPI) based on the one-dimensional decomposition (i.e. decomposing the computational domain into slabs). The computations have been carried out on the NEC SX-ACE in the Cyberscience Center of Tohoku University, and the Earth Simulator Center of the Japan Agency of Marine-Earth Science and Technology. The execution time required for the case of
 $Pr=70$
is 19.2 h for the initial period of
 $0\leqslant t\leqslant 6$
(with 256 nodes), and 21.8 h for the latter period of
 $6\leqslant t\leqslant 40$
(with 64 nodes). The execution time is shorter for
 $Pr=1$
and 7, i.e. 25.6 h for the whole period of
 $0\leqslant t\leqslant 40$
, using 64 nodes throughout the computation.
3 Results
3.1 Energetics
We first consider the time development of the kinetic energy
 $KE=\overline{u_{i}^{2}}/2$
and the potential energy
 $PE=\overline{\unicode[STIX]{x1D70C}^{\prime 2}}/(2Fr_{0}^{2})$
, where the overline denotes the spatial average over the entire periodic domain, i.e.
 $\overline{\;\cdot \;}=(1/(4\unicode[STIX]{x03C0})^{3})\int \cdot \text{d}V$
. Their decay rates,
 $\text{d}KE/\text{d}t$
and
 $\text{d}PE/\text{d}t$
, are determined by the following equations (e.g. Gerz & Yamazaki Reference Gerz and Yamazaki1993):
 $$\begin{eqnarray}\displaystyle & \displaystyle \frac{\text{d}}{\text{d}t}KE=-\frac{\overline{\unicode[STIX]{x1D70C}^{\prime }w}}{Fr_{0}^{2}}-\unicode[STIX]{x1D716}_{K}, & \displaystyle\end{eqnarray}$$
 $$\begin{eqnarray}\displaystyle & \displaystyle \frac{\text{d}}{\text{d}t}PE=\frac{\overline{\unicode[STIX]{x1D70C}^{\prime }w}}{Fr_{0}^{2}}-\unicode[STIX]{x1D716}_{P}, & \displaystyle\end{eqnarray}$$
where the kinetic and potential-energy dissipation rates are defined by
 $\unicode[STIX]{x1D716}_{K}=\overline{(\unicode[STIX]{x2202}u_{i}/\unicode[STIX]{x2202}x_{j})^{2}}/Re_{0}$
and
 $\unicode[STIX]{x1D716}_{P}=\overline{(\unicode[STIX]{x2202}\unicode[STIX]{x1D70C}^{\prime }/\unicode[STIX]{x2202}x_{j})^{2}}/(Pr\,Re_{0}Fr_{0}^{2})$
, respectively. The first term on the right-hand side of these equations, i.e.
 $\overline{\unicode[STIX]{x1D70C}^{\prime }w}/Fr_{0}^{2}$
, is the vertical density flux which is responsible for the energy exchange between
 $KE$
and
 $PE$
.
Figure 2(a) indeed shows the initial decrease of
 $KE$
and the initial increase of
 $PE$
. After that, both energies show decaying oscillation with approximately half the Brunt–Väisälä period (
 $T_{BV}/2=\unicode[STIX]{x03C0}Fr_{0}=\unicode[STIX]{x03C0}$
). The phases of oscillation are opposite since energy conversion between
 $KE$
and
 $PE$
continues. The kinetic energy
 $KE$
can be decomposed into the horizontal kinetic energy
 $KE_{H}=\overline{u^{2}+v^{2}}/2$
and the vertical kinetic energy
 $KE_{V}=\overline{w^{2}}/2$
(figure 2
b), and only
 $KE_{V}$
shows a clear oscillation while
 $KE_{H}$
decays almost monotonically, since
 $PE$
exchanges energy directly with
 $KE_{V}$
.
Time oscillation of the vertical density flux is shown in figure 3(a), and comparison with figures 2(a) and 2(b) show that
 $KE_{V}$
decreases and
 $PE$
increases during
 $0<t\lesssim 2$
, i.e. when the vertical density flux is positive, while the opposite happens during
 $2\lesssim t\lesssim 3$
, i.e. when the vertical density flux is negative. This shows clearly that the energy exchange occurs through the vertical density flux (e.g. Gerz & Yamazaki Reference Gerz and Yamazaki1993).
Now we consider the effect of the Prandtl number. According to (3.2), the initial growth of
 $PE$
(
 $0.5\lesssim t\lesssim 2$
) is more significant for higher Prandtl numbers, since the dissipation rate
 $\unicode[STIX]{x1D716}_{P}$
is smaller (figure 3
b) while the difference in the vertical density flux is small (figure 3
a). Since the peak value of
 $PE$
is larger, more energy can be converted back into
 $KE_{V}$
during
 $2\lesssim t\lesssim 3$
, through the counter-gradient vertical density flux (figure 3
a). This leads to a slightly larger
 $KE_{V}$
and
 $KE$
, during the same period (insets of figure 2
a,b). The total energy (
 $TE=KE+PE$
) also decays more slowly for a higher Prandtl number (results not shown), mainly because of the smaller
 $\unicode[STIX]{x1D716}_{P}$
.
We note that the difference of
 $KE_{V}$
(and
 $KE$
) between
 $Pr=7$
and 70 is much smaller than the difference between
 $Pr=1$
and 7. Indeed, as will be shown later in figure 13, the kinetic-energy spectra for
 $Pr=7$
and 70 are almost identical at scales larger than the Kolmogorov scale, and the Prandtl-number effects appear only at scales smaller than the Kolmogorov scale. The velocity fluctuations at such small scales do not practically contribute to kinetic energy, so that the kinetic energy becomes insensitive to the large Prandtl numbers (
 $Pr=7$
and 70). This may suggest that the kinetic energy does not increase further even if we adopt a higher Prandtl number of
 $O(10^{3})$
, which is the typical Schmidt number for the scalar diffusion in liquids.
Temporal variations of (a) kinetic energy
 $KE=\overline{u_{i}^{2}}/2$
and potential energy
 $PE=\overline{\unicode[STIX]{x1D70C}^{\prime 2}}/(2Fr_{0}^{2})$
, and (b) horizontal kinetic energy
 $KE_{H}=\overline{u^{2}+v^{2}}/2$
and vertical kinetic energy
 $KE_{V}=\overline{w^{2}}/2$
. The insets in panels 2(a) and (b) are close-ups of
 $KE$
and
 $KE_{V}$
, respectively. The vertical dotted line indicates the Brunt–Väisälä period, i.e.
 $t=T_{BV}=2\unicode[STIX]{x03C0}Fr_{0}~(=6.28)$
.

Figure 3(a) presents the Prandtl-number dependence of the vertical density flux. It is almost independent of
 $Pr$
until it reaches the first peak at
 $t\sim 0.6$
, but the
 $Pr$
dependence appears at
 $t\sim 1.5$
, after which the effects of density diffusion become significant. The vertical density flux becomes more negative and more counter-gradient for a higher Prandtl number (cf. figure 14
a), in agreement with previous studies. For example, wind tunnel experiments using thermally stratified air (
 $Pr=0.7$
) show only a weak counter-gradient flux (Lienhard & Van Atta Reference Lienhard and Van Atta1990), while the water channel experiments using salinity stratification (
 $Pr=700$
) show a stronger counter-gradient flux (Komori & Nagata Reference Komori and Nagata1996). The Prandtl-number dependence of the counter-gradient flux was predicted also by the rapid distortion theory as an effect of molecular diffusion (Hanazaki & Hunt Reference Hanazaki and Hunt1996).
The dissipation rates of
 $KE$
and
 $PE$
, i.e.
 $\unicode[STIX]{x1D716}_{K}$
and
 $\unicode[STIX]{x1D716}_{P}$
, decrease almost monotonically (figure 3
b) after
 $t\sim 3$
, since the temporal oscillation occurs only at large scales, while the dissipation is dominated by the non-oscillating small-scale components. The kinetic-energy dissipation rate
 $\unicode[STIX]{x1D716}_{K}$
is slightly larger for a higher Prandtl number (
 $Pr>1$
), since the potential energy at scales smaller than the Kolmogorov scale becomes larger (cf. figure 13) and more energy is converted into kinetic energy at small scales through the vertical density flux.
On the other hand, the potential-energy dissipation rate
 $\unicode[STIX]{x1D716}_{P}$
is smaller for a larger Prandtl number due to the smaller diffusion coefficient. The time at which
 $\unicode[STIX]{x1D716}_{P}$
reaches its maximum is delayed since it takes a longer time for a high-Prandtl-number scalar to transfer potential energy to its small Batchelor scale and complete the initial cascading process of the potential energy.
Temporal variations of (a) vertical density flux
 $\overline{\unicode[STIX]{x1D70C}^{\prime }w}/Fr_{0}^{2}$
and (b) kinetic- and potential-energy dissipation rates
 $\unicode[STIX]{x1D716}_{K}=\overline{(\unicode[STIX]{x2202}u_{i}/\unicode[STIX]{x2202}x_{j})^{2}}/Re_{0}$
and
 $\unicode[STIX]{x1D716}_{P}=\overline{(\unicode[STIX]{x2202}\unicode[STIX]{x1D70C}^{\prime }/\unicode[STIX]{x2202}x_{j})^{2}}/(Pr\,Re_{0}Fr_{0}^{2})$
. The vertical dotted line in panel (a) indicates the Brunt–Väisälä period
 $t=T_{BV}=2\unicode[STIX]{x03C0}Fr_{0}~(=6.28)$
.

Figure 4 shows the temporal variation of the correlation coefficient of the vertical density flux defined by
 $\overline{\unicode[STIX]{x1D70C}^{\prime }w}/(\unicode[STIX]{x1D70C}_{rms}^{\prime }w_{rms})$
, in which
 $\unicode[STIX]{x1D70C}_{rms}^{\prime }=(\overline{\unicode[STIX]{x1D70C}^{\prime 2}})^{1/2}$
and
 $w_{rms}=(\overline{w^{2}})^{1/2}$
. The time is non-dimensionalised here by the Brunt–Väisälä period
 $T_{BV}^{\ast }=2\unicode[STIX]{x03C0}/N^{\ast }$
, and we note that the correlation coefficient is initially equal to unity when the initial density fluctuation is absent, and oscillates at approximately half the Brunt–Väisälä period (e.g. Gerz & Yamazaki Reference Gerz and Yamazaki1993; Hanazaki & Hunt Reference Hanazaki and Hunt1996). The Prandtl-number effect is initially small until the correlation coefficient first becomes zero (
 $N^{\ast }t^{\ast }/(2\unicode[STIX]{x03C0})\lesssim 0.3$
), but it becomes apparent with time, and the flux is persistently more strongly counter-gradient for larger Prandtl numbers (Hanazaki & Hunt Reference Hanazaki and Hunt1996; Komori & Nagata Reference Komori and Nagata1996).
Correlation coefficient of the vertical density flux
 $\overline{\unicode[STIX]{x1D70C}^{\prime }w}/(\unicode[STIX]{x1D70C}_{rms}^{\prime }w_{rms})$
plotted against the buoyancy time
 $t^{\ast }/T_{BV}^{\ast }$
.

The decay rate of
 $KE$
and
 $PE$
is examined by replotting figure 2(a) in a double-logarithmic chart (figure 5). The kinetic energy decays like
 ${\sim}t^{-1.1}$
after
 $t\sim 2$
, independent of
 $Pr$
. We note that the numerical simulation by Staquet & Godeferd (Reference Staquet and Godeferd1998) shows a decay exponent of
 ${\sim}-1.0$
, and the experiments show a decay exponent of
 ${\sim}-1.3$
(Lienhard & Van Atta Reference Lienhard and Van Atta1990; Fincham et al.
Reference Fincham, Maxworthy and Spedding1996; Praud et al.
Reference Praud, Fincham and Sommeria2005). Since the experiments for a homogeneous fluid also give a similar decay exponent of
 $-1.3$
to
 $-1.0$
, the above results for stratified fluids show that the stratification has only small effects on the decay rate of
 $KE$
(i.e.
 $\text{d}KE/\text{d}t$
). For a higher Prandtl number, the vertical density flux
 $\overline{\unicode[STIX]{x1D70C}^{\prime }w}/Fr_{0}^{2}$
becomes more counter-gradient near the Kolmogorov scale (figure 14
a) and injects more energy into the vertical velocity component. Then, the kinetic energy becomes larger at small scales (figure 13), and
 $\unicode[STIX]{x1D716}_{K}$
increases (figure 3
b). These two effects approximately cancel on the right-hand side of (3.1), so that the decay rate of
 $KE$
is rather insensitive to the Prandtl number. On the other hand, the potential energy decays faster for a larger Prandtl number for a certain period (
 $2\lesssim t\lesssim 10$
) after the
 $PE$
becomes maximum. After that moment, however,
 $PE$
decays like
 ${\sim}t^{-1.1}$
regardless of
 $Pr$
, since the decrease of
 $\unicode[STIX]{x1D716}_{P}$
with increasing
 $Pr$
cancels the decrease of
 $\overline{\unicode[STIX]{x1D70C}^{\prime }w}/Fr_{0}^{2}$
on the right-hand side of (3.2). Thus, the ratio
 $PE/KE$
remains approximately constant at large times (
 $t\gtrsim 10$
).
Replot of figure 2(a) in a double-logarithmic chart.

We next examine how the anisotropy develops in the large-scale motion. Figure 6 shows the temporal evolution of
 $KE_{H}/(2KE_{V})=\overline{u^{2}+v^{2}}/(2\overline{w^{2}})$
, which should become unity when the flow is isotropic. The ratio actually exceeds unity, and the overall value increases until
 $t\sim 15$
, indicating that the vertical motion is suppressed by buoyancy, and the horizontal flow becomes more dominant. When
 $Pr=1$
, the ratio fluctuates around 2.2 after
 $t\sim 15$
, in agreement with Godeferd & Staquet (Reference Godeferd and Staquet2003), who reported that the ratio of r.m.s. horizontal velocity to r.m.s. vertical velocity, i.e.
 $(KE_{H}/(2KE_{V}))^{1/2}$
, approaches 1.5. The ratio
 $KE_{H}/(2KE_{V})$
becomes smaller for a higher Prandtl number, since more potential energy is converted into vertical kinetic energy via the vertical density flux (figure 3
a), and the increase of
 $KE_{V}$
with
 $Pr$
is larger than the increase of
 $KE_{H}$
(figure 2
b). However, the decrease of the ratio due to the increasing
 $Pr$
seems to saturate between
 $Pr=7$
and
 $Pr=70$
for the same reason as explained earlier in figure 2.
Temporal variation of the energy ratio
 $KE_{H}/(2KE_{V})$
, which should be unity for isotropic turbulence. The vertical dotted lines indicate the time
 $t=nT_{BV}~(n=1,2,\ldots )$
, where
 $T_{BV}~(=2\unicode[STIX]{x03C0}Fr_{0}=6.28)$
is the Brunt–Väisälä period.

The temporal developments of the Kolmogorov wavenumber
 $k_{K}^{\ast }=(\unicode[STIX]{x1D716}_{K}^{\ast }/\unicode[STIX]{x1D708}^{\ast 3})^{1/4}$
, the Ozmidov wavenumber
 $k_{O}^{\ast }=(N^{\ast 3}/\unicode[STIX]{x1D716}_{K}^{\ast })^{1/2}$
and the Batchelor wavenumber
 $k_{B}^{\ast }=Pr^{1/2}k_{K}^{\ast }$
for
 $Pr=70$
are plotted in figure 7(a) in their non-dimensional forms (i.e.
 $k_{K}=k_{K}^{\ast }L_{0}^{\ast }$
,
 $k_{O}=k_{O}^{\ast }L_{0}^{\ast }$
and
 $k_{B}=k_{B}^{\ast }L_{0}^{\ast }$
). The Ozmidov wavenumber determines the minimum size of turbulent eddies whose overturning motion is prohibited by buoyancy (Dougherty Reference Dougherty1961; Ozmidov Reference Ozmidov1965). It increases as
 $\unicode[STIX]{x1D716}_{K}$
decreases with time. On the other hand, the Kolmogorov wavenumber decreases with time, and agrees with the Ozmidov wavenumber at
 $t\sim 8$
. The agreement occurs always at the same wavenumber, i.e. at
 $k_{P}^{\ast }=(N^{\ast }/\unicode[STIX]{x1D708}^{\ast })^{1/2}$
. We call
 $k_{P}^{\ast }$
the primitive wavenumber since the corresponding length has been called the primitive length scale in stratified turbulence (Barry et al.
Reference Barry, Ivey, Winters and Imberger2001). The primitive wavenumber
 $k_{P}^{\ast }$
, by its definition, is always between
 $k_{K}^{\ast }$
and
 $k_{O}^{\ast }$
. In the present numerical simulation, its non-dimensional value
 $k_{P}=(Re_{0}/Fr_{0})^{1/2}~(=10)$
is invariant, since
 $Re_{0}~(=100)$
and
 $Fr_{0}~(=1)$
are fixed. The agreement time between
 $k_{K}$
and
 $k_{O}$
is slightly delayed as the Prandtl number becomes larger. This can be inferred from figure 3(b), which shows the increase of
 $\unicode[STIX]{x1D716}_{K}$
with
 $Pr$
, and hence the increase of
 $k_{K}$
and the decrease of
 $k_{O}$
, although the results for
 $Pr=1$
and 7 are not included in figure 7(a).
The evolution of (a) Kolmogorov, Ozmidov and Batchelor wavenumbers
 $k_{K},~k_{O}$
and
 $k_{B}$
for
 $Pr=70$
, and (b) buoyancy Reynolds number
 $Re_{b}$
for
 $Pr=1,~7$
and 70. In panel (a), the two horizontal dash-dotted lines indicate the maximum wavenumbers (
 $k_{max}$
) resolved by the two grids used for the computation (
 $k_{max}=341$
when
 $t\leqslant 6$
, and
 $k_{max}=170.5$
when
 $6\leqslant t\leqslant 40$
), and the horizontal dotted line indicates the primitive wavenumber (
 $k_{P}=10$
).

We present in figure 7(b) the temporal variation of the buoyancy Reynolds number
 $$\begin{eqnarray}Re_{b}=\frac{\unicode[STIX]{x1D716}_{K}^{\ast }}{\unicode[STIX]{x1D708}^{\ast }N^{\ast 2}}=\left(\frac{k_{K}^{\ast }}{k_{O}^{\ast }}\right)^{4/3},\end{eqnarray}$$
determined by the ratio between the Ozmidov scale and the Kolmogorov scale. If the buoyancy Reynolds number is larger than unity (
 $k_{K}>k_{O}$
), the smallest eddy is not affected by buoyancy, and the flow at the Kolmogorov scale would be isotropic. The buoyancy Reynolds number starts at approximately 50 in our simulation, and decreases monotonically with time. It decreases to unity at
 $t\sim 8$
, i.e. when the decreasing
 $k_{K}$
and the increasing
 $k_{O}$
agree at
 $k_{P}$
. After the buoyancy Reynolds number has decreased far below unity, most of the energy dissipates at large scales, and the flow is sometimes called viscosity-affected stratified flow (Brethouwer et al.
Reference Brethouwer, Billant, Lindborg and Chomaz2007). The larger Prandtl number slows down the decrease of the buoyancy Reynolds number because more potential energy is converted into kinetic energy at small scales and retards the decrease of
 $\unicode[STIX]{x1D716}_{K}$
in (3.3).
Figure 8(a) shows the time development of the mixing coefficient
 $\unicode[STIX]{x1D716}_{P}/\unicode[STIX]{x1D716}_{K}$
. It increases initially with the increase of
 $\unicode[STIX]{x1D716}_{P}$
(cf. figure 3
b), but then decreases with some fluctuations. The mixing coefficient at
 $Pr=1$
asymptotes to approximately 0.3, in agreement with the previous numerical simulations (Riley & de Bruyn Kops Reference Riley and de Bruyn Kops2003). The value is also close to that of Maffioli et al. (Reference Maffioli, Brethouwer and Lindborg2016) observed at much higher Reynolds numbers (
 ${\sim}10^{4}$
) and lower Froude numbers (
 ${\lesssim}0.03$
).
(a) Temporal variation of the mixing coefficient
 $\unicode[STIX]{x1D716}_{P}/\unicode[STIX]{x1D716}_{K}$
. (b) Mixing coefficient as a function of the buoyancy Reynolds number
 $Re_{b}$
, which decreases with time.

At early times (
 $t\sim 5$
), the mixing coefficient does not depend strongly on the Prandtl number, but the decrease with time is more significant for higher Prandtl numbers. This occurs since
 $\unicode[STIX]{x1D716}_{P}$
becomes progressively smaller for higher
 $Pr$
, while
 $\unicode[STIX]{x1D716}_{K}$
is always comparable (figure 3
b). As time proceeds (
 $t\gtrsim 10$
), and when the buoyancy Reynolds number falls below unity, the contour surfaces of the density perturbation become flat (cf. figures 10
d, 11
f and 13
c,d). Then, the horizontal diffusion becomes weak, and will reduce
 $\unicode[STIX]{x1D716}_{P}$
. Figure 8(b) indeed shows that the difference in
 $\unicode[STIX]{x1D716}_{P}/\unicode[STIX]{x1D716}_{K}$
becomes conspicuous after
 $Re_{b}$
becomes below unity. This may also explain why the decrease of the mixing coefficient due to
 $Pr$
is more significant in the present simulation than in the mixing-layer simulation by Salehipour et al. (Reference Salehipour, Peltier and Mashayek2015) where the buoyancy Reynolds number was much larger (
 $Re_{b}\gtrsim 10$
).
3.2 Spatial distributions of energy
We next show in figure 9 the spatial distributions of the kinetic energy
 $u_{i}^{2}/2$
and the potential energy
 $\unicode[STIX]{x1D70C}^{\prime 2}/(2Fr_{0}^{2})$
at
 $t=4$
, for low and high Prandtl numbers (
 $Pr=1$
and 70). There is a strong effect of the Prandtl number on the potential energy, since
 $Pr$
controls the cascading process of the scalar. In the case of
 $Pr=70$
, the potential-energy distribution (figure 9
d) has a much smaller scale than that of the kinetic energy (figure 9
c), since the Batchelor scale is much smaller than the Kolmogorov scale, while in the case of
 $Pr=1$
(figures 9
a and 9
b), the length scales are comparable. On the other hand, the effect of
 $Pr$
on the kinetic-energy distribution is small, and the results for
 $Pr=1$
(figure 9
a) and
 $Pr=70$
(figure 9
c) are similar. However, the isosurfaces at
 $Pr=70$
have small undulations, which do not exist at
 $Pr=1$
. The undulations would be due to the energy converted from the potential energy at scales smaller than the Kolmogorov scale (cf. figure 14
a).
At this early time (
 $t=4$
), the flow is only weakly affected by buoyancy since the time in units of the Brunt–Väisälä period is small (
 $t^{\ast }/T_{BV}^{\ast }=N^{\ast }t^{\ast }/(2\unicode[STIX]{x03C0})=t/(2\unicode[STIX]{x03C0}Fr_{0})\simeq 0.64<1$
). For example, in the case of
 $Pr=70$
, the ratio
 $k_{K}/k_{O}$
(
 $\simeq 4$
, figure 7
a) gives a rather large value of
 $Re_{b}$
(
 $\simeq 6>1$
, figure 7
b), meaning that the stratification is effective only in the large-scale motion. Then, the kinetic-energy distribution looks nearly isotropic, and the scalar behaves like a passive scalar in isotropic turbulence (figures 9
c and 9
d). The large buoyancy Reynolds number
 $Re_{b}~({>}1)$
is maintained also for
 $Pr=1$
(figure 7
b). Therefore, both the kinetic- and potential-energy distributions appear approximately isotropic for both
 $Pr=1$
and 70.
Spatial distributions of the energies at
 $t=4$
. The panels show the isosurfaces of: (a) kinetic energy
 $u_{i}^{2}/2~(=3KE)$
at
 $Pr=1$
; (b) potential energy
 $\unicode[STIX]{x1D70C}^{\prime 2}/(2Fr_{0}^{2})~(=6PE)$
at
 $Pr=1$
; (c) kinetic energy
 $u_{i}^{2}/2~(=3KE)$
at
 $Pr=70$
; and (d) potential energy
 $\unicode[STIX]{x1D70C}^{\prime 2}/(2Fr_{0}^{2})~(=6PE)$
at
 $Pr=70$
.

As time proceeds, the Ozmidov scale becomes smaller (figure 7
a) and the buoyancy becomes dominant down to smaller scales, including the energy-containing scale. Then, the vertical kinetic energy becomes smaller than the horizontal kinetic energy, as observed in the previous experiments (e.g. Lienhard & Van Atta Reference Lienhard and Van Atta1990), numerical simulations (e.g. Riley et al.
Reference Riley, Metcalfe, Weissman and West1981; Métais & Herring Reference Métais and Herring1989) and in our figure 6. At a much later time (
 $t=40$
or
 $t^{\ast }/T_{BV}^{\ast }=N^{\ast }t^{\ast }/(2\unicode[STIX]{x03C0})\simeq 6.4>1$
), the isosurfaces of the kinetic and potential energy have pancake structures that enclose much of the kinetic and potential energies, as shown in figure 10. Since the smaller-scale fluctuations observed when
 $t=4$
(figure 9) have already decayed, only the large-scale structures remain. We note that the horizontal scales of isosurfaces are comparable in the kinetic- and potential-energy distributions, not only for
 $Pr=1$
(figures 10
a and 10
b) but also for
 $Pr=70$
(figures 10
c and 10
d). There are horizontal wrinkles on the surface of pancakes of potential energy at
 $Pr=70$
(cf. figure 11
f). These are the small-scale vertical structures observed only at high Prandtl numbers, not observed at lower Prandtl numbers (e.g. figure 10
b). We will discuss the dominance of the vertically sheared horizontal flow later (cf. figures 17 and 18).
Spatial distributions of the energies at
 $t=40$
. The panels show the isosurfaces of: (a) kinetic energy
 $u_{i}^{2}/2~(=2KE)$
at
 $Pr=1$
; (b) potential energy
 $\unicode[STIX]{x1D70C}^{\prime 2}/(2Fr_{0}^{2})~(=4PE)$
at
 $Pr=1$
; (c) kinetic energy
 $u_{i}^{2}/2~(=2KE)$
at
 $Pr=70$
; and (d) potential energy
 $\unicode[STIX]{x1D70C}^{\prime 2}/(2Fr_{0}^{2})~(=4PE)$
at
 $Pr=70$
.

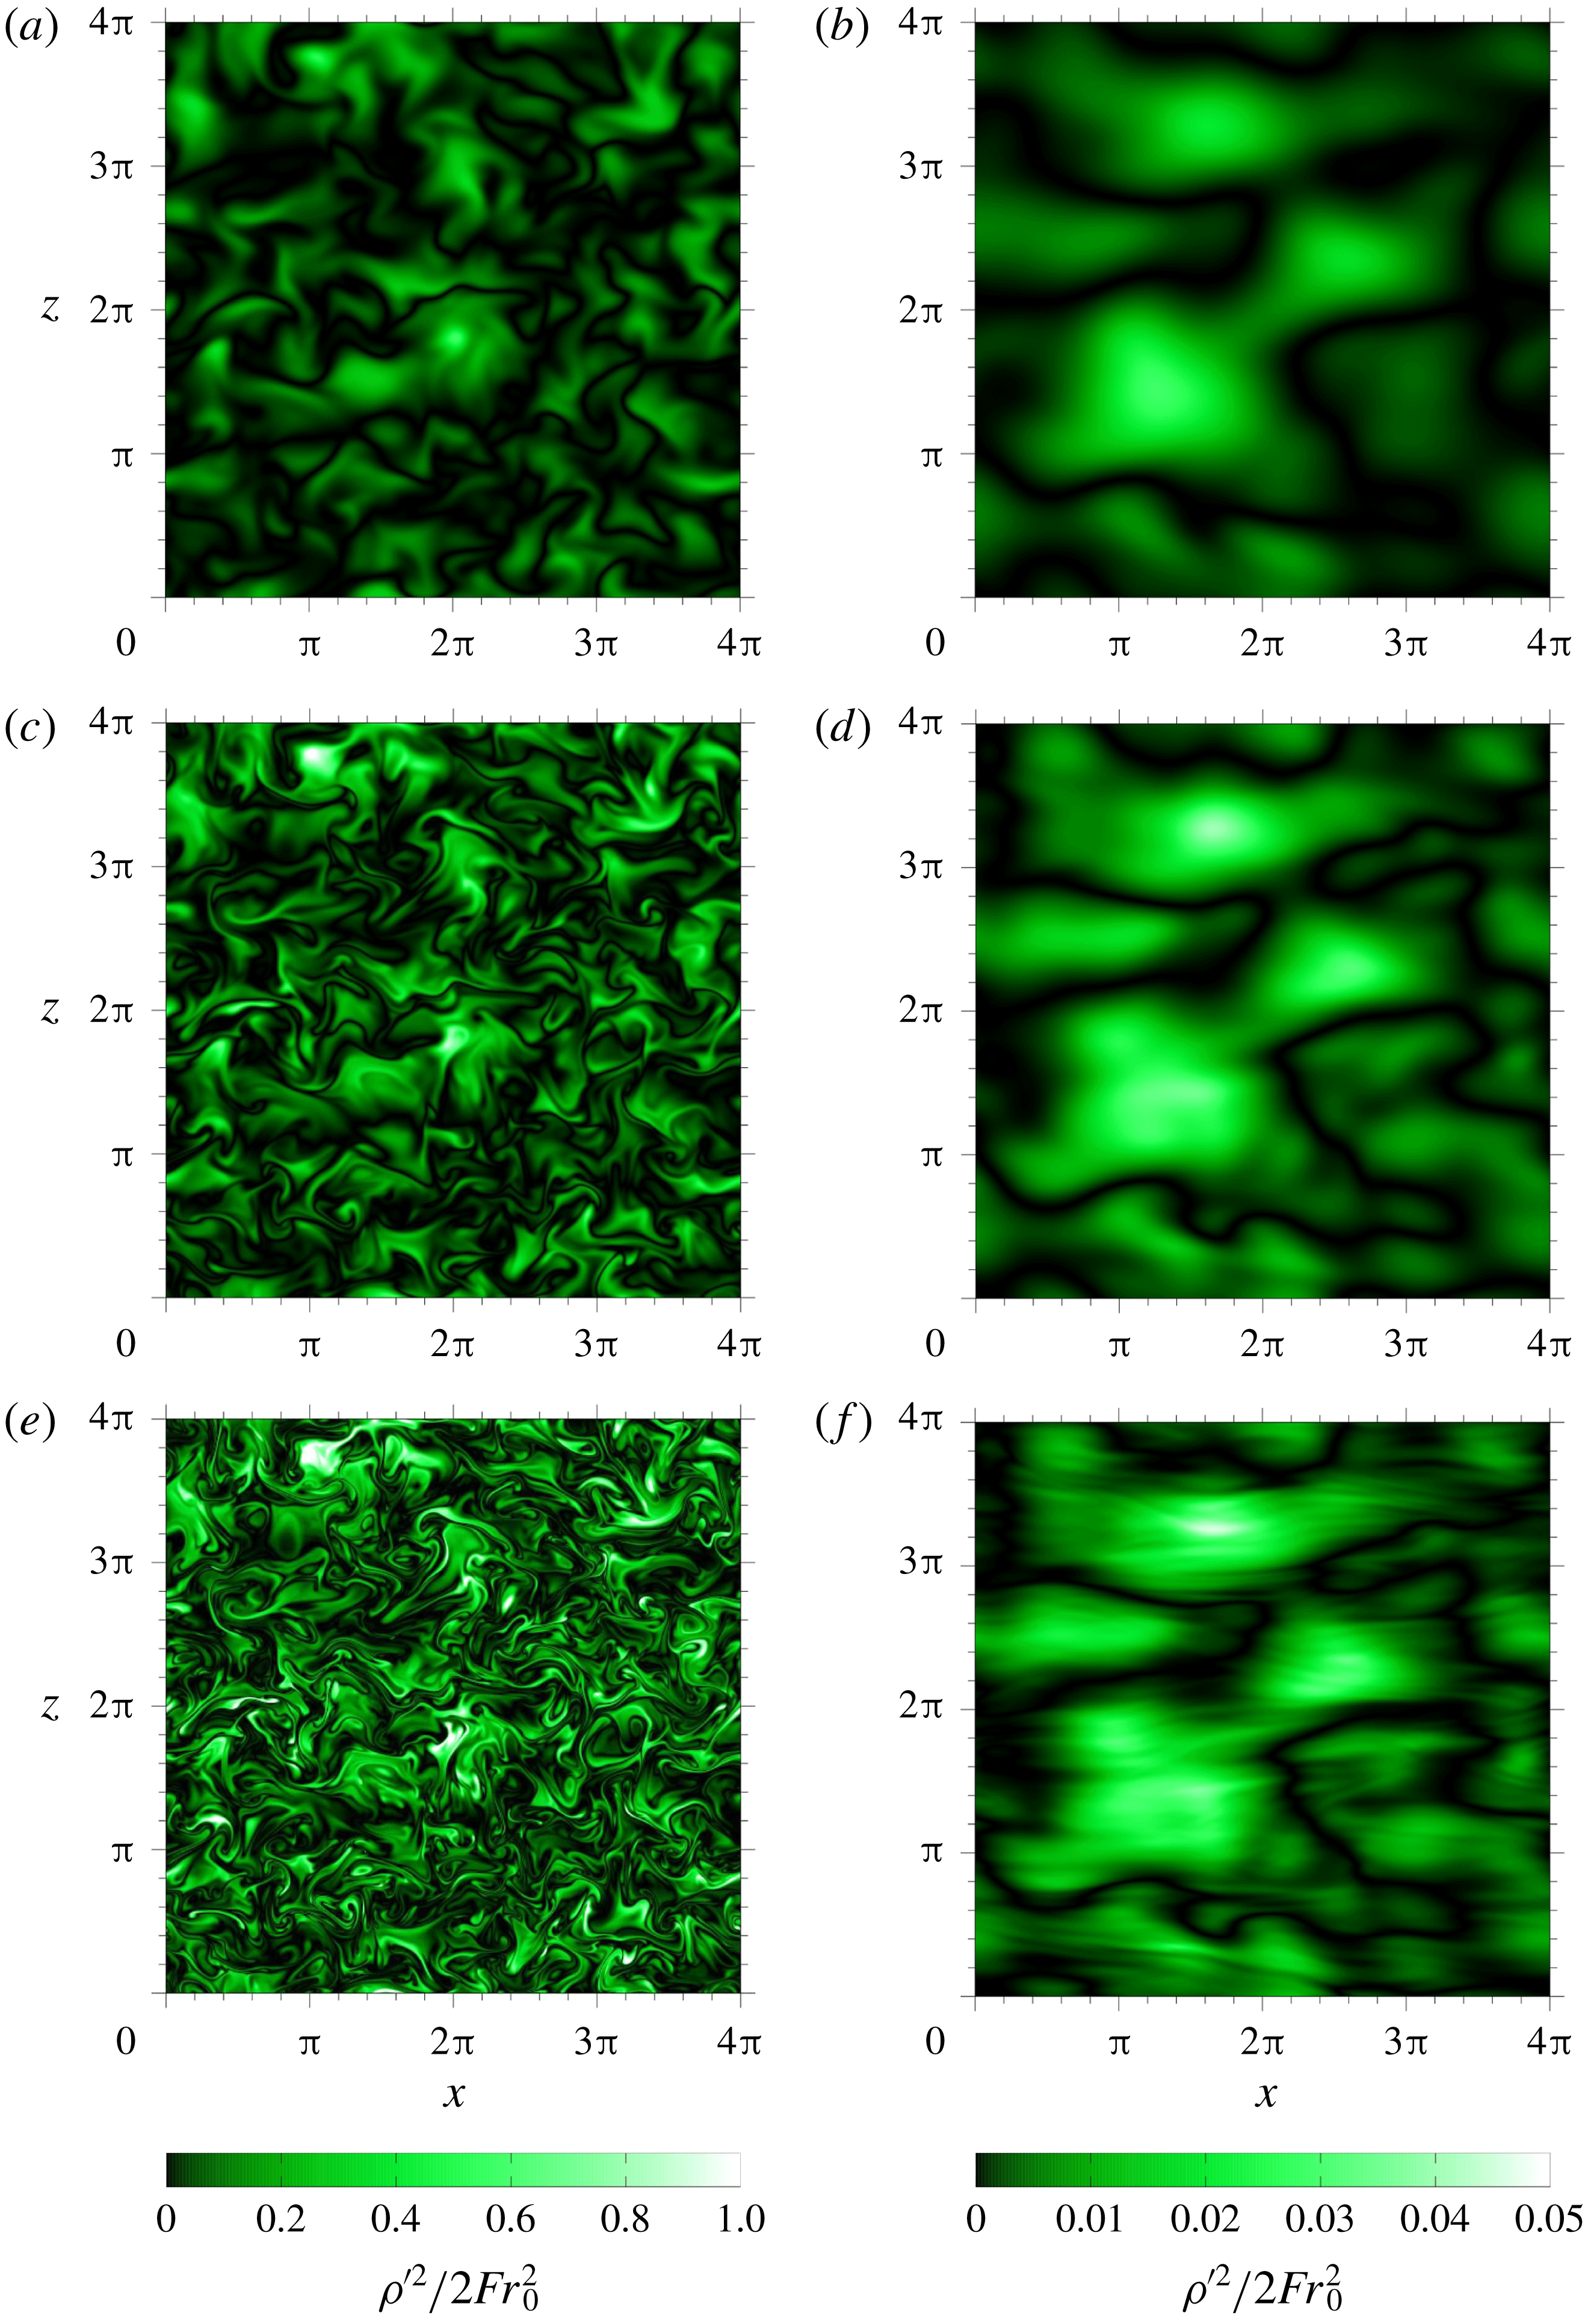
To observe the small-scale structures more clearly, the distributions of potential energy
 $\unicode[STIX]{x1D70C}^{\prime 2}/(2Fr_{0}^{2})$
in the vertical plane (
 $y=0$
) are presented in colour scale in figure 11, again at
 $t=4$
and 40. In agreement with figure 9, the potential-energy distribution at
 $t=4$
is affected significantly by the Prandtl number, and the result for
 $Pr=70$
(figure 11
e) contains much finer structures than those for lower Prandtl numbers (figures 11
a and 11
c). The structures at
 $t=40$
are rather independent of
 $Pr$
(figures 11
b, 11
d and 11
f) since most of the small-scale components below the Kolmogorov scale have decayed (cf. figures 13
c and 13
d). However, similar to the result at
 $t=4$
(figure 11
e), the vertical structure of the potential energy at high
 $Pr(=70)$
has components of very small scales, which appear as many thin horizontal streaks in figure 11(f). These streaks correspond to the horizontal wrinkles on the surface of pancakes (figure 10
d). These would be due to the high-vertical-wavenumber components observed in the potential-energy spectra, which will be discussed later (cf. figure 13
d).
Spatial distributions of the potential energy
 $\unicode[STIX]{x1D70C}^{\prime 2}/(2Fr_{0}^{2})$
in the vertical plane (
 $y=0$
). The panels show the colour-scale image at: (a)
 $Pr=1$
,
 $t=4$
; (b)
 $Pr=1$
,
 $t=40$
; (c)
 $Pr=7$
,
 $t=4$
; (d)
 $Pr=7$
,
 $t=40$
; (e)
 $Pr=70$
,
 $t=4$
; and (f)
 $Pr=70$
,
 $t=40$
.
The agreement between the horizontal scales of the velocity and density perturbations at long time, observed even at a high Prandtl number (
 $Pr=70$
) in figure 10, is identified in figure 12 by the longitudinal Taylor microscales of velocity
 $$\begin{eqnarray}\unicode[STIX]{x1D706}_{i}^{2}=\overline{u_{i}^{2}}\!\!\left/\,\overline{\left(\frac{\unicode[STIX]{x2202}u_{i}}{\unicode[STIX]{x2202}x_{i}}\right)^{2}},\right.\quad (i=1,2,3),\end{eqnarray}$$
(no summation is taken over the repeated index
 $i$
), and those of density perturbation
 $$\begin{eqnarray}\unicode[STIX]{x1D706}_{\unicode[STIX]{x1D70C}^{\prime },i}^{2}=\overline{\unicode[STIX]{x1D70C}^{\prime 2}}\!\!\left/\,\overline{\left(\frac{\unicode[STIX]{x2202}\unicode[STIX]{x1D70C}^{\prime }}{\unicode[STIX]{x2202}x_{i}}\right)^{2}},\right.\quad (i=1,2,3),\end{eqnarray}$$
where
 $\unicode[STIX]{x1D706}_{1}$
and
 $\unicode[STIX]{x1D706}_{3}$
are associated with the horizontal and vertical scales of velocity, and
 $\unicode[STIX]{x1D706}_{\unicode[STIX]{x1D70C}^{\prime },1}$
and
 $\unicode[STIX]{x1D706}_{\unicode[STIX]{x1D70C}^{\prime },3}$
are associated with those of density perturbations (e.g. Riley et al.
Reference Riley, Metcalfe, Weissman and West1981). The initial values of
 $\unicode[STIX]{x1D706}_{1}$
and
 $\unicode[STIX]{x1D706}_{3}$
are almost equal (
 $\unicode[STIX]{x1D706}_{1}=\unicode[STIX]{x1D706}_{3}$
) since the initial velocity fluctuations are isotropic. However, as time proceeds, the horizontal microscales become larger than the vertical microscales (
 $\unicode[STIX]{x1D706}_{1}>\unicode[STIX]{x1D706}_{3}$
and
 $\unicode[STIX]{x1D706}_{\unicode[STIX]{x1D70C}^{\prime },1}>\unicode[STIX]{x1D706}_{\unicode[STIX]{x1D70C}^{\prime },3}$
), corresponding to the appearance of the pancake structure in the kinetic and potential-energy distributions (e.g. at
 $t=40$
, figure 10).
When
 $Pr=1$
(figure 12
a), the microscales of velocity are nearly equal to those of density perturbation at all times (i.e.
 $\unicode[STIX]{x1D706}_{1}\simeq \unicode[STIX]{x1D706}_{\unicode[STIX]{x1D70C}^{\prime },1}$
and
 $\unicode[STIX]{x1D706}_{3}\simeq \unicode[STIX]{x1D706}_{\unicode[STIX]{x1D70C}^{\prime },3}$
). With the increase of
 $Pr$
(
 $=70$
, figure 12
b), however, the temporal behaviour of the microscales of density perturbation (
 $\unicode[STIX]{x1D706}_{\unicode[STIX]{x1D70C}^{\prime },1}$
and
 $\unicode[STIX]{x1D706}_{\unicode[STIX]{x1D70C}^{\prime },3}$
) changes significantly, while that of the velocity microscales (
 $\unicode[STIX]{x1D706}_{1}$
and
 $\unicode[STIX]{x1D706}_{3}$
) changes only a little. Namely, the microscales
 $\unicode[STIX]{x1D706}_{\unicode[STIX]{x1D70C}^{\prime },1}$
and
 $\unicode[STIX]{x1D706}_{\unicode[STIX]{x1D70C}^{\prime },3}$
initially decrease significantly due to the initial potential-energy cascade (
 $t\lesssim 4$
), but after that, they increase again, and the horizontal microscale of density perturbation
 $\unicode[STIX]{x1D706}_{\unicode[STIX]{x1D70C}^{\prime },1}$
becomes almost equal to the horizontal microscale of velocity
 $\unicode[STIX]{x1D706}_{1}$
at large times (
 $t\gtrsim 30$
). The increase of the vertical microscale
 $\unicode[STIX]{x1D706}_{\unicode[STIX]{x1D70C}^{\prime },3}$
is not so large, and it is still smaller than the vertical microscale of velocity
 $\unicode[STIX]{x1D706}_{3}$
at the end of the simulation (
 $t=40$
). These results are consistent with the agreement only in the horizontal scale of the kinetic- and potential-energy distributions at
 $Pr=70$
(figure 10
c,d).
Temporal variation of the horizontal and vertical Taylor microscales of velocity and density perturbation for (a)
 $Pr=1$
and (b)
 $Pr=70$
.

3.3 Energy spectra
We next present the energy spectrum in order to further investigate the small-scale anisotropy of the high-
 $Pr$
scalar distribution at late times. The horizontal and the vertical spectra of the kinetic energy are defined by
 $$\begin{eqnarray}E_{K}(k_{H})=\mathop{\sum }_{\substack{ \left|\sqrt{k_{x}^{2}+k_{y}^{2}}-k_{H}\right|<k_{min}/2 \\ k_{z}}}\frac{1}{2}|\hat{u} _{i}(k_{x},k_{y},k_{z})|^{2}\,\frac{1}{k_{min}}\end{eqnarray}$$
and
 $$\begin{eqnarray}E_{K}(k_{V})=\mathop{\sum }_{\substack{ |k_{z}|=k_{V} \\ k_{x},k_{y}}}\frac{1}{2}|\hat{u} _{i}(k_{x},k_{y},k_{z})|^{2}\,\frac{1}{k_{min}},\end{eqnarray}$$
respectively. Here,
 $\hat{u} _{i}$
denotes the Fourier component of
 $u_{i}$
, its argument
 $(k_{x},k_{y},k_{z})$
is the wavenumber vector, and the minimum wavenumber
 $k_{min}$
is 0.5 since the side of the computational box is
 $4\unicode[STIX]{x03C0}$
in the non-dimensional form. Similarly, we define the horizontal and vertical potential-energy spectra as follows:
 $$\begin{eqnarray}E_{P}(k_{H})=\mathop{\sum }_{\substack{ \left|\sqrt{k_{x}^{2}+k_{y}^{2}}-k_{H}\right|<k_{min}/2 \\ k_{z}}}\frac{1}{2Fr_{0}^{2}}|\hat{\unicode[STIX]{x1D70C}^{\prime }}(k_{x},k_{y},k_{z})|^{2}\,\frac{1}{k_{min}},\end{eqnarray}$$
and
 $$\begin{eqnarray}E_{P}(k_{V})=\mathop{\sum }_{\substack{ |k_{z}|=k_{V} \\ k_{x},k_{y}}}\frac{1}{2Fr_{0}^{2}}|\hat{\unicode[STIX]{x1D70C}^{\prime }}(k_{x},k_{y},k_{z})|^{2}\,\frac{1}{k_{min}}.\end{eqnarray}$$
The horizontal and vertical spectra of the kinetic and potential energy at
 $t=4$
and
 $t=40$
are plotted in figure 13 for all the Prandtl numbers.
At an early time of
 $t=4$
(figure 13
a,b), the Kolmogorov wavenumber is greater than the Ozmidov wavenumber (i.e.
 $Re_{b}>1$
) and the buoyancy does not affect the flow at the Kolmogorov scale. Indeed, the comparison between figures 13(a) and 13(b) shows that the isotropy of the velocity and density perturbations (
 $E_{K}(k_{H})\sim E_{K}(k_{V})$
and
 $E_{P}(k_{H})\sim E_{P}(k_{V})$
at the same
 $k_{H}$
and
 $k_{V}$
) still remains below the Kolmogorov scale. We note also that when
 $Pr=1$
, i.e. when the Kolmogorov scale and the Batchelor scale agree, the kinetic-energy spectra are almost equal to the potential-energy spectra at high wavenumbers (i.e.
 $E_{K}(k_{H})=E_{P}(k_{H})$
at
 $k_{H}\gtrsim k_{K}$
and
 $E_{K}(k_{V})=E_{P}(k_{V})$
at
 $k_{V}\gtrsim k_{K}$
). The potential-energy spectra below the Kolmogorov scale are larger for a larger Prandtl number due to the scalar cascade to a smaller diffusion scale. The kinetic-energy spectra below the Kolmogorov scale also increase with the Prandtl number due to the larger energy conversion from the potential energy by the vertical density flux (cf. figures 3
a,b and 14
a). On the other hand, at large scales (
 $k<k_{K}$
), the difference due to the Prandtl number is small in figure 13(a,b). The
 $k^{-1}$
power law of the potential-energy spectrum appears at
 $Pr=70$
for
 $k_{K}\lesssim k_{H}\lesssim k_{B}$
and
 $k_{K}\lesssim k_{V}\lesssim k_{B}$
, showing that Batchelor’s theory holds until the buoyancy affects the sub-Kolmogorov scale (i.e. when
 $k_{O}<k_{K}$
). The
 $k_{H}^{-5/3}$
law of the energy spectra, which is observed by the recent high-
 $Re$
simulations at
 $Pr=1$
(e.g. Lindborg Reference Lindborg2006; Brethouwer et al.
Reference Brethouwer, Billant, Lindborg and Chomaz2007; Bartello & Tobias Reference Bartello and Tobias2013; de Bruyn Kops Reference de Bruyn Kops2015; Maffioli & Davidson Reference Maffioli and Davidson2016), is absent in the present result. This would be due to the low Reynolds number used in this study. The spectra will be observed if the Reynolds number becomes sufficiently large, since the low-wavenumber (
 $k<k_{K}$
) spectra would not be affected significantly by the Prandtl number.
The energy spectra in the final period of decay (
 $t=40$
), i.e. when the Ozmidov wavenumber is far beyond the Kolmogorov wavenumber (
 $k_{K}\ll k_{O}$
or
 $Re_{b}\ll 1$
, cf. figure 7), are presented in figure 13(c,d). In figure 13(c), the horizontal spectra of potential energy
 $E_{P}(k_{H})$
for
 $Pr=7$
and 70 decrease significantly at high wavenumbers, compared to the other spectra. These spectral curves approach the curves of kinetic-energy spectra
 $E_{K}(k_{H})$
since the energy is converted from potential energy to kinetic energy via the vertical density flux. For example, when
 $Pr=7$
, the two spectral curves of
 $E_{P}(k_{H})$
and
 $E_{K}(k_{H})$
almost agree for
 $k_{K}<k_{H}\lesssim 10$
. The tendency is weaker in the vertical spectra of potential energy
 $E_{P}(k_{V})$
for
 $Pr=7$
and 70 (figure 13
d). This corresponds to the Prandtl-number dependence of the potential-energy distributions observed in figures 10 and 11, where the small-scale fluctuations in the vertical direction existed only in the case of
 $Pr=70$
(figure 10
d) and not in the case of
 $Pr=1$
(figure 10
b).
Plots of (a)
 $E_{K}(k_{H})$
and
 $E_{P}(k_{H})$
at
 $t=4$
, (b)
 $E_{K}(k_{V})$
and
 $E_{P}(k_{V})$
at
 $t=4$
, (c)
 $E_{K}(k_{H})$
and
 $E_{P}(k_{H})$
at
 $t=40$
and (d)
 $E_{K}(k_{V})$
and
 $E_{P}(k_{V})$
at
 $t=40$
, where the four energy spectra
 $E_{K}(k_{H}),E_{K}(k_{V}),E_{P}(k_{H})$
and
 $E_{P}(k_{V})$
are defined by (3.6)–(3.9). The Kolmogorov, Ozmidov and Batchelor wavenumbers for
 $Pr=70$
are indicated by the arrows at the top of each panel.

Figure 14(a) shows the Prandtl-number dependence of the co-spectrum of the vertical density flux
 $$\begin{eqnarray}C_{\unicode[STIX]{x1D70C}^{\prime }w}(k)=\mathop{\sum }_{\left|\sqrt{k_{x}^{2}+k_{y}^{2}+k_{z}^{2}}-k\right|<k_{min}/2}\frac{1}{Fr_{0}^{2}}\,\text{Re}[\hat{\unicode[STIX]{x1D70C}^{\prime }}(k_{x},k_{y},k_{z}){\hat{w}}^{\ast }(k_{x},k_{y},k_{z})]\,\frac{1}{k_{min}},\end{eqnarray}$$
which satisfies
 $$\begin{eqnarray}\frac{1}{Fr_{0}^{2}}\overline{\unicode[STIX]{x1D70C}^{\prime }w}=\int _{0}^{\infty }C_{\unicode[STIX]{x1D70C}^{\prime }w}(k)\,\text{d}k,\end{eqnarray}$$
where the asterisk in (3.10) denotes the complex conjugate, and not a dimensional quantity. The co-spectrum at large scales (
 $k\lesssim k_{O}$
) oscillates in time and changes sign, i.e. it is positive when
 $t=4$
(figure 14
a), while it is negative when
 $t=6$
. On the other hand, the co-spectrum at wavenumbers larger than the Kolmogorov wavenumber (
 $k\gtrsim k_{K}$
) is persistently negative and counter-gradient, showing that the potential energy is converted continuously into kinetic energy.
The larger potential energy in the small-scale fluctuations of a higher-Prandtl-number scalar would lead to a stronger counter-gradient flux at small scales, so that the vertical density flux
 $\overline{\unicode[STIX]{x1D70C}^{\prime }w}/Fr_{0}^{2}$
becomes more strongly counter-gradient (figure 3
a). At the same time, the kinetic-energy spectra
 $E_{K}(k_{H})$
and
 $E_{K}(k_{V})$
decay more slowly near the Kolmogorov wavenumber (figure 13
a,b).
The same spectral behaviour has been observed in the previous experiments. For example, water channel experiments for salt stratification (
 $Pr=700$
; Komori & Nagata Reference Komori and Nagata1996) showed a strong counter-gradient flux at high wavenumbers. On the other hand, wind tunnel experiments for thermally stratified flow (
 $Pr=0.7$
; Lienhard & Van Atta Reference Lienhard and Van Atta1990) showed a weaker counter-gradient flux at low wavenumbers. In a numerical simulation for two Prandtl numbers (
 $Pr=1$
and 2), Gerz & Yamazaki (Reference Gerz and Yamazaki1993) found a persistent counter-gradient flux at high wavenumbers only for
 $Pr=2$
. Similar Prandtl-number dependence has been obtained by the rapid distortion theory (RDT) (Hanazaki & Hunt Reference Hanazaki and Hunt1996).
Prandtl-number dependence of (a) the co-spectrum of the vertical density flux,
 $C_{\unicode[STIX]{x1D70C}^{\prime }w}(k)$
, and (b) dissipation spectra of kinetic and potential energies,
 $D_{K}(k)$
and
 $D_{P}(k)$
, in the pre-multiplied form at
 $t=4$
. The Kolmogorov, Ozmidov and Batchelor wavenumbers for
 $Pr=70$
are indicated by the arrows at the top of each panel.

In figure 14(b) we show the pre-multiplied spectra of energy dissipation rates at
 $t=4$
. The dissipation spectra of kinetic energy and potential energy are defined by
 $$\begin{eqnarray}D_{K}(k)=\mathop{\sum }_{\left|\sqrt{k_{x}^{2}+k_{y}^{2}+k_{z}^{2}}-k\right|<k_{min}/2}\frac{k_{j}^{2}}{Re_{0}}|\hat{u} _{i}(k_{x},k_{y},k_{z})|^{2}\,\frac{1}{k_{min}},\end{eqnarray}$$
and
 $$\begin{eqnarray}D_{P}(k)=\mathop{\sum }_{\left|\sqrt{k_{x}^{2}+k_{y}^{2}+k_{z}^{2}}-k\right|<k_{min}/2}\frac{k_{j}^{2}}{Pr\,Re_{0}Fr_{0}^{2}}|\hat{\unicode[STIX]{x1D70C}^{\prime }}(k_{x},k_{y},k_{z})|^{2}\,\frac{1}{k_{min}},\end{eqnarray}$$
respectively. The peak wavenumber of kinetic-energy dissipation (
 $kD_{K}(k)$
) shifts only slightly with
 $Pr$
, while that of potential-energy dissipation (
 $kD_{P}(k)$
) increases significantly with
 $Pr$
. Figure 14(b) shows also that the peak wavenumber of
 $kD_{K}(k)$
is close to the Kolmogorov wavenumber
 $k_{K}$
, and the peak of
 $kD_{P}(k)$
is close to the Batchelor wavenumber
 $k_{B}$
. The increase of the maximum value of
 $kD_{K}(k)$
with
 $Pr$
explains the slight increase of
 $\unicode[STIX]{x1D716}_{K}$
as already discussed in figure 3(b). A similar trend has been observed in the vorticity spectrum of the turbulent mixing layer (see figures 12 and 13 of Salehipour et al. (Reference Salehipour, Peltier and Mashayek2015)).
We now examine whether the energy spectra obey the well-known scaling laws. The potential-energy spectra normalised by the strain rate at the Kolmogorov scale
 $(\unicode[STIX]{x1D708}^{\ast }/\unicode[STIX]{x1D716}_{K}^{\ast })^{1/2}$
, the potential-energy dissipation rate
 $\unicode[STIX]{x1D716}_{P}^{\ast }$
and the scalar diffusion coefficient
 $\unicode[STIX]{x1D705}^{\ast }$
for
 $Pr=70$
are shown in figure 15. Note that the Kolmogorov wavenumber normalised by the Batchelor wavenumber is constant in time:
 $k_{K}^{\ast }/k_{B}^{\ast }=1/\sqrt{70}\simeq 0.12$
. When
 $t\lesssim 10$
, the spectral collapse onto a single curve at wavenumbers higher than the Batchelor wavenumber and the
 $k^{-1}$
power law are clearly found in both the horizontal and the vertical spectra as well as the passive scalar spectrum (e.g. Bogucki et al.
Reference Bogucki, Domaradzki and Yeung1997; Yeung et al.
Reference Yeung, Xu, Donzis and Sreenivasan2004). After
 $t\sim 10$
, at which the Ozmidov wavenumber exceeds the Kolmogorov wavenumber, the horizontal spectrum begins to decrease in
 $k_{H}^{\ast }>k_{K}^{\ast }$
and increase in
 $k_{H}^{\ast }<k_{K}^{\ast }$
, resulting in a very steep spectrum. On the other hand, the Batchelor scaling reasonably holds for the vertical spectrum even after the Ozmidov wavenumber exceeds the Kolmogorov wavenumber (
 $t\gtrsim 10$
); they converge well in
 $k_{V}^{\ast }>k_{K}^{\ast }$
as shown in figure 15(b). It is also found that the slope around
 $k_{V}^{\ast }/k_{B}^{\ast }\simeq 5\times 10^{-2}$
becomes steeper as time passes, and eventually approaches
 $-3$
.
Normalised potential-energy spectrum for
 $Pr=70$
: (a) horizontal spectrum and (b) vertical spectrum. The vertical solid line shows the Kolmogorov wavenumber divided by the Batchelor wavenumber, i.e.
 $k_{K}^{\ast }/k_{B}^{\ast }=1/\sqrt{70}\simeq 0.12$
.

Figure 16 presents the kinetic-energy spectra for
 $Pr=70$
normalised by the energy dissipation
 $\unicode[STIX]{x1D716}_{K}^{\ast }$
and the kinematic viscosity
 $\unicode[STIX]{x1D708}^{\ast }$
. The result is similar to the normalised potential-energy spectrum in the sense that the horizontal spectrum deviates from the Kolmogorov scaling when
 $t\gtrsim 10$
, whereas the vertical spectrum completely collapses onto a single curve. The collapse of the vertical spectrum is also reported by the experiment using a salt-stratified fluid by Praud et al. (Reference Praud, Fincham and Sommeria2005). However, the
 $k_{V}^{-3}$
power law in the vertical spectrum they observed is not found in figure 16(b) because the Reynolds number is too small to realise such a constant slope in the low-wavenumber range in our simulations. The normalised spectrum of the vertical velocity in salt-stratified water experiments (
 $Pr=700$
) is presented in figure 19 of Itsweire et al. (Reference Itsweire, Helland and Van Atta1986), showing a slight dispersion at
 $k_{x}^{\ast }/k_{K}^{\ast }\gtrsim 10^{0}$
. Though they attributed the dispersion of the spectra at high wavenumbers to experimental noise, the energy spectrum could actually deviate from the universal curve since the Kolmogorov scale approaches the Ozmidov scale far downstream of the water channel in their experiment (cf. their figures 4 and 8).
Normalised kinetic-energy spectrum for
 $Pr=70$
: (a) horizontal spectrum and (b) vertical spectrum. The vertical solid line shows
 $k_{H}^{\ast }/k_{K}^{\ast }=1$
or
 $k_{V}^{\ast }/k_{K}^{\ast }=1$
.

3.4 Generation of the vertically thin structures in the density perturbation
In the remainder of this paper, we discuss how the anisotropic distribution of the potential energy at high wavenumbers for high Prandtl numbers is generated. According to Batchelor (Reference Batchelor1959), the scalar fluctuations smaller than the Kolmogorov scale are generated by a straining motion of the fluid at the Kolmogorov scale. Thus, we examine the direction of the principal axes of the strain-rate tensor, which is defined by
 $\unicode[STIX]{x1D61A}_{ij}=(\unicode[STIX]{x2202}u_{i}/\unicode[STIX]{x2202}x_{j}+\unicode[STIX]{x2202}u_{j}/\unicode[STIX]{x2202}x_{i})/2$
. Since the strain-rate tensor is a real-valued symmetric tensor, it has three principal values (
 $\unicode[STIX]{x1D6FC}\geqslant \unicode[STIX]{x1D6FD}\geqslant \unicode[STIX]{x1D6FE}$
) and the corresponding principal axes (
 $\unicode[STIX]{x1D736},\unicode[STIX]{x1D737}$
and
 $\unicode[STIX]{x1D738}$
) are orthogonal. The incompressibility condition (
 $\unicode[STIX]{x1D6FC}+\unicode[STIX]{x1D6FD}+\unicode[STIX]{x1D6FE}=0$
) requires
 $\unicode[STIX]{x1D6FC}>0$
and
 $\unicode[STIX]{x1D6FE}<0$
. We consider the cosines of the angles between the principal axes and the vertical axis,
 $$\begin{eqnarray}\cos \unicode[STIX]{x1D703}_{z\unicode[STIX]{x1D6FC}}=\boldsymbol{e}_{z}\boldsymbol{\cdot }\unicode[STIX]{x1D736},\quad \cos \unicode[STIX]{x1D703}_{z\unicode[STIX]{x1D6FD}}=\boldsymbol{e}_{z}\boldsymbol{\cdot }\unicode[STIX]{x1D737},\quad \cos \unicode[STIX]{x1D703}_{z\unicode[STIX]{x1D6FE}}=\boldsymbol{e}_{z}\boldsymbol{\cdot }\unicode[STIX]{x1D738},\end{eqnarray}$$
and the cosine of the angle between the density gradient and the vertical axis,
 $$\begin{eqnarray}\cos \unicode[STIX]{x1D703}_{z\unicode[STIX]{x1D70C}^{\prime }}=\boldsymbol{e}_{z}\boldsymbol{\cdot }\frac{\unicode[STIX]{x1D735}\unicode[STIX]{x1D70C}^{\prime }}{|\unicode[STIX]{x1D735}\unicode[STIX]{x1D70C}^{\prime }|},\end{eqnarray}$$
where
 $\boldsymbol{e}_{z}$
is the unit vector in the vertical direction.
Figure 17(a) presents the probability density functions (p.d.f.s) of
 $|\text{cos}\,\unicode[STIX]{x1D703}_{z\unicode[STIX]{x1D6FC}}|$
,
 $|\text{cos}\,\unicode[STIX]{x1D703}_{z\unicode[STIX]{x1D6FD}}|$
,
 $|\text{cos}\,\unicode[STIX]{x1D703}_{z\unicode[STIX]{x1D6FE}}|$
and
 $|\text{cos}\,\unicode[STIX]{x1D703}_{z\unicode[STIX]{x1D70C}^{\prime }}|$
for
 $Pr=70$
at
 $t=4$
. The highest probability of
 $|\text{cos}\,\unicode[STIX]{x1D703}_{z\unicode[STIX]{x1D6FC}}|$
and
 $|\text{cos}\,\unicode[STIX]{x1D703}_{z\unicode[STIX]{x1D6FE}}|$
occurs when
 $|\text{cos}\,\unicode[STIX]{x1D703}_{z\unicode[STIX]{x1D6FC}}|=1$
(or
 $\unicode[STIX]{x1D703}_{z\unicode[STIX]{x1D6FC}}=0,\unicode[STIX]{x03C0}$
) and
 $|\text{cos}\,\unicode[STIX]{x1D703}_{z\unicode[STIX]{x1D6FE}}|=1$
(or
 $\unicode[STIX]{x1D703}_{z\unicode[STIX]{x1D6FE}}=0,\unicode[STIX]{x03C0}$
), respectively, indicating that the most expansive direction (
 $\unicode[STIX]{x1D736}$
) and the most contractive direction (
 $\unicode[STIX]{x1D738}$
) tend to align with the vertical axis probably because of the Brunt–Väisälä oscillation due to the buoyancy. However,
 $\unicode[STIX]{x1D736}$
and
 $\unicode[STIX]{x1D738}$
cannot align with the vertical axis at the same time because they are orthogonal. This can be confirmed by the joint p.d.f. of
 $|\text{cos}\,\unicode[STIX]{x1D703}_{z\unicode[STIX]{x1D6FC}}|$
and
 $|\text{cos}\,\unicode[STIX]{x1D703}_{z\unicode[STIX]{x1D6FE}}|$
in figure 17(b). There are two local maxima at
 $(|\text{cos}\,\unicode[STIX]{x1D703}_{z\unicode[STIX]{x1D6FC}}|,|\text{cos}\,\unicode[STIX]{x1D703}_{z\unicode[STIX]{x1D6FE}}|)=(0,1)$
and
 $(1,0)$
. Also, the probability density of
 $|\text{cos}\,\unicode[STIX]{x1D703}_{z\unicode[STIX]{x1D6FD}}|$
becomes largest when
 $|\text{cos}\,\unicode[STIX]{x1D703}_{z\unicode[STIX]{x1D6FD}}|=0$
(or
 $\unicode[STIX]{x1D703}_{z\unicode[STIX]{x1D6FD}}=\unicode[STIX]{x03C0}/2$
), as shown in figure 17(a). After all, at an early time of
 $t=4$
, either the most expansive direction (
 $\unicode[STIX]{x1D736}$
) or the most contractive direction (
 $\unicode[STIX]{x1D738}$
) tends to be along the vertical axis, while the other two principal axes are horizontal. The p.d.f.s of
 $|\text{cos}\,\unicode[STIX]{x1D703}_{z\unicode[STIX]{x1D6FC}}|$
,
 $|\text{cos}\,\unicode[STIX]{x1D703}_{z\unicode[STIX]{x1D6FD}}|$
and
 $|\text{cos}\,\unicode[STIX]{x1D703}_{z\unicode[STIX]{x1D6FE}}|$
are nearly independent of time until the Ozmidov wavenumber approaches the Kolmogorov wavenumber (
 $3\lesssim t\lesssim 6$
). Figure 17(a) also shows that the probability density of
 $|\text{cos}\,\unicode[STIX]{x1D703}_{z\unicode[STIX]{x1D70C}^{\prime }}|$
becomes highest at
 $|\text{cos}\,\unicode[STIX]{x1D703}_{z\unicode[STIX]{x1D70C}^{\prime }}|=1$
, indicating that the density gradient
 $\unicode[STIX]{x1D735}\unicode[STIX]{x1D70C}^{\prime }$
tends to be vertical and the horizontally flat distribution of density begins to be generated.
(a,c) The p.d.f.s of
 $|\text{cos}\,\unicode[STIX]{x1D703}_{z\unicode[STIX]{x1D6FC}}|$
,
 $|\text{cos}\,\unicode[STIX]{x1D703}_{z\unicode[STIX]{x1D6FD}}|$
,
 $|\text{cos}\,\unicode[STIX]{x1D703}_{z\unicode[STIX]{x1D6FE}}|$
and
 $|\text{cos}\,\unicode[STIX]{x1D703}_{z\unicode[STIX]{x1D70C}^{\prime }}|$
for
 $Pr=70$
. (b,d) Joint p.d.f.s of
 $|\text{cos}\,\unicode[STIX]{x1D703}_{z\unicode[STIX]{x1D6FC}}|$
and
 $|\text{cos}\,\unicode[STIX]{x1D703}_{z\unicode[STIX]{x1D6FE}}|$
for
 $Pr=70$
. Time (a,b)
 $t=4$
and (c,d)
 $t=40$
.

Figure 17(c) shows the p.d.f.s at
 $t=40$
. The p.d.f.s of
 $|\text{cos}\,\unicode[STIX]{x1D703}_{z\unicode[STIX]{x1D6FC}}|$
and
 $|\text{cos}\,\unicode[STIX]{x1D703}_{z\unicode[STIX]{x1D6FE}}|$
have a peak at
 $|\text{cos}\,\unicode[STIX]{x1D703}_{z\unicode[STIX]{x1D6FC}}|\sim 0.8$
and
 $|\text{cos}\,\unicode[STIX]{x1D703}_{z\unicode[STIX]{x1D6FE}}|\sim 0.7$
, respectively. The joint p.d.f. of
 $|\text{cos}\,\unicode[STIX]{x1D703}_{z\unicode[STIX]{x1D6FC}}|$
and
 $|\text{cos}\,\unicode[STIX]{x1D703}_{z\unicode[STIX]{x1D6FE}}|$
in figure 17(d) displays only one peak at
 $|\text{cos}\,\unicode[STIX]{x1D703}_{z\unicode[STIX]{x1D6FC}}|\sim |\text{cos}\,\unicode[STIX]{x1D703}_{z\unicode[STIX]{x1D6FE}}|\sim 0.7\sim 1/\sqrt{2}$
, meaning that both the most expansive direction (
 $\unicode[STIX]{x1D736}$
) and the most contractive direction (
 $\unicode[STIX]{x1D738}$
) tend to make an angle of
 $45^{\circ }$
with the vertical axis. This situation occurs when the vertical shear of the horizontal flow is dominant in the strain-rate tensor (appendix A). The transition to the p.d.f.s corresponding to the vertically sheared horizontal flow takes place when the Ozmidov wavenumber becomes as large as the Kolmogorov wavenumber (
 $t\sim 8$
for
 $Pr=70$
). Smyth (Reference Smyth1999) also reported that
 $\unicode[STIX]{x1D736}$
and
 $\unicode[STIX]{x1D738}$
point at
 $45^{\circ }$
from the vertical after the stratified shear turbulence triggered by the Kelvin–Helmholtz instability had decayed (
 $Re_{b}\rightarrow 1$
) and the flow exhibits a pancake structure. The p.d.f. of
 $|\text{cos}\,\unicode[STIX]{x1D703}_{z\unicode[STIX]{x1D70C}^{\prime }}|$
shows that the density gradient tends to direct towards the vertical axis, and the tendency is much more significant compared to the case of
 $t=4$
.
In order to investigate whether the vertically sheared horizontal flow is dominant at late times in our simulation, we decompose the kinetic-energy dissipation rate into four components:
 $$\begin{eqnarray}\displaystyle & \!\!\displaystyle \unicode[STIX]{x1D716}_{H,H}=\frac{1}{Re_{0}}\overline{\left(\frac{\unicode[STIX]{x2202}u}{\unicode[STIX]{x2202}x}\right)^{\!2}\!+\left(\frac{\unicode[STIX]{x2202}u}{\unicode[STIX]{x2202}y}\right)^{\!2}\!+\left(\frac{\unicode[STIX]{x2202}v}{\unicode[STIX]{x2202}x}\right)^{\!2}\!+\left(\frac{\unicode[STIX]{x2202}v}{\unicode[STIX]{x2202}y}\right)^{\!2}}\quad \!(horizontal~shear~of~horizontal~flow),\hspace{-8.39996pt} & \displaystyle \nonumber\\ \displaystyle & & \displaystyle\end{eqnarray}$$
 $$\begin{eqnarray}\displaystyle & \!\!\displaystyle \unicode[STIX]{x1D716}_{H,V}=\frac{1}{Re_{0}}\overline{\left(\frac{\unicode[STIX]{x2202}u}{\unicode[STIX]{x2202}z}\right)^{\!2}\!+\left(\frac{\unicode[STIX]{x2202}v}{\unicode[STIX]{x2202}z}\right)^{\!2}}\quad \!(vertical~shear~of~horizontal~flow), & \displaystyle\end{eqnarray}$$
 $$\begin{eqnarray}\displaystyle & \!\!\displaystyle \unicode[STIX]{x1D716}_{V,H}=\frac{1}{Re_{0}}\overline{\left(\frac{\unicode[STIX]{x2202}w}{\unicode[STIX]{x2202}x}\right)^{\!2}\!+\left(\frac{\unicode[STIX]{x2202}w}{\unicode[STIX]{x2202}y}\right)^{\!2}}\quad \!(horizontal~shear~of~vertical~flow), & \displaystyle\end{eqnarray}$$
and
 $$\begin{eqnarray}\unicode[STIX]{x1D716}_{V,V}=\frac{1}{Re_{0}}\overline{\left(\frac{\unicode[STIX]{x2202}w}{\unicode[STIX]{x2202}z}\right)^{\!2}}\quad \!(vertical~shear~of~vertical~flow),\end{eqnarray}$$
where
 $$\begin{eqnarray}\unicode[STIX]{x1D716}_{K}=\unicode[STIX]{x1D716}_{H,H}+\unicode[STIX]{x1D716}_{H,V}+\unicode[STIX]{x1D716}_{V,H}+\unicode[STIX]{x1D716}_{V,V}.\end{eqnarray}$$
The contribution from the vertical shear of the horizontal flow,
 $\unicode[STIX]{x1D716}_{H,V}$
, is expected to be dominant at late times of our simulation. Note that it is not equal to the kinetic-energy dissipation rate of the VSHF (vertically sheared horizontal flow) mode (Smith & Waleffe Reference Smith and Waleffe2002) because
 $\unicode[STIX]{x1D716}_{H,V}$
includes Fourier modes of
 $k_{H}=\sqrt{k_{x}^{2}+k_{y}^{2}}\neq 0$
. For an isotropic turbulence (Taylor Reference Taylor1935),
 $$\begin{eqnarray}\overline{\left(\frac{\unicode[STIX]{x2202}u}{\unicode[STIX]{x2202}x}\right)^{2}}=\overline{\left(\frac{\unicode[STIX]{x2202}v}{\unicode[STIX]{x2202}y}\right)^{2}}=\overline{\left(\frac{\unicode[STIX]{x2202}w}{\unicode[STIX]{x2202}z}\right)^{2}}=\frac{1}{15}\overline{\left(\frac{\unicode[STIX]{x2202}u_{i}}{\unicode[STIX]{x2202}x_{j}}\right)^{2}},\end{eqnarray}$$
and
 $$\begin{eqnarray}\overline{\left(\frac{\unicode[STIX]{x2202}u}{\unicode[STIX]{x2202}y}\right)^{2}}=\overline{\left(\frac{\unicode[STIX]{x2202}u}{\unicode[STIX]{x2202}z}\right)^{2}}=\overline{\left(\frac{\unicode[STIX]{x2202}v}{\unicode[STIX]{x2202}x}\right)^{2}}=\overline{\left(\frac{\unicode[STIX]{x2202}v}{\unicode[STIX]{x2202}z}\right)^{2}}=\overline{\left(\frac{\unicode[STIX]{x2202}w}{\unicode[STIX]{x2202}x}\right)^{2}}=\overline{\left(\frac{\unicode[STIX]{x2202}w}{\unicode[STIX]{x2202}y}\right)^{2}}=\frac{2}{15}\overline{\left(\frac{\unicode[STIX]{x2202}u_{i}}{\unicode[STIX]{x2202}x_{j}}\right)^{2}},\end{eqnarray}$$
lead to
 $$\begin{eqnarray}\frac{\unicode[STIX]{x1D716}_{H,H}}{\unicode[STIX]{x1D716}_{K}}=\frac{6}{15},\quad \frac{\unicode[STIX]{x1D716}_{H,V}}{\unicode[STIX]{x1D716}_{K}}=\frac{4}{15},\quad \frac{\unicode[STIX]{x1D716}_{V,H}}{\unicode[STIX]{x1D716}_{K}}=\frac{4}{15},\quad \frac{\unicode[STIX]{x1D716}_{V,V}}{\unicode[STIX]{x1D716}_{K}}=\frac{1}{15}.\end{eqnarray}$$
Temporal variation of these ratios in stratified flow at
 $Pr=70$
is presented in figure 18(a), illustrating the deviation from their isotropic values. After
 $t\sim 8$
,
 $\unicode[STIX]{x1D716}_{H,V}/\unicode[STIX]{x1D716}_{K}$
rapidly increases, and it eventually reaches
 ${\sim}0.6$
, while
 $\unicode[STIX]{x1D716}_{H,H}/\unicode[STIX]{x1D716}_{K}$
and
 $\unicode[STIX]{x1D716}_{V,H}/\unicode[STIX]{x1D716}_{K}$
become significantly smaller than their isotropic values. The salt-stratified experiments by Fincham et al. (Reference Fincham, Maxworthy and Spedding1996) and Praud et al. (Reference Praud, Fincham and Sommeria2005) reported a higher value of
 $\unicode[STIX]{x1D716}_{H,V}/\unicode[STIX]{x1D716}_{K}\sim 0.9$
. The smaller
 $\unicode[STIX]{x1D716}_{H,V}/\unicode[STIX]{x1D716}_{K}$
in our simulation would not be due to the low-Prandtl-number effect because
 $\unicode[STIX]{x1D716}_{H,V}/\unicode[STIX]{x1D716}_{K}$
generally decreases with increasing Prandtl number (figure 18
b). As the previous numerical simulations by Hebert & de Bruyn Kops (Reference Hebert and de Bruyn Kops2006) report the Reynolds-number dependence of
 $\unicode[STIX]{x1D716}_{H,V}/\unicode[STIX]{x1D716}_{K}$
, in which
 $\unicode[STIX]{x1D716}_{H,V}/\unicode[STIX]{x1D716}_{K}$
decreases with decreasing Reynolds number at low Reynolds numbers (see their figure 1), the difference in
 $\unicode[STIX]{x1D716}_{H,V}/\unicode[STIX]{x1D716}_{K}$
might be caused by the small Reynolds number of our simulation.
(a) Temporal variations of the ratios of
 $\unicode[STIX]{x1D716}_{H,H},~\unicode[STIX]{x1D716}_{H,V},~\unicode[STIX]{x1D716}_{V,H}$
and
 $\unicode[STIX]{x1D716}_{V,V}$
to the kinetic-energy dissipation rate
 $\unicode[STIX]{x1D716}_{K}$
for
 $Pr=70$
. The horizontal dotted lines indicate the values for isotropic turbulence:
 $1/15$
,
 $4/15$
and
 $6/15$
from below. (b) The
 $Pr$
dependence of
 $\unicode[STIX]{x1D716}_{H,V}/\unicode[STIX]{x1D716}_{K}$
.

We next apply an analysis similar to Batchelor (Reference Batchelor1959) to the late stage of decaying stratified turbulence, i.e. after a certain large time
 $t_{0}$
(typically
 $t_{0}>20$
; cf. figure 18) for which the vertically sheared horizontal flow is dominant down to the Kolmogorov scale. A brief review of the theory for a high-
 $Pr$
passive scalar by Batchelor (Reference Batchelor1959) is given in appendix B. We consider the deformation of a fluid element whose linear dimension is slightly smaller than the Kolmogorov scale, and whose translational velocity is
 $\boldsymbol{u}_{el}(t)=(u_{el},v_{el},w_{el})$
. New spatial coordinates
 $\boldsymbol{X}=(X,Y,Z)$
which translate with the fluid element are introduced, but, unlike in Batchelor (Reference Batchelor1959), they do not rotate, so that the
 $X,~Y$
and
 $Z$
axes are always parallel to the
 $x,~y$
and
 $z$
axes, respectively. Then, the new coordinate axes do not necessarily agree with the principal axes of the strain-rate tensor. Assuming that
 $\boldsymbol{X}=\boldsymbol{x}$
at
 $t=t_{0}$
, i.e. the fluid element is initially located at
 $\boldsymbol{x}=\mathbf{0}$
, the spatial coordinates
 $\boldsymbol{X}$
are defined by
 $$\begin{eqnarray}\boldsymbol{X}=\boldsymbol{x}-\int _{t_{0}}^{t}\boldsymbol{u}_{el}(\unicode[STIX]{x1D70F})\,\text{d}\unicode[STIX]{x1D70F}.\end{eqnarray}$$
A new temporal coordinate
 $T$
, which represents the elapsed time after
 $t=t_{0}$
, is also introduced, defined by
 $$\begin{eqnarray}T=t-t_{0}.\end{eqnarray}$$
If we assume that the velocity in the translational coordinates,
 $(U,V,W)$
, is dominated by vertically sheared horizontal flow, i.e.
 $(U,V,W)=(S_{X}Z,S_{Y}Z,0)$
, the transport equation of the density perturbation (2.2) becomes
 $$\begin{eqnarray}\frac{\unicode[STIX]{x2202}\unicode[STIX]{x1D70C}^{\prime }}{\unicode[STIX]{x2202}T}+S_{X}Z\frac{\unicode[STIX]{x2202}\unicode[STIX]{x1D70C}^{\prime }}{\unicode[STIX]{x2202}X}+S_{Y}Z\frac{\unicode[STIX]{x2202}\unicode[STIX]{x1D70C}^{\prime }}{\unicode[STIX]{x2202}Y}=\frac{1}{Re_{0}Pr}\left(\frac{\unicode[STIX]{x2202}^{2}\unicode[STIX]{x1D70C}^{\prime }}{\unicode[STIX]{x2202}X^{2}}+\frac{\unicode[STIX]{x2202}^{2}\unicode[STIX]{x1D70C}^{\prime }}{\unicode[STIX]{x2202}Y^{2}}+\frac{\unicode[STIX]{x2202}^{2}\unicode[STIX]{x1D70C}^{\prime }}{\unicode[STIX]{x2202}Z^{2}}\right)+w_{el}(t_{0}+T),\end{eqnarray}$$
in the frame of reference moving with the fluid element. The detailed derivation of (3.26) is presented in appendix C.
The assumption that the flow at scales smaller than the Kolmogorov scale is dominated by the vertical shear of the horizontal flow at late times is verified again by examining the kinetic-energy dissipation spectrum tensor, which is defined by
 $$\begin{eqnarray}\unicode[STIX]{x1D60B}_{ij}(k)=\mathop{\sum }_{\left|\sqrt{k_{x}^{2}+k_{y}^{2}+k_{z}^{2}}-k\right|<k_{min}/2}\frac{k_{j}^{2}}{Re_{0}}|\hat{u} _{i}(k_{x},k_{y},k_{z})|^{2}\,\frac{1}{k_{min}},\end{eqnarray}$$
(no summation is taken over the repeated indices
 $i$
and
 $j$
), and satisfies
 $$\begin{eqnarray}\frac{1}{Re_{0}}\overline{\left(\frac{\unicode[STIX]{x2202}u_{i}}{\unicode[STIX]{x2202}x_{j}}\right)^{2}}=\int _{0}^{\infty }\unicode[STIX]{x1D60B}_{ij}(k)\,\text{d}k.\end{eqnarray}$$
As shown in figure 19, the contributions from the vertical shear of the horizontal flow (
 $\unicode[STIX]{x1D60B}_{13}$
and
 $\unicode[STIX]{x1D60B}_{23}$
) are greater than the other components at all wavenumbers at
 $t=40$
for
 $Pr=70$
, but they are close to
 $\unicode[STIX]{x1D60B}_{31}$
,
 $\unicode[STIX]{x1D60B}_{32}$
and
 $\unicode[STIX]{x1D60B}_{33}$
at
 $k\sim k_{K}$
, indicating that the assumption of the vertically sheared horizontal flow holds moderately well.
Kinetic-energy dissipation spectrum tensor,
 $\unicode[STIX]{x1D60B}_{ij}$
, at
 $t=40$
for
 $Pr=70$
. The Kolmogorov, Ozmidov and Batchelor wavenumbers for
 $Pr=70$
are indicated by the arrows at the top of the panel.

The magnitude of the strain rate
 $S_{X}~(\simeq S_{Y})$
is estimated from figure 18 as follows:
 $$\begin{eqnarray}\frac{\unicode[STIX]{x1D716}_{H,V}}{\unicode[STIX]{x1D716}_{K}}=\frac{\overline{(\unicode[STIX]{x2202}u/\unicode[STIX]{x2202}z)^{2}}+\overline{(\unicode[STIX]{x2202}v/\unicode[STIX]{x2202}z)^{2}}}{Re_{0}\unicode[STIX]{x1D716}_{K}}\simeq \frac{2S_{X}^{2}}{Re_{0}\unicode[STIX]{x1D716}_{K}}\simeq 0.5\quad \text{at}~t\gtrsim 20,\end{eqnarray}$$
which gives
 $$\begin{eqnarray}|S_{X}|\simeq \frac{1}{2}\sqrt{Re_{0}\unicode[STIX]{x1D716}_{K}}\quad \text{or}\quad |S_{X}^{\ast }|\simeq \frac{1}{2}\sqrt{\frac{\unicode[STIX]{x1D716}_{K}^{\ast }}{\unicode[STIX]{x1D708}^{\ast }}}=\frac{1}{2t_{K}^{\ast }},\end{eqnarray}$$
where
 $t_{K}^{\ast }$
is the dimensional Kolmogorov time.
If we define the mean shear rate
 $S$
by
 $$\begin{eqnarray}S=\left(\frac{\overline{(\unicode[STIX]{x2202}u/\unicode[STIX]{x2202}z)^{2}}+\overline{(\unicode[STIX]{x2202}v/\unicode[STIX]{x2202}z)^{2}}}{2}\right)^{1/2},\end{eqnarray}$$
it would vary in the time scale of
 $$\begin{eqnarray}t_{S}=-\frac{S}{\text{d}S/\text{d}t}.\end{eqnarray}$$
The time scale
 $t_{S}$
for the case of
 $Pr=70$
is plotted with the Kolmogorov time in figure 20, showing that
 $t_{S}$
is one order of magnitude larger than
 $t_{K}$
. Thus, in the following analysis, we assume that the shear rate
 $(S_{X},S_{Y})$
is steady during the Kolmogorov time. We mention here, however, that a Lagrangian analysis (e.g. Girimaji & Pope Reference Girimaji and Pope1990) is necessary to validate the assumption of steady shearing, since we consider here that the coordinates translate with the fluid element. For isotropic turbulence, Kraichnan’s spectrum, which takes into account the unsteadiness of the strain rates, often fits the previous DNS results (Bogucki et al.
Reference Bogucki, Domaradzki and Yeung1997; Smyth Reference Smyth1999) better than Batchelor’s spectrum, which assumes steady straining.
The evolution of the time scale of change of the mean shear rate
 $t_{S}$
and the Kolmogorov time
 $t_{K}$
at
 $Pr=70$
.

We now seek a solution of (3.26) in the form of
 $$\begin{eqnarray}\unicode[STIX]{x1D70C}^{\prime }(\boldsymbol{X},T)=A(T)\sin (\boldsymbol{m}(T)\boldsymbol{\cdot }\boldsymbol{X})+\int _{0}^{T}w_{el}(t_{0}+\unicode[STIX]{x1D70F})\,\text{d}\unicode[STIX]{x1D70F},\end{eqnarray}$$
with an initial condition of
 $A(0)=A_{0}$
and
 $\boldsymbol{m}(0)=(m_{X0},m_{Y0},m_{Z0})$
. Substitution of (3.33) into (3.26) gives four ordinary differential equations:
 $$\begin{eqnarray}\frac{\text{d}m_{X}}{\text{d}T}=0,\quad \frac{\text{d}m_{Y}}{\text{d}T}=0,\quad \frac{\text{d}m_{Z}}{\text{d}T}=-(S_{X}m_{X}+S_{Y}m_{Y}),\end{eqnarray}$$
and
 $$\begin{eqnarray}\frac{\text{d}A}{\text{d}T}=-\frac{m_{X}^{2}+m_{Y}^{2}+m_{Z}^{2}}{Re_{0}Pr}A,\end{eqnarray}$$
which can be solved as
 $$\begin{eqnarray}m_{X}=m_{X0},\quad m_{Y}=m_{Y0},\quad m_{Z}=m_{Z0}-(S_{X}m_{X0}+S_{Y}m_{Y0})T,\end{eqnarray}$$
and
 $$\begin{eqnarray}\displaystyle A(T) & = & \displaystyle A_{0}\exp \left[-\frac{1}{Re_{0}Pr}\left\{\vphantom{\frac{1}{3}}(m_{X0}^{2}+m_{Y0}^{2}+m_{Z0}^{2})T\right.\right.\nonumber\\ \displaystyle & & \displaystyle \left.\!\left.-\,m_{Z0}(S_{X}m_{X0}+S_{Y}m_{Y0})T^{2}+\frac{1}{3}(S_{X}m_{X0}+S_{Y}m_{Y0})^{2}T^{3}\right\}\right].\end{eqnarray}$$
Invariance of the horizontal wavenumbers
 $m_{X}$
and
 $m_{Y}$
indicates that the vertically sheared horizontal flow does not alter the horizontal scale of density perturbation. The vertical wavenumber
 $m_{Z}$
increases linearly with time, and the increase during the Kolmogorov time
 $t_{K}$
can be estimated using (3.30) and (3.36) as
 $$\begin{eqnarray}|\unicode[STIX]{x0394}m_{Z}|=|m_{Z}(t_{K})-m_{Z0}|=|S_{X}m_{X0}+S_{Y}m_{Y0}|t_{K}\lesssim \frac{|m_{X0}|+|m_{Y0}|}{2}\simeq |m_{X0}|.\end{eqnarray}$$
This would not be large when the flow has a large horizontal scale. Then, the wavenumber vector
 $\boldsymbol{m}$
would become aligned with the vertical axis slowly if observed in the Kolmogorov time scale, and the density gradient finally directs upwards (cf. figure 17
c). The increase of the vertical wavenumber of fluid elements would explain why the vertical spectrum of potential energy
 $E_{P}(k_{V})$
below the Kolmogorov scale becomes larger than the horizontal spectrum
 $E_{P}(k_{H})$
at late times, as observed in figure 15.
We note that the second term on the right-hand side of (3.33) shows the variation of density perturbation due to the vertical movement of the fluid element. The density perturbation increases (or decreases) when the vertical velocity of the fluid element is positive (or negative), since the background density field is stably stratified. However, this term is a function of only
 $T$
(and
 $t_{0}$
) and is independent of
 $\boldsymbol{X}$
, and adds the same density perturbation to every point in the fluid. Therefore, it has no dynamical effects.
In the present numerical simulation, the small-scale vertical structure of the potential energy has been observed only at the highest Prandtl number (
 $Pr=70$
), but has not been observed at lower Prandtl numbers (
 $Pr=1$
and 7; cf. figures 10 and 11). The reason would be explained by (3.37), considering a fluid element with an initial disturbance of wavenumber
 $|\boldsymbol{m}(0)|=\unicode[STIX]{x1D6FC}k_{K}$
, where
 $\unicode[STIX]{x1D6FC}$
is a constant of order unity. The amplitude decay during the Kolmogorov time can be estimated from (3.37) as
 $$\begin{eqnarray}\frac{A(t_{K})}{A_{0}}\simeq \exp \left(-\frac{\unicode[STIX]{x1D6FC}^{2}k_{K}^{2}t_{K}}{Re_{0}Pr}\right)=\exp \left(-\frac{\unicode[STIX]{x1D6FC}^{2}}{Pr}\right).\end{eqnarray}$$
If the Prandtl number is not large (
 $Pr=O(\unicode[STIX]{x1D6FC}^{2})=O(1)$
), the density perturbation decreases to
 $1/\text{e}$
of its initial value during the Kolmogorov time. This means that the density perturbations would decay before the vertically small-scale density distribution is generated in a time typically much longer than
 $t_{K}$
. When the vertically small-scale components are generated in the density perturbation, corresponding small-scale components of velocity would be generated through the vertical density flux. However, the latter components would also decay in the Kolmogorov time, and will not affect the vertical scale of the velocity perturbation.
The present form of solution is very similar to the previous result by the RDT, which takes into account the initial condition (Hanazaki & Hunt Reference Hanazaki and Hunt2004). The main differences are that the present result is intended for a small-scale phenomenon near the Kolmogorov scale, and the Prandtl number is not limited to
 $Pr=1$
. Both results show, however, that the temporal variation of wavenumber vector
 $\boldsymbol{m}(T)$
and the amplitude of perturbation
 $A(T)$
are determined only by the shear (cf. Townsend Reference Townsend1976), and irrelevant to the stratification even when the scalar is buoyant. The present results indeed reduce to equations (2.6) and (4.4) of Hanazaki & Hunt (Reference Hanazaki and Hunt2004), under the condition of
 $Pr=1$
and
 $S_{Y}=0$
.
We finally mention that the nonlinear advection terms in the Navier–Stokes equations and the density equation vanish for the vertically sheared horizontal flow, and such a flow is governed exactly by the linear equations (Majda & Grote Reference Majda and Grote1997). Therefore, the flow dominated by the vertically sheared horizontal flow would be described well by the linear theory.
4 Conclusions
We have investigated the decaying turbulence in a density-stratified fluid of a high Prandtl number up to
 $Pr=70$
through a direct numerical simulation. The main results of this study are summarised as follows.
The kinetic and potential energies decay more slowly for higher Prandtl numbers, since the scalar fluctuations of a higher Prandtl number dissipate more slowly and more potential energy can be converted into vertical kinetic energy through the vertical density flux, which is more negative and more counter-gradient. The Prandtl-number effect is generally less significant for the velocity fluctuation (e.g.
 $KE$
and
 $\unicode[STIX]{x1D716}_{K}$
) than the density fluctuation (e.g.
 $PE$
and
 $\unicode[STIX]{x1D716}_{P}$
), since the effect of molecular diffusion becomes conspicuous at scales smaller than the Kolmogorov scale.
The difference due to the increase of the Prandtl number becomes less significant for larger
 $Pr$
(e.g. for
 $Pr\gtrsim 7$
), although there is no upper threshold value of
 $Pr$
at which further
 $Pr$
dependence completely disappears. Since the molecular-diffusion term in the governing equation is proportional to
 $1/Pr$
, the direct effect of molecular diffusion is already small at
 $Pr=7$
compared to that at
 $Pr=1$
, if the spatial structure of the density distribution is the same. Therefore, further increase of
 $Pr$
from 7 to 70, or to 700, will not significantly reduce the value of
 $1/Pr$
(i.e. from
 $1/7$
to
 $1/70$
, or to
 $1/700$
), and the effects of those
 $Pr$
increments would be small. The large-scale components are more insensitive to the increase of
 $Pr$
since the scalar diffusion is not significant at large scales, while the small-scale components, especially those smaller than the Kolmogorov scale, are more susceptible to the increase of
 $Pr$
which generates new small-scale structures.
The buoyancy effect is initially limited to large scales, but extends gradually to smaller scales, and the density fluctuations smaller than the Kolmogorov scale show very different structures before and after they are affected by the buoyancy. Before the buoyancy becomes effective down to the Kolmogorov scale (
 $k_{O}<k_{K}$
and
 $Re_{b}>1$
), the fluid motion is nearly isotropic at small scales, and the density behaves just like a passive scalar in isotropic turbulence. Indeed, the kinetic and potential energy have very similar horizontal and vertical spectra (i.e.
 $E_{K}(k_{H})\sim E_{K}(k_{V})$
and
 $E_{P}(k_{H})\sim E_{P}(k_{V})$
for the same
 $k_{H}$
and
 $k_{V}$
), and the potential energy shows a
 $k^{-1}$
spectrum in the viscous–convective subrange (
 $k_{K}\lesssim k_{H}\lesssim k_{B}$
and
 $k_{K}\lesssim k_{V}\lesssim k_{B}$
) at the highest
 $Pr~(=70)$
.
After the buoyancy becomes effective below the Kolmogorov scale (
 $k_{K}<k_{O}$
and
 $Re_{b}<1$
), the kinetic- and potential-energy distributions show pancake structures. The horizontal scales of these pancakes are comparable for all
 $Pr(=1,7,70)$
, but the vertical scale of potential-energy distribution is smaller for higher
 $Pr$
, and the pancakes at the highest
 $Pr~(=70)$
have horizontal wrinkles on their surface. Correspondingly, the vertical spectrum below the Kolmogorov scale is larger than the horizontal spectrum (i.e.
 $E_{P}(k_{V})>E_{P}(k_{H})$
for the same
 $k_{H}$
and
 $k_{V}~({>}k_{K})$
), and the potential energy no longer follows the
 $k^{-1}$
spectrum.
As long as the buoyancy Reynolds number
 $Re_{b}$
is larger than unity, the normalised kinetic-energy spectrum follows the Kolmogorov scaling and the normalised potential-energy spectrum follows the Batchelor scaling. However, after
 $Re_{b}$
falls below unity, the horizontal spectra no longer collapse onto a single curve below the Kolmogorov scale, while the curves of vertical spectra continue to collapse there.
The small-scale anisotropy of potential energy observed when
 $Re_{b}<1$
is generated by the vertically sheared horizontal flow at the Kolmogorov scale. Its dominance could be shown by p.d.f.s for the angles between the vertical axis and the principal axes of the strain-rate tensor, and by the contribution to the total kinetic-energy dissipation. Our theoretical analysis similar to Batchelor (Reference Batchelor1959) shows that the vertically sheared horizontal flow at the Kolmogorov scale reduces the vertical scale of density fluctuations, but does not change the horizontal scale.
We finally discuss how the Prandtl-number effect investigated in this paper will change for a different initial Reynolds number
 $Re_{0}$
or a different initial Froude number
 $Fr_{0}$
. If the Reynolds number increases, the difference between the energy-containing scale and the Kolmogorov scale becomes larger. Then, the large-scale quantities such as energy will become more insensitive to the Prandtl number, while the small-scale quantities such as the energy-dissipation rate are still normally affected by the Prandtl number. If the Froude number decreases, or if the Brunt–Väisälä frequency
 $N^{\ast }$
increases, the buoyancy Reynolds number
 $Re_{b}~(=\unicode[STIX]{x1D716}_{K}^{\ast }/(\unicode[STIX]{x1D708}^{\ast }N^{\ast 2}))$
will decrease since the kinetic-energy dissipation rate
 $\unicode[STIX]{x1D716}_{K}^{\ast }$
will not change significantly (Bartello & Tobias Reference Bartello and Tobias2013). The reduction of
 $Re_{b}$
means that the effect of stratification becomes more significant and the nonlinear effect becomes weaker, so that the molecular effect of the Prandtl number becomes more conspicuous.
Acknowledgements
This study was supported by JSPS KAKENHI grant no. 18K13685, and used computational resources provided by Tohoku University through the HPCI System Research Project (Project ID: hp170082, hp180092) and by the Earth Simulator Center of the Japan Agency of Marine-Earth Science and Technology.
Appendix A. Principal axes of the vertically sheared horizontal flow
We derive here the angles between the vertical axis and the principal axes of the strain-rate tensor of the vertically sheared horizontal flow, in which only
 $\unicode[STIX]{x2202}u/\unicode[STIX]{x2202}z$
and
 $\unicode[STIX]{x2202}v/\unicode[STIX]{x2202}z$
are non-zero and the other elements are zero. The principal values of the strain-rate tensor are
 $$\begin{eqnarray}\unicode[STIX]{x1D6FC}=\frac{1}{2}\sqrt{\left(\frac{\unicode[STIX]{x2202}u}{\unicode[STIX]{x2202}z}\right)^{2}+\left(\frac{\unicode[STIX]{x2202}v}{\unicode[STIX]{x2202}z}\right)^{2}},\quad \unicode[STIX]{x1D6FD}=0,\quad \unicode[STIX]{x1D6FE}=-\frac{1}{2}\sqrt{\left(\frac{\unicode[STIX]{x2202}u}{\unicode[STIX]{x2202}z}\right)^{2}+\left(\frac{\unicode[STIX]{x2202}v}{\unicode[STIX]{x2202}z}\right)^{2}},\end{eqnarray}$$
and the corresponding principal axes are
 $$\begin{eqnarray}\unicode[STIX]{x1D736}=\left(\begin{array}{@{}c@{}}(\unicode[STIX]{x2202}u/\unicode[STIX]{x2202}z)/(2\Vert \unicode[STIX]{x1D64E}\Vert )\\ (\unicode[STIX]{x2202}v/\unicode[STIX]{x2202}z)/(2\Vert \unicode[STIX]{x1D64E}\Vert )\\ 1/\sqrt{2}\end{array}\right),\quad \unicode[STIX]{x1D737}=\left(\begin{array}{@{}c@{}}(\unicode[STIX]{x2202}v/\unicode[STIX]{x2202}z)/\sqrt{(2\Vert \unicode[STIX]{x1D64E}\Vert )}\\ -(\unicode[STIX]{x2202}u/\unicode[STIX]{x2202}z)/\sqrt{(2\Vert \unicode[STIX]{x1D64E}\Vert )}\\ 0\end{array}\right),\quad \unicode[STIX]{x1D738}=\left(\begin{array}{@{}c@{}}-(\unicode[STIX]{x2202}u/\unicode[STIX]{x2202}z)/(2\Vert \unicode[STIX]{x1D64E}\Vert )\\ -(\unicode[STIX]{x2202}v/\unicode[STIX]{x2202}z)/(2\Vert \unicode[STIX]{x1D64E}\Vert )\\ 1/\sqrt{2}\end{array}\right),\end{eqnarray}$$
where
 $\Vert \unicode[STIX]{x1D64E}\Vert =\sqrt{\{(\unicode[STIX]{x2202}u/\unicode[STIX]{x2202}z)^{2}+(\unicode[STIX]{x2202}v/\unicode[STIX]{x2202}z)^{2}\}/2}$
is the Frobenius norm of the strain-rate tensor. Then, both
 $\unicode[STIX]{x1D703}_{z\unicode[STIX]{x1D6FC}}$
and
 $\unicode[STIX]{x1D703}_{z\unicode[STIX]{x1D6FE}}$
become
 $\unicode[STIX]{x03C0}/4$
, and
 $\unicode[STIX]{x1D703}_{z\unicode[STIX]{x1D6FD}}$
becomes
 $\unicode[STIX]{x03C0}/2$
since
 $\boldsymbol{e}_{z}\boldsymbol{\cdot }\unicode[STIX]{x1D736}=\boldsymbol{e}_{z}\boldsymbol{\cdot }\unicode[STIX]{x1D738}=1/\sqrt{2}$
and
 $\boldsymbol{e}_{z}\boldsymbol{\cdot }\unicode[STIX]{x1D737}=0$
.
Appendix B. Review of the theory for a high-
 $Pr$
passive scalar (Batchelor Reference Batchelor1959)

Here is a brief review of the theory by Batchelor (Reference Batchelor1959), which describes the sub-Kolmogorov behaviour of a high-
 $Pr$
passive scalar in isotropic turbulence. He considered a material element of fluid whose dimension is smaller than the Kolmogorov scale, and with an initially sinusoidal variation of the high-
 $Pr$
scalar. The length scale of change of the velocity gradient is assumed to be larger than the Kolmogorov scale, and the principal values of the strain-rate tensor are constant for time intervals at least as large as the Kolmogorov time. Then, the element is in effect distorted by a purely straining motion of a constant magnitude. Choosing the Cartesian coordinates,
 $(X,Y,Z)$
, which translate and rotate with the element and which correspond to the principal axes of the strain-rate tensor of the element, the convection–diffusion equation of the scalar
 $\unicode[STIX]{x1D703}$
in the non-dimensional form becomes
 $$\begin{eqnarray}\frac{\unicode[STIX]{x2202}\unicode[STIX]{x1D703}}{\unicode[STIX]{x2202}t}+\unicode[STIX]{x1D6FC}X\frac{\unicode[STIX]{x2202}\unicode[STIX]{x1D703}}{\unicode[STIX]{x2202}X}+\unicode[STIX]{x1D6FD}Y\frac{\unicode[STIX]{x2202}\unicode[STIX]{x1D703}}{\unicode[STIX]{x2202}Y}+\unicode[STIX]{x1D6FE}Z\frac{\unicode[STIX]{x2202}\unicode[STIX]{x1D703}}{\unicode[STIX]{x2202}Z}=\frac{1}{Re_{0}Pr}\left(\frac{\unicode[STIX]{x2202}^{2}\unicode[STIX]{x1D703}}{\unicode[STIX]{x2202}X^{2}}+\frac{\unicode[STIX]{x2202}^{2}\unicode[STIX]{x1D703}}{\unicode[STIX]{x2202}Y^{2}}+\frac{\unicode[STIX]{x2202}^{2}\unicode[STIX]{x1D703}}{\unicode[STIX]{x2202}Z^{2}}\right),\end{eqnarray}$$
where the largest principal value of the strain-rate tensor,
 $\unicode[STIX]{x1D6FC}$
, and the smallest principal value,
 $\unicode[STIX]{x1D6FE}$
, satisfy
 $\unicode[STIX]{x1D6FC}>0$
and
 $\unicode[STIX]{x1D6FE}<0$
, respectively, because of the incompressibility condition (
 $\unicode[STIX]{x1D6FC}+\unicode[STIX]{x1D6FD}+\unicode[STIX]{x1D6FE}=0$
). Equation (B 1) is satisfied by
 $\unicode[STIX]{x1D703}(\boldsymbol{X},t)=A(t)\sin (\boldsymbol{m}(t)\boldsymbol{\cdot }\boldsymbol{X})$
, with
 $$\begin{eqnarray}\frac{\text{d}m_{X}}{\text{d}t}=-\unicode[STIX]{x1D6FC}m_{X},\quad \frac{\text{d}m_{Y}}{\text{d}t}=-\unicode[STIX]{x1D6FD}m_{Y},\quad \frac{\text{d}m_{Z}}{\text{d}t}=-\unicode[STIX]{x1D6FE}m_{Z},\quad \text{and}\quad \frac{\text{d}A}{\text{d}t}=-\frac{m_{X}^{2}+m_{Y}^{2}+m_{Z}^{2}}{Re_{0}Pr}A,\end{eqnarray}$$
where the wavenumber vector
 $\boldsymbol{m}=(m_{X},m_{Y},m_{Z})$
. The solution with the initial condition
 $A(0)=A_{0}$
and
 $\boldsymbol{m}(0)=(m_{X0},m_{Y0},m_{Z0})$
is
 $$\begin{eqnarray}\boldsymbol{m}(t)=(m_{X0}\exp (-\unicode[STIX]{x1D6FC}t),m_{Y0}\exp (-\unicode[STIX]{x1D6FD}t),m_{Z0}\exp (-\unicode[STIX]{x1D6FE}t)),\end{eqnarray}$$
and
 $$\begin{eqnarray}A(t)=A_{0}\exp \left[\frac{1}{2Re_{0}Pr}\left(\frac{m_{X}^{2}-m_{X0}^{2}}{\unicode[STIX]{x1D6FC}}+\frac{m_{Y}^{2}-m_{Y0}^{2}}{\unicode[STIX]{x1D6FD}}+\frac{m_{Z}^{2}-m_{Z0}^{2}}{\unicode[STIX]{x1D6FE}}\right)\right].\end{eqnarray}$$
For a sufficiently large
 $t$
, the solution asymptotes to
 $$\begin{eqnarray}|\boldsymbol{m}|^{2}\rightarrow m_{Z0}^{2}\exp (-2\unicode[STIX]{x1D6FE}t)\quad \text{and}\quad A\rightarrow A_{0}\exp \left(\frac{|\boldsymbol{m}|^{2}}{2\unicode[STIX]{x1D6FE}Re_{0}Pr}\right).\end{eqnarray}$$
This shows that the small-scale fluctuations are generated in the most contractive direction (
 $Z$
direction), and the planes of constant
 $\unicode[STIX]{x1D703}$
are turned so that the direction of their normal,
 $\boldsymbol{m}$
, approaches asymptotically the direction of the greatest rate of contraction.
Appendix C. Transport equation of the density perturbation in the reference frame moving with the fluid element
We consider the transformation of the transport equation of the density perturbation in the stationary coordinates
 $(\boldsymbol{x},t)$
into that in the translational coordinates
 $(\boldsymbol{X},T)$
. These two coordinates are related by
 $$\begin{eqnarray}\boldsymbol{X}=\boldsymbol{x}-\int _{t_{0}}^{t}\boldsymbol{u}_{el}(\unicode[STIX]{x1D70F})\,\text{d}\unicode[STIX]{x1D70F},\quad \text{and}\quad T=t-t_{0},\end{eqnarray}$$
where
 $\boldsymbol{u}_{el}(t)=(u_{el},v_{el},w_{el})$
is the velocity of the fluid element relative to the stationary coordinates and
 $t_{0}$
is a time at which
 $Re_{b}\ll 1$
is satisfied. Let the density perturbation in the translational coordinates be
 $\unicode[STIX]{x1D71A}^{\prime }(\boldsymbol{X},T)~(=\unicode[STIX]{x1D70C}^{\prime }(\boldsymbol{x},t))$
. Then, the partial derivatives with respect to the variables in the stationary coordinates are rewritten by using the chain rule as
 $$\begin{eqnarray}\frac{\unicode[STIX]{x2202}\unicode[STIX]{x1D70C}^{\prime }}{\unicode[STIX]{x2202}t}=\frac{\unicode[STIX]{x2202}\unicode[STIX]{x1D71A}^{\prime }}{\unicode[STIX]{x2202}T}\frac{\unicode[STIX]{x2202}T}{\unicode[STIX]{x2202}t}+\frac{\unicode[STIX]{x2202}\unicode[STIX]{x1D71A}^{\prime }}{\unicode[STIX]{x2202}X}\frac{\unicode[STIX]{x2202}X}{\unicode[STIX]{x2202}t}+\frac{\unicode[STIX]{x2202}\unicode[STIX]{x1D71A}^{\prime }}{\unicode[STIX]{x2202}Y}\frac{\unicode[STIX]{x2202}Y}{\unicode[STIX]{x2202}t}+\frac{\unicode[STIX]{x2202}\unicode[STIX]{x1D71A}^{\prime }}{\unicode[STIX]{x2202}Z}\frac{\unicode[STIX]{x2202}Z}{\unicode[STIX]{x2202}t}=\frac{\unicode[STIX]{x2202}\unicode[STIX]{x1D71A}^{\prime }}{\unicode[STIX]{x2202}T}-u_{el}\frac{\unicode[STIX]{x2202}\unicode[STIX]{x1D71A}^{\prime }}{\unicode[STIX]{x2202}X}-v_{el}\frac{\unicode[STIX]{x2202}\unicode[STIX]{x1D71A}^{\prime }}{\unicode[STIX]{x2202}Y}-w_{el}\frac{\unicode[STIX]{x2202}\unicode[STIX]{x1D71A}^{\prime }}{\unicode[STIX]{x2202}Z},\end{eqnarray}$$
 $$\begin{eqnarray}\frac{\unicode[STIX]{x2202}\unicode[STIX]{x1D70C}^{\prime }}{\unicode[STIX]{x2202}x}=\frac{\unicode[STIX]{x2202}\unicode[STIX]{x1D71A}^{\prime }}{\unicode[STIX]{x2202}X},\quad \frac{\unicode[STIX]{x2202}\unicode[STIX]{x1D70C}^{\prime }}{\unicode[STIX]{x2202}y}=\frac{\unicode[STIX]{x2202}\unicode[STIX]{x1D71A}^{\prime }}{\unicode[STIX]{x2202}Y},\quad \text{and}\quad \frac{\unicode[STIX]{x2202}\unicode[STIX]{x1D70C}^{\prime }}{\unicode[STIX]{x2202}z}=\frac{\unicode[STIX]{x2202}\unicode[STIX]{x1D71A}^{\prime }}{\unicode[STIX]{x2202}Z}.\end{eqnarray}$$
Substituting the above relations into (2.2) leads to the transport equation of the density perturbation in the frame of reference moving with the fluid element,
 $$\begin{eqnarray}\frac{\unicode[STIX]{x2202}\unicode[STIX]{x1D71A}^{\prime }}{\unicode[STIX]{x2202}T}+U\frac{\unicode[STIX]{x2202}\unicode[STIX]{x1D71A}^{\prime }}{\unicode[STIX]{x2202}X}+V\frac{\unicode[STIX]{x2202}\unicode[STIX]{x1D71A}^{\prime }}{\unicode[STIX]{x2202}Y}+W\frac{\unicode[STIX]{x2202}\unicode[STIX]{x1D71A}^{\prime }}{\unicode[STIX]{x2202}Z}=\frac{1}{Re_{0}Pr}\left(\frac{\unicode[STIX]{x2202}^{2}\unicode[STIX]{x1D71A}^{\prime }}{\unicode[STIX]{x2202}X^{2}}+\frac{\unicode[STIX]{x2202}^{2}\unicode[STIX]{x1D71A}^{\prime }}{\unicode[STIX]{x2202}Y^{2}}+\frac{\unicode[STIX]{x2202}^{2}\unicode[STIX]{x1D71A}^{\prime }}{\unicode[STIX]{x2202}Z^{2}}\right)+W+w_{el}(t_{0}+T),\end{eqnarray}$$
where
 $\boldsymbol{U}=(U,V,W)$
is the velocity in the translational coordinates and satisfies
 $$\begin{eqnarray}\boldsymbol{U}=\frac{\text{d}\boldsymbol{X}}{\text{d}t}=\boldsymbol{u}-\boldsymbol{u}_{el}.\end{eqnarray}$$
Assuming the vertically sheared horizontal flow
 $(U,V,W)=(S_{X}Z,S_{Y}Z,0)$
, we finally obtain
 $$\begin{eqnarray}\frac{\unicode[STIX]{x2202}\unicode[STIX]{x1D71A}^{\prime }}{\unicode[STIX]{x2202}T}+S_{X}Z\frac{\unicode[STIX]{x2202}\unicode[STIX]{x1D71A}^{\prime }}{\unicode[STIX]{x2202}X}+S_{Y}Z\frac{\unicode[STIX]{x2202}\unicode[STIX]{x1D71A}^{\prime }}{\unicode[STIX]{x2202}Y}=\frac{1}{Re_{0}Pr}\left(\frac{\unicode[STIX]{x2202}^{2}\unicode[STIX]{x1D71A}^{\prime }}{\unicode[STIX]{x2202}X^{2}}+\frac{\unicode[STIX]{x2202}^{2}\unicode[STIX]{x1D71A}^{\prime }}{\unicode[STIX]{x2202}Y^{2}}+\frac{\unicode[STIX]{x2202}^{2}\unicode[STIX]{x1D71A}^{\prime }}{\unicode[STIX]{x2202}Z^{2}}\right)+w_{el}(t_{0}+T),\end{eqnarray}$$
which reduces to (3.26) by replacing
 $\unicode[STIX]{x1D71A}^{\prime }$
with
 $\unicode[STIX]{x1D70C}^{\prime }$
.



