


Explanatory note: This discussion paper is a record of the IFoA’s “Big Pitch” event held at Staple Inn, London on Wednesday 18 March 2026. This is an annual event where IFoA members present bold, forward-thinking ideas tackling the biggest challenges in health and care. Three separate papers were presented at the same event, and each paper was followed by a Q&A session. The papers are published separately in the British Actuarial Journal.
Moderator (Mr A. P. Cox, F.I.A., C.Act): We will be presenting three papers showcasing research in the health sector.
Nicky Draper will give an overview of the current health environment, followed by three research presentations with Q&A.
Nicky is an Honorary Fellow of the IFoA and a member of both the Health and Care Board and the Lifelong Learning Committee. Nicky (Draper) is currently Director of Life and Health Consulting at Crystallise, where she uses her previous career in the National Health Service (NHS) to advise insurers, reassurers and pension actuaries on product development, underwriting and risk modelling. Nicky (Draper) has chaired and contributed to several IFoA working parties, including those on diabetes and Covid 19. She is a frequent speaker at industry conferences and has authored Thought Leadership pieces on public health and actuarial implications, including pieces for the IFoA’s Think Series.
Miss N. Draper, Hon. F.I.A.: I will set the scene and connect some of these pitches to a broader development in health policy. This government has released a vast reformation package for the NHS, which cuts across many of the themes that we are going to be hearing about today. Interestingly, the plan makes some explicit references to actuarial skills and modelling. I am going to talk about where actuarial thinking appears in the plan, and why actuarial skills are becoming ever more important for health systems. Later, we will hear about how the research being presented may fit directly into that landscape.
I first started working in the NHS in 1988, and I left about twenty years later. During that time, there were several reform packages that were put together, but none appeared to be trying to leap forward into the future as much as this one does. So, where are we now? At least a quarter of the population are living with one long-term health condition and that group accounts for around two thirds of all NHS spending. This relates to the population of England, but generally this is a UK-wide issue; in fact it is probably more of a Western population issue. Demand for NHS services is not just increasing; it is concentrated and tends to persist over time. At the same time, expectations are changing. People increasingly expect care to be more digital, and to be more continuous, rather than something that happens at discrete points. The problem is that outcomes have not moved in that direction. Covid 19 had a profound impact on population health, not just in terms of its primary effects, but also the secondary effects on the health system.
Spending on health in the UK has come up to the Organisation for Economic Co-operation and Development (OECD) average, but outcomes have generally deteriorated. All this sits within very tight fiscal constraints. The NHS absorbs up to 38% of day-to-day government spending, and that is expected to get closer to 40% over the next few years. These are not short-term pressures or pressures that have occurred because of the pandemic. The pandemic certainly exacerbated and shone a spotlight on them, but they tell us about a system that is already operating under pressure.
The government looked at these pressures and framed where we go next. They have identified three directional shifts, first articulated in the Darzi Review, which have been carried forward as the central logic of the ten-year plan. The response is framed around three shifts of how the system will operate. The first is moving from a model where we treat sickness, to one where we seek to prevent it, and the second is trying to move as much care as possible out of hospitals into the community. The third is moving from analogue systems to something more digital, and that is probably one of the biggest challenges. These ideas are not new, but what is different here is that the government is expecting these three shifts to happen together and at scale.
Each one of these shifts, if we think about them in terms of population health, has slightly different implications. If we shift through to prevention, we are going to be changing the underlying risk profile of the population. That means we can delay onset of disease – we can slow progression and ideally reduce the overall burden of disease.
Moving care out of the hospital into the community is partly about earlier intervention and better management of long-term conditions, which are very prevalent. I mentioned a figure of a quarter of the population having at least one long-term condition, but we know that is going to increase. We know that the number of people diagnosed with multimorbidity is also increasing. Multimorbidity is having two or more conditions, and it comes hand in hand with our ageing demographic.
It is hoped that shifting to digital will open the possibility of identifying risk earlier and managing it more continuously, rather than reacting at points of crisis. Taken together, these three fairly simple concepts try to shift the NHS towards a system that is proactive, continuous and more centred on managing risk across the life course.
Why is the government aiming for these things? First, they want a continuous pathway for patients by 2035, which is a very short time horizon. The aim is to create a smoother flowing pathway, rather than having people move through discrete parts of the system.
That should translate into earlier detection of risk, more consistent management of long-term conditions and fewer points where people deteriorate and need intensive and acute care. We have a hope for a more dynamic system, not for isolated episodes of care.
To reach this point, the NHS will need to start understanding patient trajectories, and that is where actuarial thinking can help. The NHS wants to be able to look downstream, look at what they have learned and see what they can predict for the future. Within the NHS plan, the capabilities of actuaries are mentioned numerous times. The plan talks about the kinds of capabilities that actuaries can offer and the capabilities that are needed to support those three shifts. In particular it talks about the need for population risk modelling, to not only understand mortality, but also to understand how morbidity might play out into the future. There is also the concept of long-term financial sustainability, because the deficit in the NHS is significant and productivity has always been a challenge. Staff are expected to do more with less. Finally, there is an approach in terms of preventive health as an investment, and how more advanced data science and predictive analytics can be used.
This plan differs from previous reform packages. It is trying to understand how risk develops across a population over time, rather than just firefighting within a single term of a government. The 2035 aim will probably outlive this particular government, but they have set these broad, long-term plans in place. There are three areas where the value of actuarial approaches will show up most clearly.
The first pillar that actuaries could support the health package with would be around behaviour and prevention. A substantial portion of delivering a public health message will rest on how behaviour translates into long-term risk. As an example, the anti-smoking message was very much driven around personal health. However, research tells us that young people in particular have no concept of their own mortality and are not interested in trying to understand their future health.
You could frame the anti-smoking message around cost or even appearance, because smoking is known to age the skin. A huge body of research tells us that younger people have been more receptive to changing their behaviour if we approach from that angle. This is an example of where public health messaging needs to understand how people might respond to certain messages. In addition, modelling how different interventions play out over time, and thinking about how small changes in behaviour accumulate into material differences, there is certainly a role for actuaries.
The second pillar is around the sustainability of the health system. Once you start looking at pathways and trajectories, you will see how demand evolves over time. There are peaks throughout a person’s life where they may access healthcare. Classically these occur very early on, at birth and in infancy, in certain periods during your adult life, and much more towards the end of your life. If we can understand how to model that kind of approach in terms of workforce requirements, that could allow for a lot of future planning.
Finally, there is data. A huge amount of data is collected in the NHS, and the shift to digital should hopefully create a much richer data set. How do we use it? How do we access it? There are roles for more advanced techniques and data science modelling in the NHS. This could include machine learning, but how do we approach that in terms of cybersecurity and levels of transparency? There is an element of nervousness in the public about how their data is captured.
None of these are fundamentally new concepts within the NHS. It is just that this new reform package adds more of an opportunity for an actuarial view. You will see some of these themes coming through in the pitches.
The three pitches are approaching similar questions but from different angles. The first pitch is around the balance between prediction and explanation. As models become more complex, particularly with machine learning, there is a question about how much predictive accuracy you gain and what you might lose in other ways. The second pitch is about the balance between today and tomorrow. In the context of the NHS, that is essentially about how current decisions translate into long-term financial sustainability, particularly given demographic change and the accumulation of risk over time. The third pitch looks at the gap between rational assumptions and how people behave. A lot of models assume fairly stable, rational behaviour, whereas in practice outcomes are often driven by how people respond to incentives and interventions.
Although the topics of the pitches are quite different, they are dealing with similar themes and looking at different aspects of how we understand and manage risk over time. A lot of it comes back to taking a long-term view of risk and looking at risk across populations and understanding how that evolves over time. There is also a clear link to questions around financial sustainability, particularly where decisions made now have consequences that play out over quite long-time horizons.
Public health is often judged by what can be done, measured and delivered today. Yet many of its most important benefits may not be visible for 20 or 30 years. For practitioners, this creates a difficult tension: the value of prevention is long-term, while political, financial and organisational pressures are often short-term. Many of the obvious, quick wins in public health have already been achieved, so future gains will depend increasingly on sustained action, whose effects may only become apparent over decades.
More broadly, the pitches are about taking uncertainty, which we know is complex and difficult to observe, and turning it into something that can help inform decision-making. In that sense, the direction of travel in the NHS plan and the kinds of approaches actuaries are used to applying, are fairly well aligned.
Question: I understand one of the reforms was to get rid of NHS England and replace it with the Department of Health. Is there some kind of frictional risk here?
Miss Draper: The NHS itself will continue, but NHS England as an organisation will be abolished. The concept is to bring health and social care under one umbrella. They are so inextricably linked, particularly in older age, that thinking, direction and strategy need to come under one heading. Staff at both have been quite significantly cut. NHS England’s role will now come under the Department of Health and Social Care.
Question: Is there any initiative the government has undertaken to promote and emphasise the use of data science within NHS?
Miss Draper: Yes, there have been initiatives. For instance, I have been looking at genomics as a way of being able to predict risks. There is data science being used there. The main challenge is that everything is so disjointed, such that a GP office cannot connect to the hospital IT. That is from a data connection and IT perspective. At the moment there are no big initiatives in data science modelling, but there are certainly pilot studies and discussions about how they are going to incorporate a more complex approach.
Question: What is your view on how actuaries and the IFoA can make an impactful impression on NHS leaders, and make our voices heard?
Miss Draper: When I first began to work in this area, I was astonished that actuaries were not taking a greater role in issues like financial planning within the NHS. I think one of the challenges in the NHS is that, as staff become more senior clinically, they have to manage a big team and also finances, and a budget, perhaps. That is not why they started their journey through the NHS. There is a clear role to play for actuaries in terms of financial planning, future risk and understanding the population. I know there are actuaries that work in the NHS, but there are just not enough of them. As for the question of how actuaries can make an impression? If you were to take a simple challenge within the NHS, for instance, collecting data on older people or collecting data on people with higher needs and translate it into something tangible, that is certainly something that would impress the NHS.
Question: How do glucagon-like peptide-1 (GLP-1) drugs factor into the NHS and what role do actuaries have in this context?
Miss Draper: An actuarial input would be something as simple as modelling the impact of GLP-1s on future disease risk. At the moment, when a new pharmaceutical reaches the market, we have retrospective data in a clinical trial setting. With something like GLP-1, we have a huge amount of data on lived experiences and disease risk reduction. That is an example of where actuaries would be able to provide some colour.
Moderator: We now move on to the three research paper topics.
Ankit (Nanda) is a manager of Actuarial Advisory Services at a US-based health insurance carrier in India. He leads a team of analysts and consultants supporting US healthcare clients. He has thirteen years of experience across reinsurance, employer stop loss, managed care and consulting. He brings a distinctive cross-border perspective to actuarial practice. Ankit (Nanda) is a Fellow of the Society of Actuaries, a member of the American Academy of Actuaries and a member of the Conference of Consulting Actuaries. He serves on several professional committees, including the Society of Actuaries’ India Committee and the IFoA Mental Health Working Party. His research spans both US and Indian healthcare markets, with recent work focusing on emerging risks in healthcare insurance and value-based care models. He holds a Masters degree in Mathematical Finance from Boston University.
Mr A. Nanda: The crux of my presentation and my research is prevention. Prevention works. You can intuitively grasp that it makes sense in ageing societies. You have the demographic burden and people living longer. They are sicker. The natural question is, instead of having to deal with large claims, can we deal with them at an earlier stage, so that we can have an impact?
In my opinion, there is no disputing that this represents a causal pathway, from prevention to health outcomes over time and claims reduction. Where the gap exists today is that we do not have, as actuaries, a construct or framework for thinking about this in a structured fashion.
I spent about twelve years working in the USA, including consulting, where we would have wellness vendors say “We have this programme. We will get you a gym membership. We will do all these other things, and we can save you money.” It makes sense, but does it meet the bar for an actuary to use some of these items in pricing, reserving, or capital solvency?
I am going to propose a framework that helps to resolve some of those tensions and brings us one step closer to that discovery. The numbers for inpatient care are high everywhere. They are particularly high in the USA, but certainly also in the UK. The annual NHS spending on cardiovascular disease is more than £9bn. At one-year post-initiation, statin adherence is only around 50%. We have had generics for a very long time. In India we have had generics since 2011. You have drugs at a very low price, so why are people not taking care of their long-term health?
Figure 1 sets out the three core behavioural biases that we can exploit as actuaries. The first one is the present bias, where the present looms much larger than the future. As an example, I got to London on Friday and I have been trying to convince myself to go for a run since then. It is good for my health. Until Monday morning, I could not get myself out of bed to do that. At some point, I said to myself, you have a bookstore on every corner, if you go for a run, you can buy any number of books you want. That did the job for me. You can overcome present bias, to an extent, with incentives.
Core behavioural principles.

The second behavioural bias is loss aversion, where losing hurts much more than winning does, often by a ratio of two to one. Then, finally, the status quo bias. You find that people stick to their natural options. If you spend time in the employer space in a place like the USA, you find that people naturally gravitate to the plan they had the year before. People do not change unless they are prompted to.
Figure 2 shows the impact of some of these programmes. A reward is an obvious choice of intervention. With this method, I can reach a lot of people, as much as 90%, but you find that when you take away the incentive, the impact drops very materially. In this particular case, when you multiply the reach and the efficacy, you find that the population effect is fairly muted.
The reach-efficacy frontier.

Next is the deposit base intervention, where you have your own skin in the game, if you will. You have a smaller proportion of people who sign up, but the efficacy is very high. The reward base is excellent if you are looking for an overall population impact, but if you are looking at the return on investment (ROI), something like the deposit base is much more meaningful.
Looking at the Value-Based Insurance Design (VBID) copay reduction, consider a drug that is expensive, in a place like the USA, where you have co-insurance. Diabetes medications can be used as an example. You realise there is a very strong case to be made that it will materially affect your risk profile over time if patients do not take their medications. You have patients who say that there is a barrier to access, and the barrier usually involves cost. If you feel that it is in the best long-term interests of society, of the insurer, of your own patients’ health, you can take away that co-insurance to remove the barrier to access. This is 100% automatic reach, and the non-adherence goes down materially. People do not have an incentive or a reason not to take their medications.
Next is disease management. Again, not everybody signs up, but this is something we found to be very effective when people have chronic diseases. We found that some of these programmes are very effective with conditions that stay with you for a lifetime, but can be managed, like diabetes or asthma. Finally, vouchers for pregnancy. This was a UK study looking at smokers who were pregnant. It found that with the right set of incentives, there was a material impact in the risk reduction, and people signing up and getting to a stage where they were effective in changing their behaviours.
Figure 3 covers a large study that was done in the USA. It is considered the gold standard, and it was not exactly a Randomised Controlled Trial (RCT), but it was very close. The study matched populations through propensity matching. You have a control arm and an intervention arm, and you figure out the best way to match participants, and then compare how the programme delivers.
Disease versus lifestyle management.

What they found was that for disease management, where you have a chronic condition like chronic kidney disease or vascular disease, the ROI was nearly four to one. This does deliver meaningful outcomes. When I say ROI, I am not just talking about the health outcomes, I am talking about the eventual impact on your claims.
While the ROI was material for disease management programmes, it did not hold in the lifestyle management programmes. For example, if I have a body fat percentage of 10%, and I want to take medication, in the long-term it is probably going to do me some amount of good. It is just that the ROI does not hold for a person like me.
This is important when you start to consider the wellness ROIs. If a vendor has an excellent programme to get you on a gym membership, for example, you find that that does not apply equally to all segments of the population. As an actuary, I think one of the things that you are expected to do almost automatically is to say that you are not going to have a one-size-fits-all solution. Rather you should say is that you are going to try to understand the impact of the solution on different cohorts of the population and see how things differ or are the same.
The Behavioural Adjustment Factor (BAF) framework in Figure 4 is the framework that I am proposing. In essence, it separates out the different components that are expected to take you from engagement to behavioural change to claims impact, bringing you to a place where you start to see claim savings over time.
The BAF framework.

R is the reach. This is the percentage of the eligible population that decides to accept or engage with the programme. It can vary depending on whether it is a reward or a deposit base. Efficacy looks at whether that engagement results in behavioural change. For example, if I have a watch that tracks my steps, does it mean that I start walking more? If I enrol in a smoking programme, does that translate to an attempt to quit that habit?
C is translation, and this is where things get very tricky. The first two, you can measure with a certain degree of confidence. I have a population, and I am tracking their data. I can calculate the reach and I can find out, through my digital devices, whether people are, in this particular example, walking the steps they are expected to. But does that translate into claims reduction? In my experience, it is very difficult to draw a causal link between engagement in a programme, and a claim that was prevented. That is a very large jump.
Finally, durability. This is essentially saying that, even if you have a programme, with a certain structure that you have settled on, there is no guarantee that it is going to hold. Is it going to hold after 12 months, 24 months, 36 months? We don’t know. Some of these programmes wear off very quickly, especially if you have a monetary incentive in place. If you take that money away, people drop off.
The BAF framework has a multiplicative structure. Each component is independently modelled and assumed to be independent within reason. You are free to push back and say that not everything is independent. For example, the reward programme has a high reach, and you could have a corresponding low efficacy. Some of that can be modelled through correlation, but I believe that a multiplicative structure is more suitable here because it allows every component to have its place. If any one of them does not hold, if you have a durability of zero for example, the entire thing falls apart.
Figure 5 shows the three-year rule. It says that some of the claims impact, not just the behaviour changes but the claims reductions, will take time to materialise. If a person with diabetes joined a diabetic programme, you would not start to see claims reductions within six months. If you have a very short time horizon, then you are likely to see some false positives. This is something to be mindful of.
The 3-year rule and durability.

This is very interesting because, in the USA, they have health policies that are annually renewable. I could have the policy for one year and they can do their best to invest in my health, but I am free to walk out of that arrangement in the second year.
As an extreme example, consider something like cell and gene therapy, which is astronomically expensive. You invest in somebody’s health, and it is going to do some good for the system and the nation, but you find that somebody else is going to reap the rewards. The problem is less acute here, but it is something to be mindful of. If claims reductions happen, they will happen over a period of time. It is not instantaneous. If your time horizon is too short, you are probably going to see false negatives.
Figure 6 looks at confidence intervals. Taking disease management as an example, you have a point estimate, but you also have a distribution of outcomes, from 0.79 to 0.93. Essentially this is showing that there is a fair bit of confidence around the fact that this does work. The ROI will also depend on the cost, but this is a programme that you would be willing to invest in.
BAF confidence intervals.

Looking at smoking cessation, again, the confidence interval does not span 1. A BAF of less than 1 indicates claims reductions. The lifestyle wellness option shows a BAF confidence interval of 0.95–1.05, with a median of 1. Therefore, if your goal is to have a robust ROI on the programme, this does not meet that threshold. You could engage your population with that programme for other reasons, but if your goal is ROI maximisation and you want confidence that the programme will work at a population level, then this would not meet that threshold.
Figure 7 shows a worked example. This looks at a recent Better Blood Pressure study, that had a very high reach. They reached about 90% of the population through reward incentives and found that the adherence, which is engagement with the programme jumped up from 34% to 71%. This is a very material jump by any definition. However, they found that the reach and the efficacy were solid, but there wasn’t a material reduction in claims. This is parameter C of the BAF framework, which is shown as E × C in Figure 7. Some of the parameters move together, but here the claims reduction did not materialise.
Worked example: hypertension.

I do not think that the wellness vendors allow for this robustness in their approach. That is why, as consultants, you are trained to be sceptical of the numbers. This framework helps resolve some of that tension. You can say, “I see you are doing great on one or two of the parameters, but how are you doing on the ones that arguably matter? Is there a reduction in claims, and does this effect hold over time?”
I have assumed certain distributions for each of the four parameters, as shown in Figure 8. I believe that they are reasonably good starting points. A reasonably large amount of the data is US-based, so there is a question around whether these results would hold in the UK. I would say that we are biologically similar and our psyches are much more similar than they are dissimilar. We do have different systems in place – the UK has a more public hand of the government, if you will.
BAF components.

Not everything has to be transported to the UK model, just because it worked in the USA. You have to take the principles that matter and that are transferable and see where they can be applied in a UK context. It reminds me of Covid 19. There was a period where everything moved away from the median and mean. There is a cohort of actuaries who have said “let’s throw out that data, it is an anomaly, a once-in-a-generation event.” There is another cohort, which I believe is more considered, who said “it is an anomaly, but it is arguable if it is a once-in-a-generation anomaly.” The Hong Kong Sars outbreak was similar. My ask is that you take data that is not UK-specific with a grain of salt, but you do not say that we are different. You take what you can, calibrate it for the demographic and figure out how it fits in and can be used to meet the task at hand.
Moving on to the ethical framework. I am part of the IFoA Mental Health Working Party. I remember a colleague, who was the Chair at the time, who said that in the IFoA we lead with ethics. This stuck with me. When you design interventions, you have to be mindful that you are nudging people one way or the other. A good starting point is to be fully transparent.
From there, you have stratified BAF reporting. This is the practice of categorising your data into certain population sectors or cohorts. If you consider your entire population, you might find a disadvantage by income, for example. You measure this, and you find that the uptake, or adherence, or engagement, for that particular cohort is materially lower than your highest cohort.
Then you have a problem. You have very well-intentioned nudges, and you are trying to do the best thing for the system overall, but you can end up in a place where you are almost propagating the biases and systemic inequalities that exist. As actuaries, we are here to price risk, but we are much more than that. I think that, given the Financial Conduct Authority (FCA) duty that came out recently, actuaries have a public duty, written or unwritten, to speak to the higher goals, or higher ideas, if you will.
Figure 9 sets out a roadmap for a BAF pilot study. The feasibility phase would have a six-month duration, and cost between £40,000 and £60,000. Phases 2–4 are a single insurer pilot, a multi-insurer consortium and a long-term follow-up. What is the rationale? You have insurance companies paying for wellness programmes that do not necessarily translate to claims reductions. You could start with one insurer and apply the framework to all of their data. You could get a very fair and accurate picture of whether this is materially impacting the profile of the population, and if it is doing what it is intended to do. If it is, then you can expand the study to involve more insurers.
Pilot study roadmap.

Twenty years ago, Rx was a very big thing. I think that this is going to be the next big thing. The US Centers for Medicare & Medicaid Services (CMS) recently released the trend rates. For medical they were about 4–5%, year over year, and the Rx was about 10.7%. Over twenty years, we have come a very long way – from pharmacy being a modest share of total healthcare cost to a point where Rx is a big deal.
Mental health is another thing which has become a very big deal, I believe, over the last five years. It is on a trajectory where it is going to occupy a much more dominant space in our thinking. I believe this is the next frontier. You have the Rx, which is going to carry on, and you have mental health. But you also have the preventative piece, and people are going to start asking questions. Does it work, and if it does work, show us the math.
My framework is simple and reproducible. Within reason, it is ready for a pilot study. More importantly, it helps to bring a little bit more precision and accuracy to the discussion. It is something that you can use as a pricing actuary, a reserving actuary, a capital modelling actuary, and so on.
I have talked through a lot of the implications set out in Figure 10 already. For stop loss actuaries, the claims distribution materially differs when you look at very large claims. Social Return on Investment (SROI) is very condition specific. What if we have people with comorbid profiles? For example, someone with diabetes, who is obese and using GLP-1 drugs. This person may also have a chronic kidney disease – that is very plausible. In this instance, my framework is condition specific. You would have to map the condition specifically. Over time, it can be refined to accommodate the reality that people do not exist in silos, that things do carry over from one condition to another.
Implications for actuarial practice.

Finally, Figure 11 sets out the limitations. The US source data is a limitation. The durability parameters contain a lot of uncertainty, but this can be managed. The RCT samples may not be representative of the insured population. The multiplicative structure is also a simplifying assumption. I think it is the best of what we have. The selection bias is also a limitation. If you are healthy, you are more naturally willing and able to engage in a programme.
Limitations and future directions.

I have also considered future research. We want to use UK claims data to see if the framework holds up. We also want IFoA professional guidance development. As this carries along, you do want to have the IFoA in the driver’s seat, trying to figure out where the discussions are leading. Overall, the call to action is to adopt the framework, fund the pilot and then develop the guidance.
Moderator: We now move on to the second of the three research paper topics.
Paul Klumpes, now retired, was an Associate Professor of Accounting at Aalborg University. He holds a PhD in Accounting from the University of New South Wales. Paul (Klumpes) was previously Professor of Accounting at several universities, including Imperial College, London. He is a Fellow of CPA Australia and an Honorary Fellow of the IFoA. His research interests cover the interrelationship between corporate governance structures, generational public policy issues and risk management reporting practices on climate and cyber risk.
Dr P. J. M. Klumpes, Hon. F.I.A.: This is research I have been working on for 30 years. It has not been very successful, and there are a couple of reasons for that. Essentially, although I have been an Honorary Fellow of the IFoA for some years, I joined when there was a lot of talk about providing goodwill to shareholders for things like embedded value. It seemed to be quite popular for insurance companies to report embedded value or appraisal value, to create goodwill. In contrast, I am talking about “bad will.” I am applying the same concepts, but in connection with the bad will that comes from longevity issues, demographics, population decline, birthrate decline, and how these issues impact the demographic risks faced by NHS Trusts.
There is a general sense, in the literature and in the media, that the NHS is unsustainable. There is a lot of discussion around this, but without any numbers applied to it. One of the contributions to the paper looks at applying a standard, analytical model to come up with a set of numbers that can provide context to the discussion and allow us to understand the nature of the sustainability.
In November last year, NHS England did initiate a series of performance metrics. These have been highly publicised in the media, and they do have some problems. One is that they are very much driven by short-term operational aspects, such as the length of wait for an operation or time to treatment. These times are subject to manipulation and there have been documented cases of misappropriation of some of these figures. The other issue is that the numbers are reversing. Having a low score is good, and a very high score means that it is a “challenging” Trust. This goes against my metrics, to have the lower score as the best.
The second contribution to the paper is introducing a concept of intergenerational equity. In this social context, we are not talking about profits and losses or efficiency in a normal sense. We are talking about an institutional setup with risk sharing within, and across, generations, because it is publicly funded.
Finally, the other contribution I am making is to derive a SROI metric. Basically, this asks, how can we undertake a cost–benefit analysis of the SROI? How can we know if the investment undertaken by society, and the expenditure of the government, is going to generate a return on that investment in the form of an improved outcome?
When I was preparing this research proposal, I had engagement with one of the local NHS Trusts in England, the Leicestershire NHS Mental Health Trust. We worked together on this, and I got quite a few insights, from the NHS management perspective, as to what some of the constraints are. Coincidentally, my eldest niece is a senior manager in the St. George Acute Hospital in Sydney. She has also been looking at these constraints and has shared some of her insights.
Figure 12 sets out the strategic context. There is the obvious question around the future demand and the propensity of people to want to use the service, and the other presentation pitches talk about how that can be efficiently managed. The imperatives of resource constraints also need to be considered.
Strategic context.

There is also the organisational culture aspect. Within my context of accounting, I dealt with an accounting body, the Chartered Institute of Public Finance & Accountancy (CIPFA), which has a lot of engagement in the public sector. CIPFA was against a lot of the ideas that I had. They were not interested at all, and I think there is a bit of a barrier there. Actuaries have a certain kind of professional influence that means that people want to listen to you.
The other aspect is the evolving resource demands. There is a question around how urgent it is to worry about resource constraints. The study I am looking at focuses on the high resource requirement areas, on the demand for acute hospital services and inpatient services. These are beyond the prevention, self-management, lifestyle recovery and primary care areas. The inpatient areas are where you are talking about fragile people becoming elderly. A lot of these sicknesses, and people being bedridden in hospitals, are coming from the fact that people are ageing and there is a lack of social care for them.
Another contribution of the paper is to examine the concept of intergenerational equity. What is intergenerational equity? It is the degree of fairness or justice in well-being across different generations in society. This was brought out in the introduction, and it resonates with the topic, but it has a much broader context. It asks whether the population, in geopolitical terms, cares about these issues. Going beyond a social intragenerational equity issue, intergenerational equity is very much about the future and has a longer-term impact, whether it is climate change or the financial sustainability related to demographics.
You can have an equitable or an inequitable situation. This study is very much the tip of the iceberg. It is asking what the issues are, rather than delving into whether the situation is fair or unfair. Many different aspects of intergenerational equity are potential areas for this research. These include environmental, psychological, behavioural science and social and economic investment aspects, as well as the sustainability of public finances aspects that we are focusing on here.
Coming back to the stakeholders, the Leicestershire Mental Healthcare Trust for example, they saw this as relevant for decision-making more broadly within the NHS. This covered the management of policies, planning within the hospital and the development of a long-term plan. This also relates to issues with resource allocation and capital rationing. I know that in the Australian healthcare system, they do what is called activity-based costing. They know the cost of undertaking a specific operation and then allocate or can spread that across the age generation cohort of the patient involved.
There are also issues around financial reporting and accountability. A lot of the NHS Trusts in England are set up as charitable trusts, and the charitable trust accounting is delimited to standard stewardship reports. There isn’t a requirement for them to produce forward-looking information within the legal context of their entity setup. Part of this pitch is about questioning what form of legal entity is appropriate, and how this could move this area forward.
Moving on to the financial model, this is a standard model that has been applied in the context of US fiscal policies. These fiscal policies relate to things like taxation, old age, social disability and the US public healthcare system. A group of macroeconomists, led by Laurence Kotlikoff, have produced a series of papers where they set out a concept called Generational Accounting. This talks about the concept of intertemporal budget constraints. In other words, a service that can be provided through the public health funding system, in this case the NHS National Insurance contribution, is either paid for or used by current generations. If not, it has to be funded by future generations. This is a very different form of accountability than the form you might have seen in your typical insurance, pensions and financial services contexts.
The model I have used is trying to look at a longer-term horizon, because we have to see the evolution of these demographic effects. The modelling is done both by region of England and by gender and age. For the baseline assumptions, I have used the current year operating cash flow statement and the net assets available. We have five different cohorts. The existing cohorts go from Gen Z and Gen Y to the Baby-Boomers and the elderly. The remaining cohort is the future generation. We project the cash flows, making an assumption about the cost of capital. The standard assumption in these models, in a US fiscal policy context, is to use the risk-free rate. The equivalent would be the social discount rate produced by the Treasury. In this case, because of the uncertainty of the entity, I am going to use a risk-adjusted rate. Risk-adjusted cost-of-capital rates tend to be used in other European countries, not in the UK.
Figure 13 shows the Generational Accounts equation. On the left-hand side, we have the claimants. The claimants will be existing generations and/or future generations. On the right-hand side is the government-funded service, and the projection of the future cash flows related to that service. In this case, this is the NHS Trusts.
Generational accounts.

We take the expected future operating expenditure of the Trust and compare this to the revenue provided to the Trust and the current assets of the entity. These are meant to be the utilisation of the claimants on the left-hand side. You can also look at individual generational counts within the generation, in terms of the actual net contribution or net payment that each of those cohorts provides. This proposal addresses both the overall generational cohorts and provides some insight into the generational counts of the different cohorts.
The idea is to project all NHS Trusts in England, and perhaps across the other UK nation states. In this case, I used two NHS Trusts: Manchester and Newcastle. Both Trusts are in the middle of the range of the NHS England performance metric score, and they are both University Hospital Trusts. They both have extensive research and development and are acute hospitals that provide services to the overall region in which they are based.
Both Trusts also have net deficits, which means that they are failing. The NHS England metric score discriminates against Trusts with deficits, giving them higher scores. These Trusts are facing a future which is effectively unsustainable, year by year. They are also in regions of England that have demand for age-related care and areas of social deprivation. They also have innovative management practices and have reported receiving awards for their innovations in increasing efficiency or reducing operational stress.
The study also aims to recognise that there are social differences across the different regions within England. In Figure 14, the central line shows you the overall picture within England. Interestingly, the Northeast has a higher old age dependency ratio, and the Northwest ratio is lower than the national average. It is important to recognise, and I think actuarial skills come in here, that there are regional variations that mean you cannot have a one-size-fits-all solution to this issue.
Projected old age dependency ratios.

The other aspect of the study looks at the different types of generational accounts. One of the imbalances coming through is the extent to which the elderly cohorts, on the left-hand side of the equation, are drawing services. These cohorts are negative accounts, and they are getting a lot of benefits from the services. The Gen X, Gen Y and Gen Z cohorts tend to be paying net contributions in. This means that the younger generations are subsidising the elderly populations. This has political ramifications. The political discussion in the Northeast, for example, would be different to the policy discussion in Manchester, because there is a younger population in Manchester.
Figure 15 provides an example of these generational accounts. It is important to remember that there are a lot of assumptions underneath these models. You can see that both Manchester and Newcastle have negative accounts.
Generational imbalance by existing generational cohort.

Normally, in generational accounting, you would see a positive balance and a negative balance. The existing generations see the benefits of a policy, which then has to be paid for by future generations. In this case, both are negative. The only question is, what is the relative size of the negativity? In this case, 42% and 46% are expended by current generations, and the future generations are paying even more. It highlights how unsustainable the NHS Trusts are, unless something is done about addressing some of these problems.
In terms of the relevance to actuaries, I feel there are a number of points being brought out here. One point is around using the expertise of an actuary in developing a plan, setting the assumptions and considering whether they’re drawing on the various data sources and resources. This is very important for the integrity of the plan.
It seems to me, as an accountant, that actuaries spend a lot of time looking at the financial sustainability of private-sector providers. A lot of these skills can also be applied to public sector, long-term scenario modelling. There is also a broader contribution. Are actuaries prepared to go into the public sector and take on the various risks and the myopic management and offer insights that are currently outside of the skill set of the largely non-actuarial public sector?
In terms of recommendations, my pitch is slightly broader than the previous presenter. First, there is a need for accounting and accountability to be broader than just a standard balance sheet, to also say: “What is the future sustainability of these entities?”
Generational accounts have been implemented in Australia and to a lesser extent in New Zealand. I think that in the UK there is a need for this. There is the SROI concept, which is simply comparing costs and benefits. In this case, there are a lot of costs, but those costs have been distributed differently across different generations, so that needs to inform the debate. There is also the question around the concept of generational public policy, whether it is healthcare or public pensions. Any area that involves demographic pressures on government finances is an area where actuaries have the relevant skills to do the modelling.
In terms of the specifics, as an Honorary Fellow, I did try to persuade actuaries to support the Taskforce on Inequality and Social-related Financial Disclosures (TISFD). They are building on the work of the Task Force on Climate-Related Financial Disclosures (TCFD) and the Taskforce on Nature-related Financial Disclosures (TNFD) to integrate these social measures. Unfortunately, the Sustainability Board did not agree.
Thinking about a generational equity index, I think Australian actuaries have produced a generational equity index for social discussion in Australia. One of the biggest sources of inequality is the cost of housing. The cost of housing in Australia is very high, and it is excluding many parts of the population from being able to afford to live in the big cities.
Finally, this paper introduces a new long-term performance metric, SROI, which addresses the concept of societal well-being. Thinking about the social value-add of the IFoA to society in the UK, I do believe that the concept of SROI and actuaries moving into these spaces is a way that the actuaries can demonstrate their value-add to society.
Moderator: Thanks, Paul, for your presentation on what is a highly topical subject, vexing many in the health industry. We are moving on to our third and final research presentation from a whole team of presenters. We have three people pitching in to present this one. We have Jacky Tam, who is Deputy Chair of the Techniques in Data Science in Health and Care Working Party. He is experienced in banking, valuation, risk and control, pricing and peril modelling and personal lines insurance. Jacky (Tam) has an M.Sc. in Computational Statistics and Machine Learning from UCL. He is a Data Science Lead covering both underwriting and claims. We also have Fiona Fan, who is a Research Actuary at Gen Re. Fiona’s career is focused on protection business across reinsurance, consulting and life insurance. She took a keen interest in the IFoA’s Data Science in Health Working Party, exploring how data science can be applied within healthcare actuarial practice.
We also have Michiel (Luteijn), who is Chair of the Techniques in Data Science in Health and Care Working Party. He holds a Ph.D. in Epidemiology and works as the Data Science Lead at Hannover Re. He has fifteen years’ experience spanning academia and reinsurance and has authored many peer-reviewed publications. He is participating in, and has previously participated in, the IFoA and World Health Organisation working parties.
Dr M. Luteijn: Welcome to the final presentation where Fiona (Fan), Jacky (Tam) and I will present on “Breaking Down the Black Box: Why Actuaries Should Embrace Machine Learning Now.” First, I am going to talk a little bit about making traditional models great again, and what Machine Learning (ML) can bring to the table. Then my co-presenters, Jacky and Fiona, will talk about our case study, example and workflow on a large data set.
By means of introduction and setting the scene, I read a paper describing two cultures in data modelling by Professor Leo Breiman. For those who know, Leo Breiman is credited with inventing the Random Forest, which is one of the earlier black box models. In a paper, now 25 years old, Breiman wrote about two cultures in data analytics. The first is the data modelling culture, which involves generalised linear models (GLMs), Cox survival models and the like. This is the more traditional approach. With this approach, we have an input such as age, sex, smoking, sum-assured, etc. Then we have the effects of nature that we try to represent in this model, for example in a GLM. Then there is an output, for example insurance claims, generated by a stochastic process.
By way of contrast, Breiman identifies the algorithmic modelling culture. This is basically the black box models. The philosophy here is that the data mechanism is unknown. Nature is infinitely complex. We cannot hope to represent this in some basic model. So why don’t we directly target the claims and just focus on predictive accuracy? To no one’s surprise, those models have much higher predictive performance. But it comes at a price. These models are often less interpretable. Interpretation is obviously a key point to our presentation. It is about the trade-off between transparency and predictive power. What we will try to argue is that we can have our cake and eat it.
We are asking the question: “Can we use tree-based models?” We will talk more about why we focus on tree-based models to improve our traditional models, particularly GLMs. Areas where this can really add value are: detection of variable interactions (Fiona (Fan) will talk more about that later); modelling of non-linear patterns (Fiona (Fan) will also talk about that); model evaluation; and whether we can ensure that our GLMs generalise well to unseen data.
We argue that yes, we can have our cake and eat it. The reason for our optimism is that currently a lot is happening in the field of GLM hybrid models (Figure 16). I will first come back to why we focus on tree-based models.
GLM hybrid models.

There is a paper by Grinsztajn, where he very clearly explains why tree-based models, in particular gradient boosting, outperform even neural networks on tabular data. Of course, in experience analysis and insurance, the data we tend to work with is tabular data. That is the focus of tree-based models. I mentioned that a lot is happening. There are various strands of research on enhancing traditional models by tree-based models. I have incorporated three here.
One strand of research focuses on using those black box models just for generating features to help our traditional models. Another strand is to use them as either a diagnostic or an exploratory tool for designing or evaluating traditional models. Jacky (Tam), my co-presenter, will talk more about that.
The third strand is to capture signal not captured by a baseline model. As you can see, particularly in the case of the last two, these are very recently published papers. This is quite a novel field. Our mission is that we want you to make traditional models great again, because now is the time.
Before we can move to the analytics of our case study, I should first introduce the data set that we worked with. The elephant in the room, I guess, is that this is a life insurance data set, and we are here at the Health and Care Symposium.
In Figure 17, I am trying to make the case that a health or life claims data set can represent a whole range of actuarial problems, including health and care, morbidity, income protection and even to some extent lapse and fraud detection.
Mortality outcomes as a testbed for a set of wider actuarial tasks.

Both for mortality and morbidity analysis, we try to target claim counts. We offset by life years of exposure. There are rare events. There are non-linearities and heavy interactions that my co-presenters will talk more about. Indeed, we use the same predictors in many cases, such as age, sex, smoking, etc. Some sort between life (insurance) data sets and health and care data sets.
The data set itself is maintained by the Individual Life Experience Committee, which is a committee of the American Society for Actuaries. It is a credible data source. It is also publicly available. All the work that we have performed has the code publicly available for it. Anyone could reproduce this. It is an extremely large data set. We cut out quite a lot in our data selection, but we still have more than a quarter of a million life claims in our analysis. Having introduced the data set and set the scene, I now hand over to Jacky (Tam), my co-presenter.
Mr C. K. J. Tam: I am going to start with the modelling workflow. Here we have tested three approaches that combine machine learning with a traditional model. Together, they can be viewed in terms of a spectrum of automation (Figure 18).
The hybrid modelling spectrum.

At one end of the spectrum, we have full automation. Essentially, we built a GLM with XGBoost on top, which captures whatever GLM misses. GLM can be viewed as a kind of traditional actuarial model, whereas XGBoost, as Michiel (Luteijn) mentioned, is a tree-based model, which is very good at capturing interdependency between the features.
In the middle, we have the GLM with interactions detected by XGBoost. This is semi-automated, in the sense that modellers can still decide which interaction terms to incorporate in the final model. The last one is the XGBoost-informed GLM. This is the least automated in the sense that GLM is still handcrafted in a traditional way, but it is completely guided by XGBoost in conjunction with domain knowledge.
Let’s look at the automated hybrid workflow (Figure 19).
Automated hybrid workflow.

First, we build a baseline GLM and then we train XGBoost to predict residuals of the baseline model. A residual is effectively the difference between the target variable (in our case mortality) and the GLM prediction. The output of these two steps is essentially the automated model.
As I said, this is GLM with an XGBoost booster, so it captures a lot of the non-linearities and the interaction effects. If we persevere and we go to the third step, we rank the interaction terms by their importance, based on XGBoost, and we apply our own actuarial judgement to select which interaction terms could be incorporated in our final hybrid models. That is the semi-automated approach.
Figure 20 shows the manual workflow.
Manual hybrid workflow.

Here, we use XGBoost to review any hidden pattern of, say, a variable. One of the nice things about XGBoost is that it is essentially a tree-based model. We can use tree depth to control the order of interaction, and we can switch it off completely, as well. For instance, for a tree depth of 1, a tree only splits once, which means that it only uses one variable. That means we only capture the individual effects. We use SHapley Additive exPlanations (SHAP) to try to understand the relationship between model predictions and a factor in our model.
SHAP comes from game theory. It is trying to understand the individual contribution of a feature to a specific prediction. What we can see here is that the attained age effect is highly non-linear, and this is something that pricing actuaries would need to think about – how to incorporate it better within the GLM setting. If we train a depth 2 XGBoost, which means that now we are capturing the pairwise interaction effect, what we can see is now, within the same level of attained age, you can see risk variation within it, even for the same age.
We can also see that this risk variation can largely be explained by whether the policyholder is a smoker or not. What we can see is that the gradient is deeper for policyholders who are smokers. My interpretation is that smokers probably age faster. That is the reason why the age effect is even more prominent for smokers.
Let’s look at the key findings now (Figure 21).
Complete transparency – interaction importance.

One of the good things about the hybrid model is that it is completely transparent, in the sense that we can scrutinise the model in the same way as if it was a traditional actuarial model. For instance, we can see there are 11 interaction terms detected by XGBoost. In the old days, as any pricing actuary can tell you, one of the most challenging tasks was to identify every interaction effect within an actuarial model, and that’s for the simple reason that the number of interactions increases exponentially with the number of factors in the model.
With our hybrid approach this is no longer the case. We can rank the interactions by importance, and we can objectively incorporate the most important interaction terms within our hybrid model (Figure 22).
Complete transparency – partial dependency.

Another thing that we can look at is partial dependence. Essentially, partial dependence is a way to understand how model predictions change as feature values change. Here we can see the partial dependence by duration and face amount, that is, the sum assured. We can see very clearly that for sum assureds below 100,000, the risk increases more slowly as the duration increases. That is probably because of the low sum assured.
That is why there is not a lot of underwriting done when the policy is underwritten. As you can see, the slope here is a lot more mitigated compared to other policies with higher sum-assured.
How do we choose our position on this hybrid spectrum? We have five factors here to help you choose the right point on this hybrid spectrum (Figure 23).
The hybrid spectrum.

The first one is life exposure. Essentially, it is a measure of the data. The more data you have, the more you should go for the automated approach, as automated models are very data hungry. But it is also very good at understanding the hidden patterns in big data. Second is stationarity. What this means is the stability of the underlying risk distribution, but in practice it also means the stability of the customer segment within your portfolio. For stable distributions, this is the ideal scenario for ML and also for the automated solution.
On the other hand, if the risk distribution is not stable, we will probably need pricing actuaries to understand what is going on and to fit the curve accordingly. Claim frequency is another one. The higher the claim frequency, the more signals that an automated solution can be learned from the data, and that’s why we should go for the more automated solution. Data richness is not just about data quality, but also about the number of attributes we have in our data set. Richer data means that the automated solution is more preferable. The reason is that it can scale up in line with the big data set we have.
Regulatory scrutiny works the other way around. In a sense, with higher regulatory scrutiny, we need to go for a more manual approach. The reason is that you need to justify to regulators how premium changes and why. So, if pricing actuaries fit the curve manually with that domain knowledge, it’s a lot more explainable. In short, we have five factors to help you choose the right method within a hybrid spectrum. I’ll now hand over to Fiona to talk about the rest of the presentation, thank you.
Miss F. Fan, F.I.A.: We have demonstrated how we can use hybrid modelling to help to better build our GLM. I want to emphasise that hybrid modelling is not about replacing the GLM. It is about answering the questions that GLMs were not built to answer. Before my talk, I did a bit of research and I learned that GLMs were invented in 1972. Other techniques that we use nowadays, like blinds, were invented in the 1950s and were being used in modelling in the 1970s. We are using techniques from about 50 years ago to try to deal with the data that we have now, which is far more complex and far richer (Figure 24).
Data in current healthcare.

Our example is a life insurance data set. It can be quite simple: we use age and very standard underwriting criteria and variables. But in real life, the healthcare data set is far richer and far more complex, and we do not have the experience of how to use them.
An example I can think of was last month. I went back to China with my family. My father is diabetic. He was showing me this little thing that he has on his arm that can read his blood glucose level on the spot. Every fifteen minutes, it refreshes. Depending on the reading, he is then able to use another button on his app to inject insulin into his body so that it remains at a very healthy level.
Hence it struck me that, nowadays, we are collecting data at very high frequency. For my father’s example, this is data being produced around the clock, and that is only for one patient. And as for wearables, a lot of us now are using smart watches, not only counting steps, but also heart rates, and they can detect sudden force. They can check our movements. They can estimate the calories when you are doing exercise. All of these are incredibly granular behavioural data that we did not have access to a decade ago.
On the insurance side, people are buying insurance products on aggregator sites like CompareTheMarket and Confused.com. Our financial advisors are using aggregator sites. These platforms can generate data like click-through rates. Where do people drop off the journey? At what question do they drop off? How long do people spend on there, and what is their last answer? These platforms are not only collecting data with regards to who the client is, and what a customer is like, but also how people are making decisions.
People may recognise the health data set. It is the hospital data set from the NHS. It has hospital activities like diagnosis, procedures, admissions, number of inpatients in different areas and electronic health records for GPs. These are all the new types of data sets that we are dealing with nowadays. They are very high-frequency and very high-dimensional. They can be messy and unstructured. They are not like the data sets that actuaries deal with, and we do not have a lot of relevant experience.
They come from different sources. As I said, they come from phone devices, apps, hospitals and digital platforms. These are the new data sets and challenges we are facing nowadays. If our example just now feels quite straightforward, let it be said that real-life data sets are much more complex (Figure 25).
Data in the current healthcare world.

I also want to talk about the fact that, in our data set, our factors are non-linear. They typically interact with each other. Healthcare actuaries should know that sum assured and age can be a very common interaction. If you have a 20-year-old buying a million-pound policy, you are expecting it to be for a different reason than a 70-year-old buying a million-pound policy.
However, it could also be interactive with the socioeconomic factor. People coming from a much higher socioeconomic background might have a different story to tell compared to people who are from more deprived socioeconomic backgrounds. We also see, for example, that insurers are changing their underwriting criteria – for example moving certain occupations from one class to another. When we are exploring the claims experience, we may see experience vary by underwriting year, due to this change of criteria. This change could also be specific to a certain distribution channel.
We also talk about the pandemic. Like Paul (Klumpes) was saying, there are different demographics under different geographic areas. When we are taking into consideration demographics, geography, different illnesses that come into interaction with Covid and comorbidities; that represents a lot of factors that interact with each other. We can also think about factors that are non-linear. Sum assured is a classic example that I do not want to delve into. But we see now that people are starting to collect Body Mass Index (BMI).
BMI is another example that you think is definitely non-linear. You do not want it to be too low or too high. Both are associated with different illnesses, and you want to model it correctly in the middle. NHS waiting times have been another topic since Covid. We are seeing newspaper headlines saying NHS waiting times are longer.
If we are trying to associate this, that is to model this along with our critical illness diagnosis, or people’s behaviour of purchasing private medical insurance, the difference in waiting time for procedures for three days and seven days will be quite different to three months and seven months. What we are trying to address here is that the traditional linear model will be struggling to capture reality – the complexity of the reality that we are facing nowadays.
We need something more advanced that can help us to detect interactions between variables and can also be identified in non-linear patterns.
A lot has happened in ML for insurance (Figure 26). In 2025, we see papers from the United States and Italy about putting ML into medical insurance pricing and health insurance. However, I remember last year, I think in this room, we had regulators saying we need to use ML with caution. Our professional actuarial judgements cannot be compromised.
Advances in machine learning for insurance.

In our modelling systems, we need to ensure transparency, and we need to take care when we incorporate ML into our modelling. That is why we think the hybrid model is a good way to go. It is not necessarily the right way, but it will be a good way to approach this.
Why use a hybrid model? If I use a metaphor here, I think of our traditional actuarial model GLMs as classic cars (Figure 27). These are well understood. The mechanics are reliable. We know how to maintain them. Historically, it has gone a long way. I don’t think these models are going to disappear anytime soon. For an ML, black box type model, I see it as a driverless car. It is very powerful. People are talking about it. It is very topical and it is highly automated. However, it is so automated that people start to question who is controlling it. Can the user really understand it? Who is steering the wheel? How do we know if there is a mistake, and do we know how to fix it if there is a mistake?
Hybrid models.

That is why I think a hybrid model is in some sense like a hybrid car. We are still using the same logic in a GLM as in our classic car. But we are also enhancing it with the modern technology we have. It is like installing a GPS system on the car. Why do we use the hybrid model? First, it retains the modeller’s choice. The modeller can still choose the structure, the assumptions that go in the model and the framework; the ML part is just to enhance the model, not to replace the actuaries.
Secondly, there is no change to the governance because the backbone of this model is still a GLM. The documentation – the audit – should remain little changed. It can fit into your current system, irrespective of whether your model goes into your pricing or goes into your reserving or claims underwriting. That is because it is like what we are used to. It should plug into the current system quite seamlessly. It is fully transparent because the modeller still chooses what goes inside the model. It is very helpful when explaining the model to the key stakeholders. It also saves time.
I know there are a few modellers sitting in the audience. I do not know whether you have gone through the pains of trying to add different interactions into a model, then trying to take them out and see how much they improve the model, and see if you can explain them; and also trying to model something that’s non-linear and checking the different pieces and trying to fit things piece by piece. All this heavy lifting is locked down by ML, and it is really a decision-maker rather than number crunching all the time. Can we enjoy ML, have our cake and use it appropriately and eat it? Our answer is yes.
Moderator (starting the Q&A): Thanks for a good presentation. We are moving to the questions and answers segment now.
Question: There is one question to do with your formula. I understood all the other terms, like efficacy, but I was not sure what the translation term was supposed to mean and how you are supposed to measure it in the first place.
Mr Nanda: It is a deuced difficult problem, going from the reach to the efficacy to the claims translation. I think what you find over time – and this is where the UK pilot studies will help – is that you have got to find a way to measure if the behaviour change, as a result of engagement, is translating to a reduction in claims. That is not a very simple problem to solve. It does take time, like I mentioned during the presentation. There is at least a three-year lag, at least in the Pepsico study that we did. It is the largest study of its kind. It was a seven-year study, and it found that over three years you start to see some of the results. If you measure before that, you can see a potential false negative. There is no right or wrong way to approach it. It is just that you must be very deliberate. There are ways that actuaries can measure what has been prevented, an emergency department (ED) visit that has been prevented, or an inpatient hospitalisation that has been prevented because of an intervention. You must be very methodical and thoughtful about it.
Question: I have two questions: One for Ankit (Nanda) and one for Paul (Klumpes). The question for Ankit (Nanda) is, first, I really like your framework. That is quite straightforward to implement, if we can get to the bottom of what you have just talked about. I think it is important, though, that we acknowledge that there are some complications and complexities to work around in some aspects of it.
In your efficacy distribution, you talked about it being positively skewed because of results of trials generally. To what extent, though, is that an artefact of publication bias, in that trials with positive outcomes tend to publish more than those with negative outcomes or non-significant outcomes. Also, you mentioned preventative screening. Screening can help with early detection. I think it depends on what the claims definitions are that you are interested in.
If early detection triggers a claim, then that is adverse to an insurer. But if it reduces later life, or prevents more severe health outcomes, which may be of main interest to the insurer, then that may outweigh the early claim. Also, particularly in the case of Kansas, there is increased over-diagnosis, as well, with screening. To what extent does an insurer have to pay out due to over-diagnosis when they would not have had to pay out before?
Mr Nanda: I can answer my part. I think there is a publication bias, like you correctly noted, and that is just a feature of the realm we are in. I mentioned that I feel like what Rx was over the last ten to twenty years, and it is continuing to be, is that mental health is today and prevention is going to be tomorrow. There is not a lot of light that has been shed on the subject just yet. But I feel like, in the interest of our profession and the fact that we are at the front lines of dealing with uncertainty on a day-to-day basis. It is our bread and butter. We have come up with solutions, and those solutions involve research papers, like the one that I wrote, and others, and more robust studies. Over time, I feel like this is going to come front and centre, and people are going to start talking about it. Some of those quirks, if you will, will resolve over time. The second question about over-diagnosis of cancer, I’m not sure I understood all of that.
Question: I guess it depends on the claims definition. Does the insurer pay out on detection of the disease? They might have to pay out earlier, or they might not have to pay out. In the case of over-diagnosis, they might have to pay out where, if screening had not happened, they would not have had to pay out. So that represents extra payouts.
Mr Nanda: I worked briefly in the critical illness space. Essentially, the policies in the United States, at least, are more lump sum in nature. If you get diagnosed with a condition, which is one of those covered disease conditions – it could be cancer, neoplasm or kidney disease – then you get a lump sum payment. The phenomenon has caught on in a place like America, where, with your ageing society getting sicker over time, the frequency has moved up quite a notch. The IFoA has a working party around critical illness incidence rates. But to your point, cancer is front and centre, and cancer frequency is going up over time. At least as far as I can see, based on American experience, the policies are built in a way that they pay out as soon as you have a diagnosis.
Question: I like this framework as well. I wonder how well it can account for, or can be extended to account for, other key factors not already discussed? Things like migration over time between Trusts, across demographics as well and things like step-changes in medicines and health technologies provision. For example, in the UK, the Health Technologies Regulator has recently increased the cost-effectiveness threshold. That means that quite a lot more medicines are more likely to get approved where they would not have before, where they were deemed as not cost-effective. What does that mean for generational equity? Also, things like general resistance in the health system to changing resource allocation principles as well?
Dr Klumpes: Some of these are what we call endogenous to the model, and some of them are exogenous. It is a closed model. People who do not like Manchester, if they choose to move to Newcastle, I don’t know what effect that would have. Migration between regions in the UK is not accounted for in these models. We must assume that people who come from those regions stay in those regions. It is a limitation of the model. It is a limitation of all generational accounting models that limitation of mobility is not accounted for.
In terms of the question of health technology and technological innovation, I wrote a similar paper to this. When this Big Pitch paper was accepted, I had just published a previous paper in Geneva, a paper on risk and insurance on the same topic, but using a different approach.
With the Geneva papers, I attempted to account for the impact of technological change. The empirical evidence on this is ambiguous. On the one hand, improved technology means people live longer, but that means they are going to be more fragile, and they will put more demand on the healthcare sector. On the other hand, you can see the benefits. If you can exploit AI technology, it will lead to improvements. I attempted in this previous paper to explicitly model the impact of technological innovation on enhancing the quality of care. In that case, the extent of the sustainability imbalance will be reduced.
The first part is, yes, it is exogenous, out of the model. I cannot control it. The second one, we can control for it, but then it is a little ambiguous given that the vast proportion of the inpatients, as opposed to outpatients, are very much driven by ageing. It is only going to result in further incidents of more fragile people placing demands on the Trusts. So, it is not clear.
Question: For the second instance, improved technology goes hand in hand with the NHS having to find more funding to pay for these more expensive health technologies as well?
Dr Klumpes: In the language of the third paper, the research is very much output driven. If it is the case that the technological AI tools can enhance, for example, the experience of the colleague here with the parent having an improved diagnosis of diabetes, then that will reduce the strain on the NHS Trust. The third or fourth slide showed that this is the outcome. It is where the inpatients are placing demands on these acute hospitals that the model is based. The more effort made to embrace these technologies and integrate social care and healthcare, the lower the strain will be on the NHS Trust.
Mr I. J. Rogers, F.I.A., C.Act: Thank you for a great set of presentations. My question is for Paul (Klumpes). I agree that the sustainability of the NHS is a key area for actuarial work. The aspects you brought up about the intergenerational challenges make for some interesting thinking, and things where we can usefully work them through. However, I think it would also be helpful to get a better understanding of some of the real-world public-sector dynamics in the system. For example, how the NHS as a whole works as a system. The NHS Trusts are not charities. If the NHS is funded out of general taxation revenue rather than solely national insurance, and the pensions that were mentioned in the paper as well are part of the national unfunded scheme, rather than being specifically allocated to individual Trusts on a liability basis, I think there are aspects to work through. There are lots of other things that happen in the NHS to consider in these projections as well, like drugs coming out of patent and windfalls from that, and also how the system as a whole works to implicitly ration some of the services provided. Maybe a backward look against the demographics would be insightful to think about in terms of how the forward look might play out. However, my question is bringing all that work back to the following: Where do we take this? What actions should be taken because of these insights? For example, if you were advising Manchester or Newcastle, what should they now do differently with that knowledge, as a result of that insight?
Dr Klumpes: First, there are regional variations here. There are various IFoA resources, but they are not for free. I could not gain access to certain IFoA resources.
The second item you ask about, and this is relevant to the Government Actuary’s Department, I’m not fully sure. There are two aspects to that. One is the concept of a social discount rate, which is embedded in HM Treasury. Across the channel, the vast proportion of continental European countries that estimate these things, they do not use that. They use the Gollier model. The Gollier model adjusts the discount rate for risk. There is subjectivity associated with that. It reduces the cost because, by definition, it is not risk-free. It is risk-adjusted.
The other angle that comes into this involves some risk-adjustment. You are aware of the NHS pension fund. There is a similar controversy about the appropriate discount rate for discounting obligations for the NHS pension fund. One of the things I discovered in the research was that applies both for Newcastle and Manchester. They make significant contributions to the NHS, but they do not hold themselves accountable in connection with pension obligation. They just say that it is not their problem. We have paid in the money and we do not care. But when you go to the NHS pension fund accounts, you discover that not only is it hugely underfunded, but every year the amount that is contributed is only 50 per cent of the amount that is required to be contributed.
So, there are broader aspects. I have not even started talking about the Private Finance Initiative issue, which is another problem. It seems to me there is a broader conversation here that if you are dealing with accountability, not to a specific set of stakeholders, but to the public at large, then there needs to be more actuarial input to stop uninformed public officials and union officials making unsubstantiated claims. They do not fully understand the dynamics.
Mr Rogers: What action should the Trusts take from the insights that you draw out and share?
Dr Klumpes: If I am honest with you, we need to cookie cut. A private-sector healthcare provider is obliged to provide returns to the Prudential Regulation Authority demonstrating their solvency, which requires actuarial assessment. In my opinion, NHS Trusts are subject to these emerging demographic population risks that affect their long-term finances and should be subject to a formal actuarial assessment. Because they are making a claim that they are a going concern. Every year, the auditor signs off on a boilerplate report saying you are a going concern.
But are they a going concern? I do not think so. They are showing deficits every year. It is getting worse. They need to come clean. Actuaries have a very important role to play in society. The actuarial profession is one of the few professions outside the accounting and medical professions with a legitimate role within the regulatory framework. The actuarial profession should have a role to validate the financial viability of NHS Trusts through our actuarial signoff.
Question: I have a question mostly about human behaviour, for both teams and for both speakers. You mentioned durability, but you did not explore that across generations, because generations behave differently. For younger generations, some of the behavioural nudges might not work for them because they respond to different nudges. When we have a fully automated or hybrid system behaviour, humans like to play and game systems. There is a major possibility that new generations come in and they gain expertise. They might have to develop experience, to gain professional experience over time, very differently to how we have. How do you think learning how to use these tools and models is different for the younger generation compared to someone who has professional experience?
Dr Luteijn: Let me rephrase that. The question is whether humans like to game the system. For younger generations that could be as the ones working with the models or as the customers working with the model. As the ones working with the models, one of the themes that we had in our presentation is about creativity. There are a lot of these models that are very powerful. There are a lot of ways in which you can leverage their strength. I would welcome any creative approaches. There is a wide range of possibilities. There were quite a few papers that all had different and creative approaches to leveraging the strength of these models. People have different views. Younger generations have different views. I only see synergy.
Mr Nanda: I turned 40 in February, so I am glad you reminded me I am past my prime! I do think that some of these principles are more universal. The fact that your losses mean much more to you than your gains, or that you discount the future heavily when you bring it to the present. I feel like some of them are transportable across generations. Every generation has its own mindset. We will see if some of these themes, which we believe are universal, do hold up. As it stands today, some of these do not have to be siloed into how Generation X thinks, Y thinks or Z thinks.
Miss Fan: If I put my pricing actuary’s hat on, we are talking about the newer generations. We do not have experience with that. There is the data that we do not have experience for, and we do not understand their behaviour. That is why we think we should leverage with ML techniques. We can then capture the patterns that we do not expect. For example, new generations might choose to purchase insurance with some financial advisors. They might see an advert on TV, or pop on Facebook, and this is an experience that we are not used to. Hence, we do not have a lot of actuarial judgements on how to price those. That is when ML can help us to understand the pattern rather than us trying to price it. The experience might be less relevant.
Mr Tam: I will add one more thing here. We are talking about the fully automated model but an actuary still needs to scrutinise the model in the same way as a traditional model. In the sense that we need to validate the relationships between model predictions and individual features. These are still very important even in automated modelling, so we are certain that the model does not overfit, nor is it prone to bias. Even though we are talking about an automated model, actuaries still need to fully understand the model before it goes live.
Question: A couple of questions for Paul (Klumpes). First, about the timeframe. The generational models that you are presenting are, if I understood correctly, based on a 50-year projection. The NHS plan talks about a ten-year timeframe. I think a lot of people working in the NHS are even struggling just with the current financial year. To what extent do you think 50 years is the most appropriate, or what are your thoughts about what the best time frame could be for this type of intergenerational view?
Then, secondly, about the scope. You focused on Acute Trusts. Do you think these approaches would extend to the wider health system? Bringing in primary care and social services, which you did touch on before, you have a whole systemwide approach and look at the modelling from that perspective. There is a lot of interplay between the services that the hospitals provide, what primary care can provide, and them working together as a system. They are not isolated.
Dr Klumpes: These are very good questions. The first one is about the time horizon. You are right. The NHS is working on a ten-year plan. These kinds of demographic trends are playing out over a much longer time frame. The other thing was a little bit to do with the limitations of the data that were available.
I went to the National Bureau of Statistics, and I had to spend a lot of time trying to work out whether there were statistics they provide that contain two aspects. One is a generational cohort-level breakdown of the population projections. In other words, people who are within Gen Z, Gen Y, Gen X, by gender, because we know that females live longer than men, so they must be modelled separately. Furthermore, it had to be regionally broken down.
I had to be able to ascribe that there was the Northwest and Northeast and then the Southeast and Southwest. The only data set they had went out to 2048, beginning 2022. These demographic impacts on sustainability can only be, unfortunately, established over the time when you can see perceptible changes in the ageing life expectancy of the population within the cohort level. So, I chickened out.
I went back to Australia, where I am from, and guess what? The Australian government produces generational accounts that also include aspects of unfunded healthcare, and they use a 50-year projection. Due to the lack of reliable, publicly available data sets, and due to the long timeframe in which these demographic effects impact financial sustainability, I am going well beyond a ten-year horizon. It is certainly a limitation.
In terms of its wider application to other forms of healthcare sector, I have, believe it or not, produced prior research on the application of generational accounts too, topics like unfunded public pensions in the EU. I had a few papers on that, looking at the impact on unfunded pension obligations. It also has impact on the assessment of unfunded public-sector fund care. I gave the example of the NHS Trust. There is also the Defence Forces Trust and the Civil Service Trust. Under accounting rules for UK National accounting, these unfunded public-sector pension obligations are not included in the national accounts.
In terms of the wider application to the healthcare sector, I did have a conversation earlier with the mental healthcare sector in Leicestershire. They saw a great application there. You must remember that its application to input-based service providers is potentially less severe than to the output-based providers, where I could measure the demand for the service at the inpatient level.
As soon as you move to outpatient level, then only these people go in for a single day. Then you go to the other sectors, primary healthcare sectors and mental healthcare sectors, and they are dealing with the issues at the earlier phase. That means that the technological incidence and impact is likely to be stronger in reducing the applicability and severity of financial sustainability issues.
Question: Thank you very much. That is a very detailed answer. My second question was thinking, to some extent, about the impact of preventative interventions. Where prevention takes place in a primary care setting. For example, where you have the cost in primary care, but then the savings are realised years later in the acute hospital, then there is that interplay. It is perhaps interesting to explore that to bring in that systemwide view.
Dr Klumpes: The research I had done was meant to be a case study for this presentation here. It is the tip of the iceberg. I have only started this research. I have not gotten that far. This was the pitch. More research is needed.
Question: I do endorse the recommendations around taking a longer-term view. I think it makes sense at an aggregate view. I am not convinced it makes sense at a regional view. The reason for that is because the way that the allocation formula works is that it essentially catches up, in theory, with changes in demographics over time. If you are Manchester and your population is ageing faster than Newcastle, the NHS allocation formula should take that into account. There is a big question over how quickly it takes it into account, because we still have a gap between what is theoretically allocated to Newcastle or Manchester and what is actually allocated. But that whole regional piece should sort itself out. However, at an aggregate level, it does not. That makes much more sense to me. You would not model it at an aggregate level. But I am not convinced about the regional aspect. Most NHS Trusts are trying to make their numbers add up for this year. I do not think you would find an actuary in the country prepared to sign them off as a going concern, if that was your standard.
It is also important to remember that the NHS does not have obligations in the way that we, as actuaries, think about obligations. It has a broad promise to provide a comprehensive health system. It does not have a benefit package. It does not write down anywhere that you are entitled to twenty sessions of physio within a certain time frame. There are no obligations in the sense of delivered health services. We must be careful in talking about that, as actuaries, because it is not a social insurance scheme, and it is not a private scheme. It is very much a pay-as-you-go scheme.
Having said all that, I do think there is quite a lot of value that actuaries can bring to that longer-term discussion about intergenerational equity. Also, and this is more of a comment than a question, I just wanted to endorse some of those points that you made because I do think it is important that we look at that.
Dr Klumpes: I think the reason for the regional variation is, at the end of the day, these entities are legally established within the remit of the charitable status to provide service with that region. One of the things I did come across, if you do not mind me saying, is a lack of reliable data produced by the NHS Trusts about anything related to demographics. I had to make assumptions about inpatients. In some cases, they did not even report the total number of inpatients. What they should really do is say: “This is the number of inpatients. These are their ages.” And we should know the nature of the intensity of the treatment that they required and the duration of that treatment.
I know, from the Australian case, the Australian medical authorities, together with researchers, developed an activity-based costing system that allowed a researcher to identify the pure cost of a different type of operation; so we can infer the nature of the intensity of that operation and its incidence in different generation cohorts who will use that service. We do not have any of that data at all.
Question: All that data does exist. It is just perhaps not available to a researcher for free. But it all exists.
Dr Klumpes: Maybe that is the call for research, getting some more data. I think the IFoA has a role. If the American Society of Actuaries can provide access to a fantastic rich data set, perhaps the IFoA can too.
Question: I am not qualified to speak about how much money the Society of Actuaries has versus the IFoA, or how they budget. I take your point. But that NHS data does exist.
Final note: At the conclusion of the event, the audience voted narrowly in favour of Presentation One, by Ankit Nanda, being the topic most worthy of further research. The vote was very close, and the Moderator said that this reflected the high quality of all three presentations. He thanked all presenters for their hard work and for answering the questions.


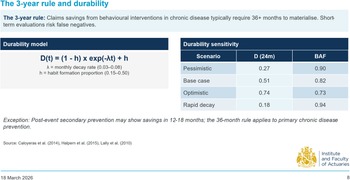


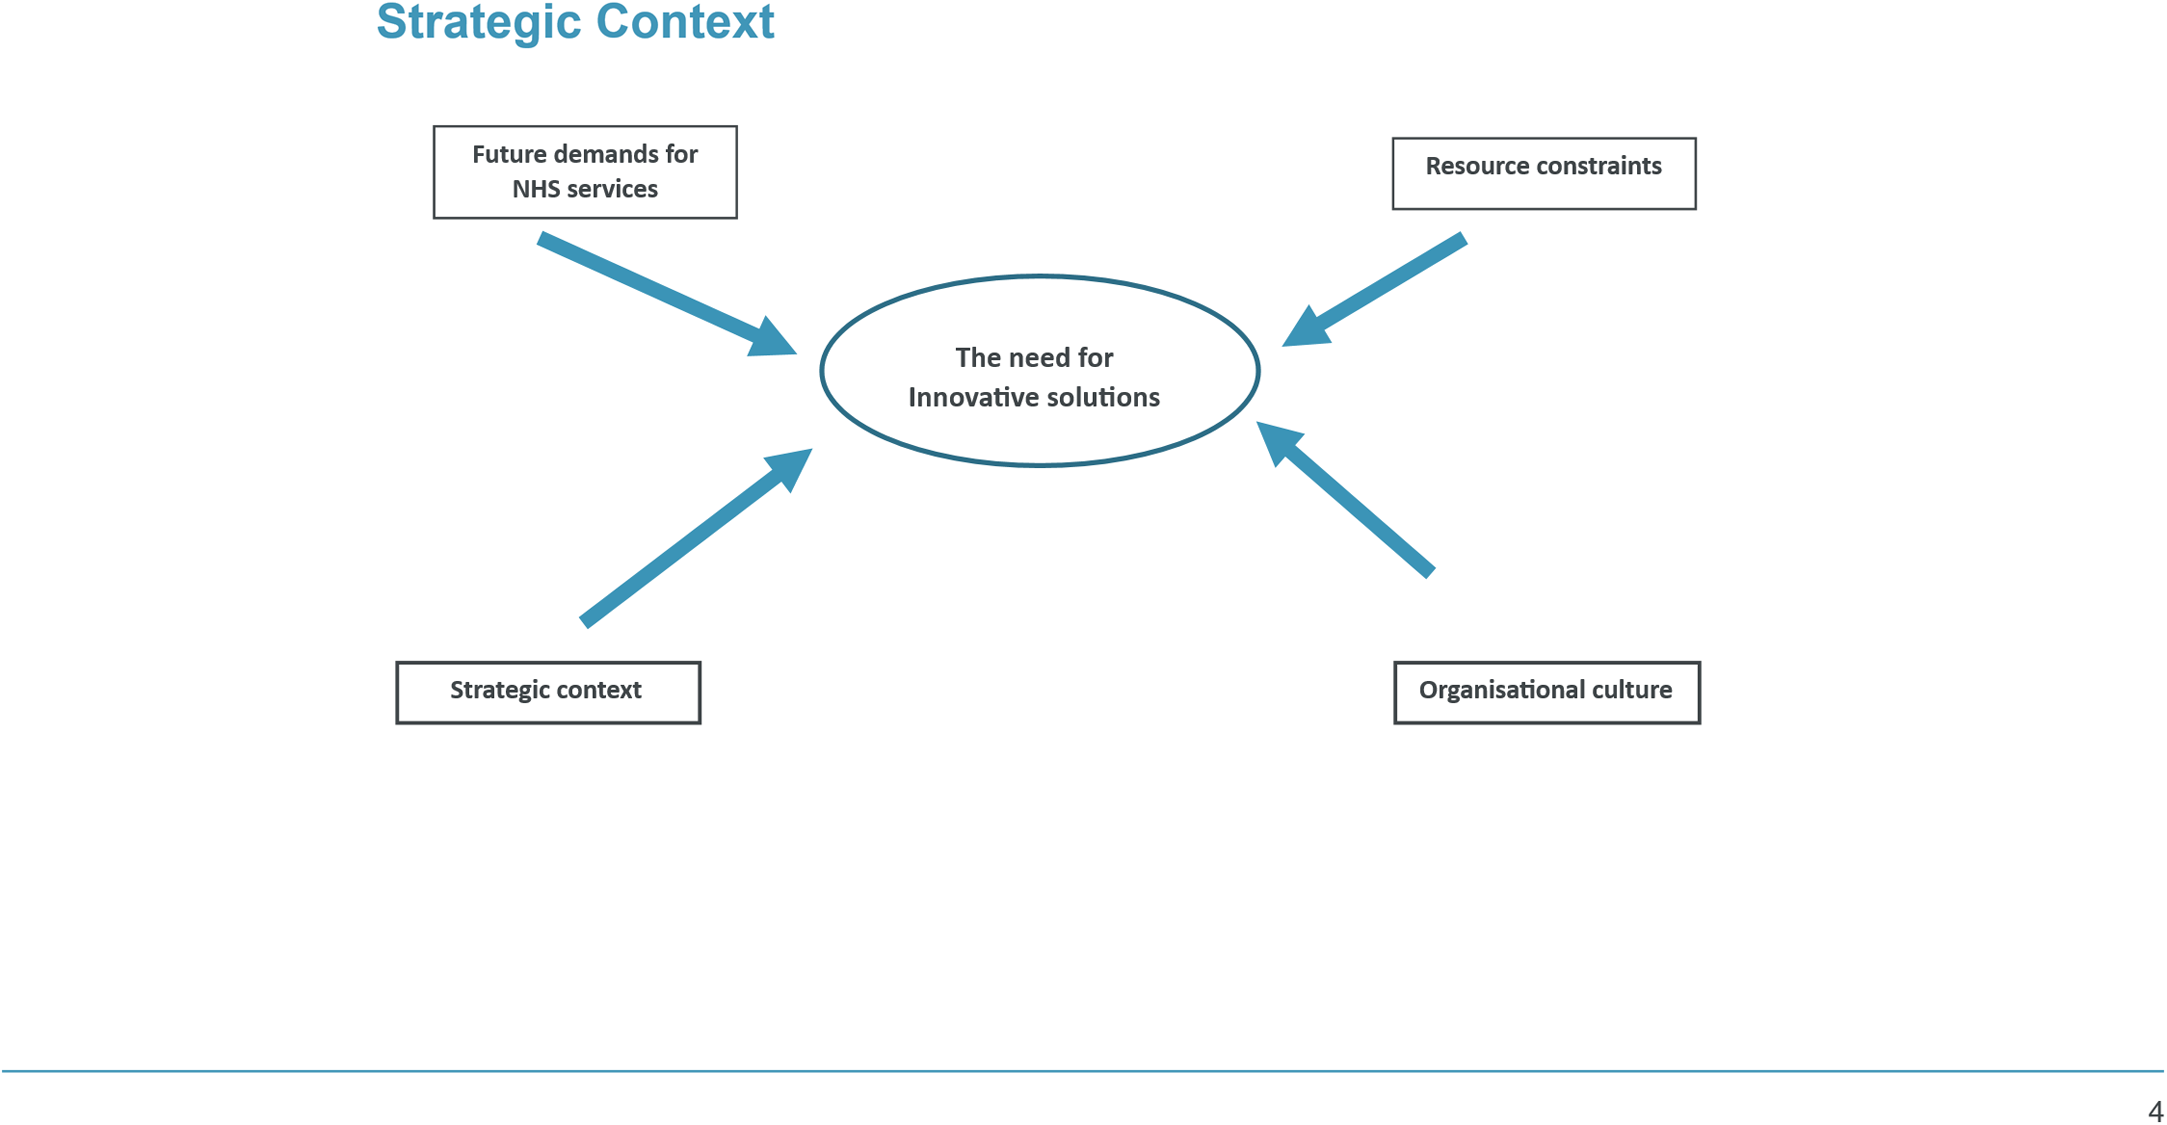

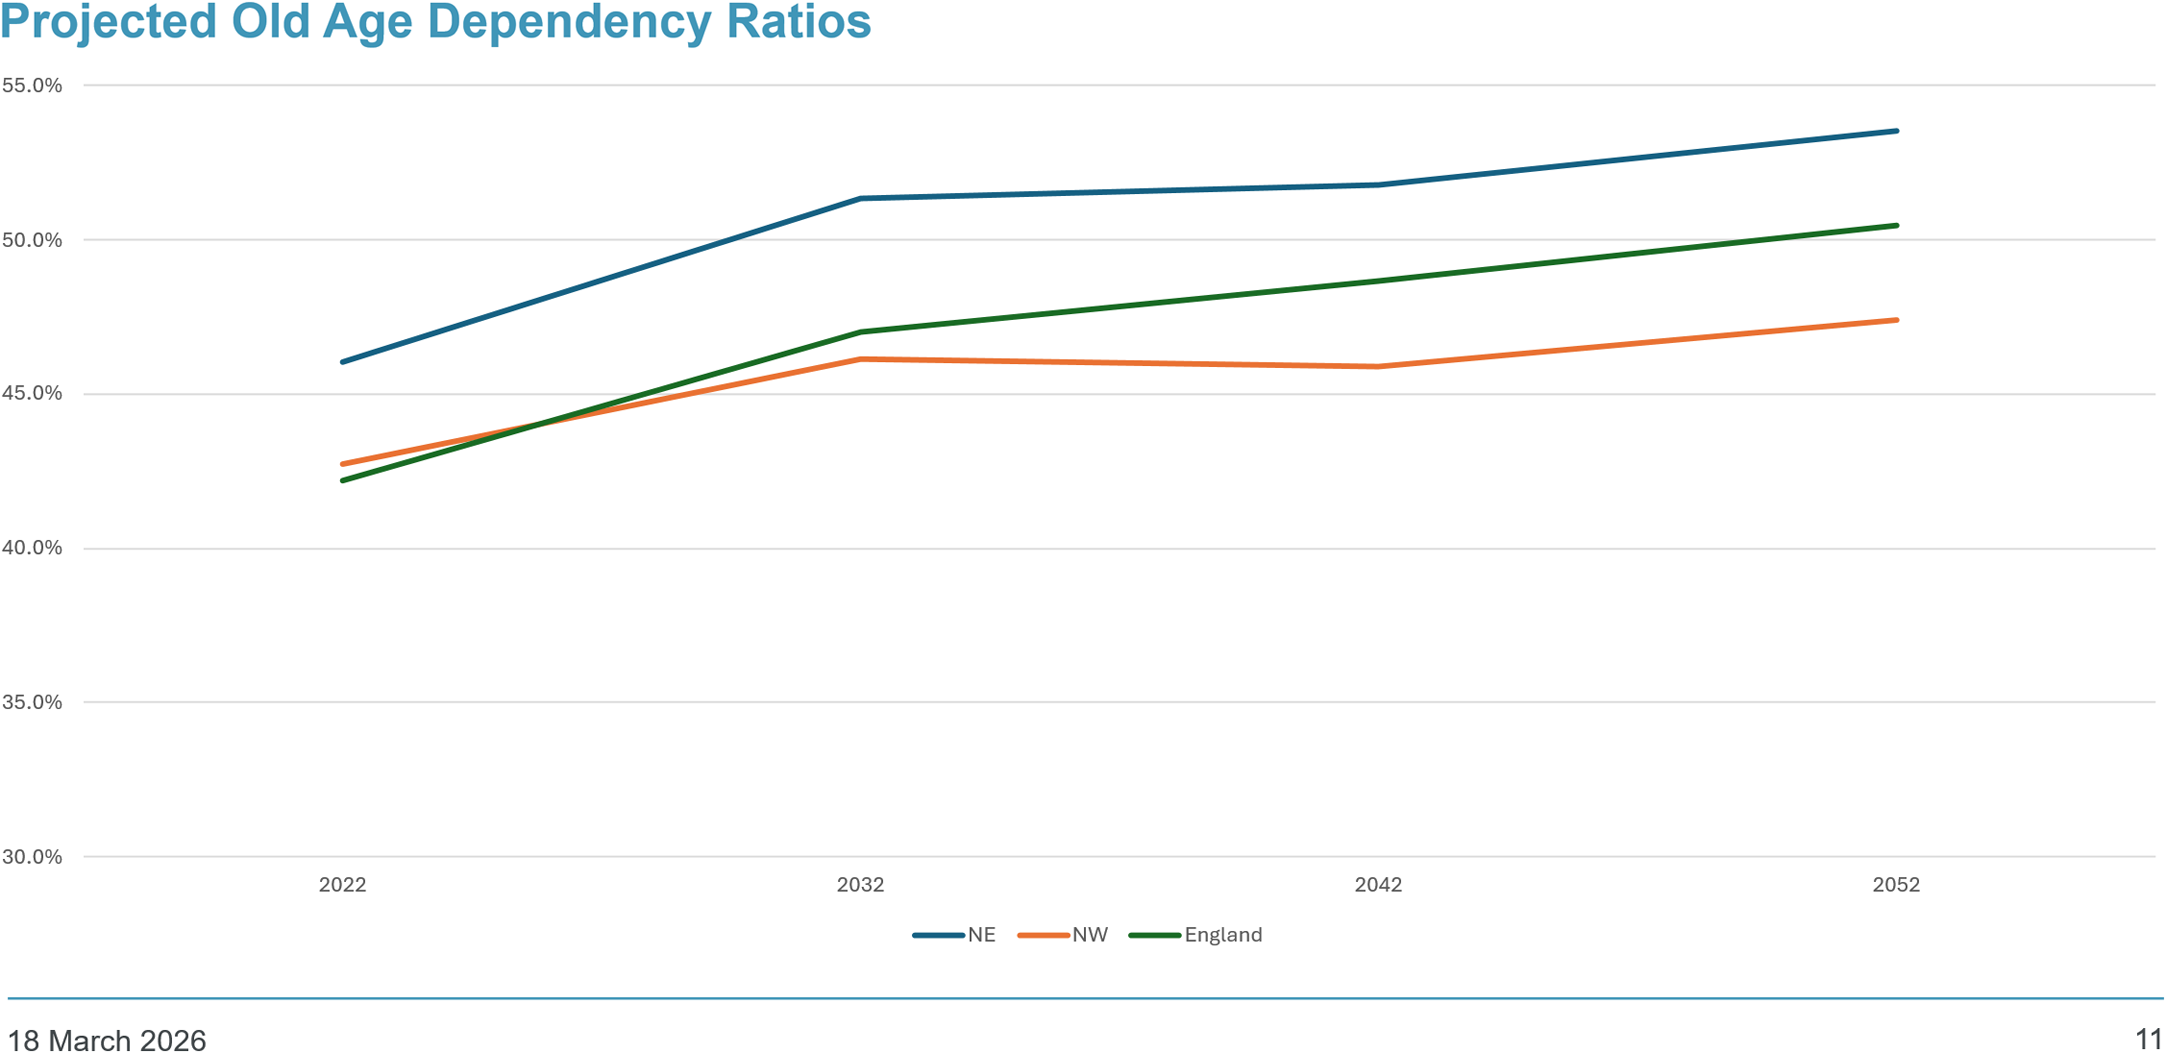
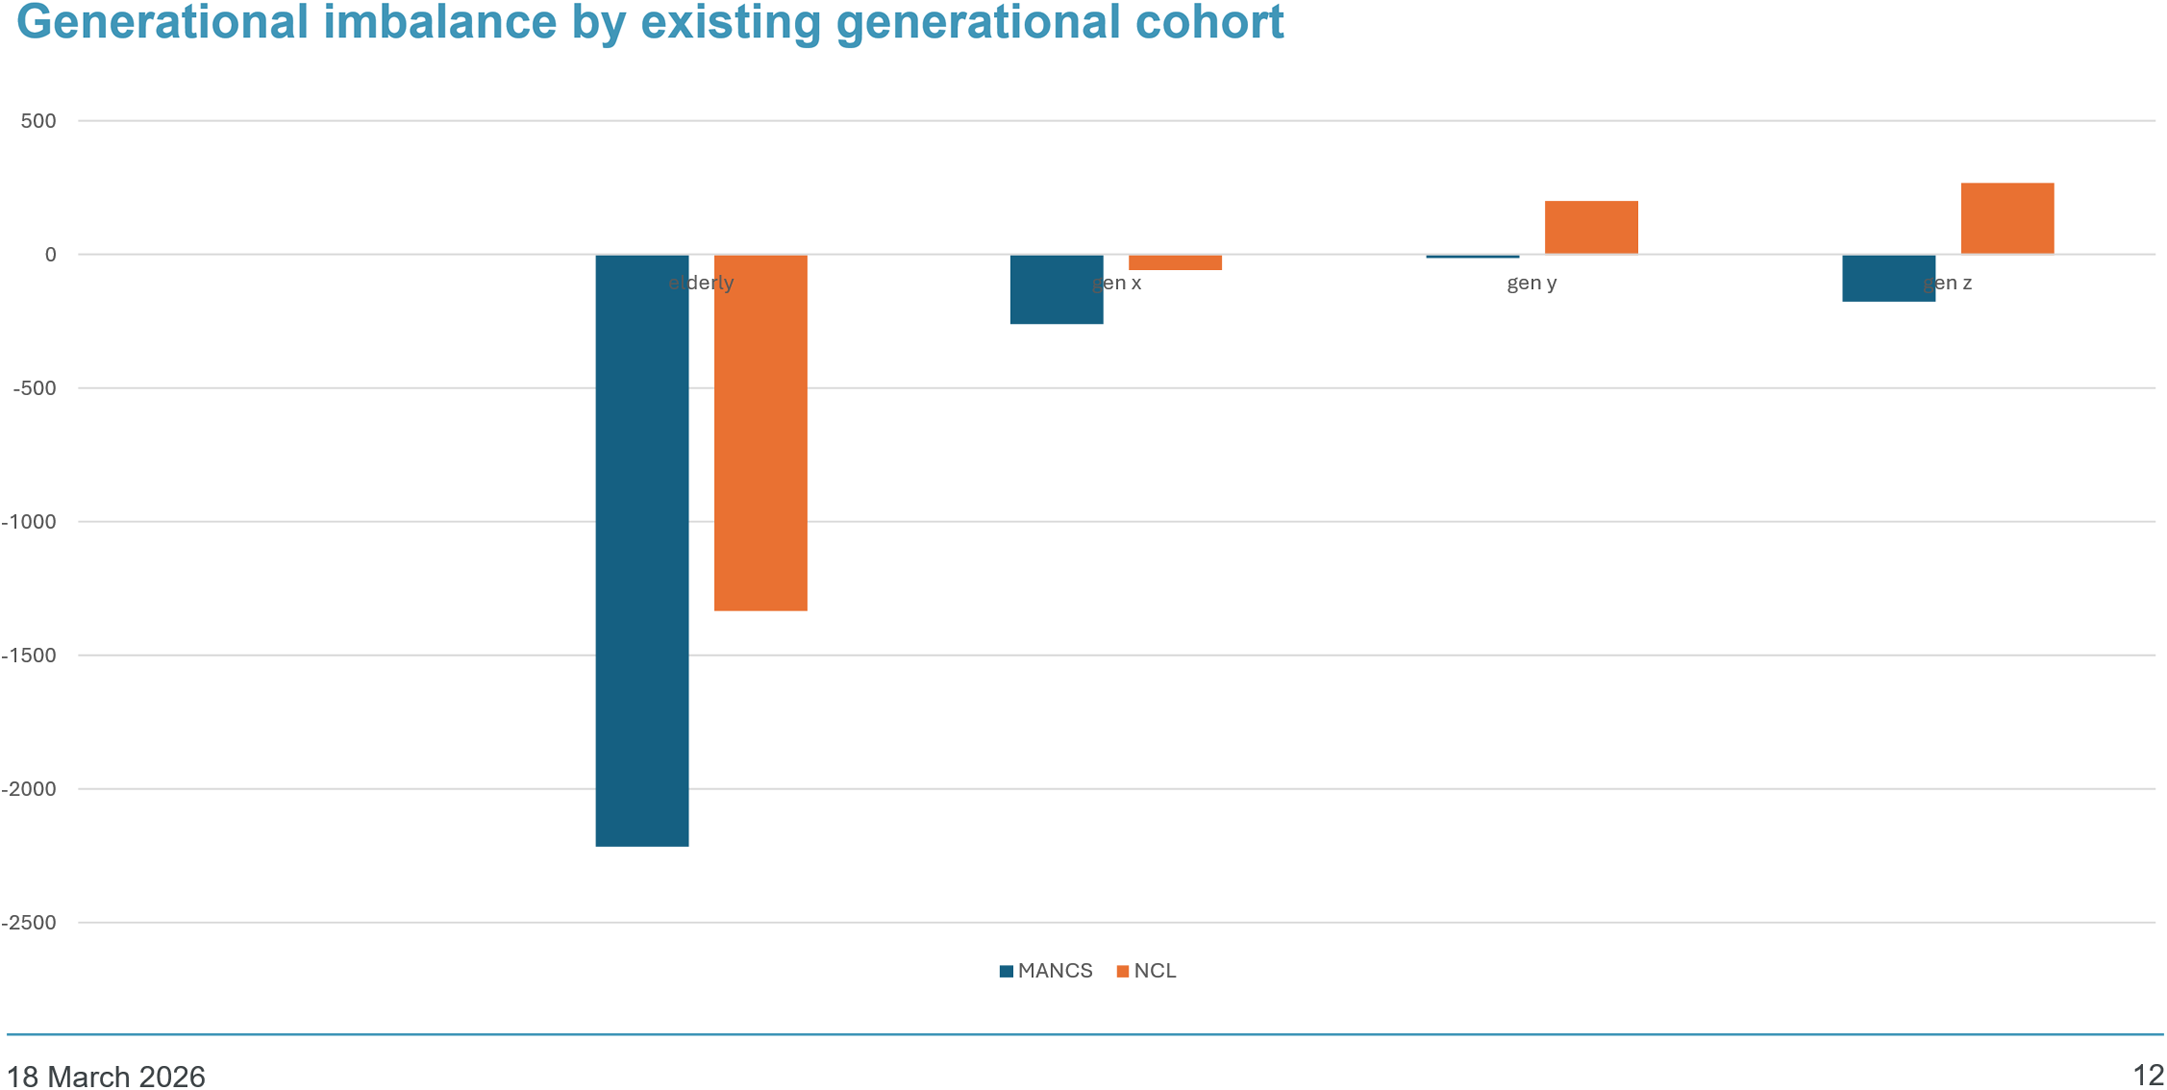


 Open access

