




1. Introduction
In pipeline transportation, turbulence causes significantly larger skin-friction drag than laminar flows, resulting in extra energy input in order to maintain the desired mass flow rate. Thus for the long-term consideration, even very limited reduction in friction drag can considerably lower the pollutant emission and bring about high economic benefits, which prompts researchers to develop efficient flow control methodology to improve the transport efficiency.
Currently, most of the control methods can be classified into two categories – passive and active control – and one of the promising active control strategies is wall oscillation. Inspired by the fact that a turbulent boundary layer can be suppressed temporarily by the sudden spanwise pressure gradient, Jung, Mangiavacchi & Akhavan (Reference Jung, Mangiavacchi and Akhavan1992) first demonstrated, via direct numerical simulations (DNS), that temporal wall oscillation in the spanwise direction is able to achieve as much as 40 % drag reduction in turbulent channel flow at  $Re_\tau =200$, with the optimal non-dimensionalized oscillating period being
 $T^+=100$. Hereinafter, the superscript
 $+$ denotes normalization with respect to the friction velocity
 $u_\tau =\sqrt {\tau _w/\rho }$ for velocity and
 $\nu /u_\tau$ for distance, where
 $\tau _w$ is the wall shear stress,
 $\rho$ is the density of the fluid, and
 $\nu$ is the kinematic viscosity. These results were verified by numerical simulations or experiments in channel flow (Baron & Quadrio Reference Baron and Quadrio1995; Miyake, Tsujimoto & Takahashi Reference Miyake, Tsujimoto and Takahashi1997; Choi, Xu & Sung Reference Choi, Xu and Sung2002; Quadrio & Ricco Reference Quadrio and Ricco2004), pipe flow (Nikitin Reference Nikitin2000; Quadrio & Sibilla Reference Quadrio and Sibilla2000; Duggleby, Ball & Paul Reference Duggleby, Ball and Paul2007; Coxe, Peet & Adrian Reference Coxe, Peet and Adrian2019) and turbulent boundary layer (Laadhari, Skandaji & Morel Reference Laadhari, Skandaji and Morel1994; Skandaji Rezg Reference Skandaji Rezg1997; Trujillo, Bogard & Ball Reference Trujillo, Bogard and Ball1997; Di Cicca et al. Reference Di Cicca, Iuso, Spazzini and Onorato2002). Further, Quadrio & Ricco (Reference Quadrio and Ricco2004) showed that a maximum net energy saving of 7.3 % can be achieved in turbulent channel flow of
 $Re_\tau =200$ as extra energy is needed to actuate the wall motion. They also successfully achieved the scaling of drag reduction in a certain period range, making it possible to develop a model to predict the drag reduction. Later numerical (Ricco & Quadrio Reference Ricco and Quadrio2008; Yao, Chen & Hussain Reference Yao, Chen and Hussain2019; Yuan et al. Reference Yuan, Zhang, Cui and Khoo2019) and experimental (Choi & Clayton Reference Choi and Clayton2001; Choi Reference Choi2002; Ricco & Wu Reference Ricco and Wu2004) studies, both in plane geometry, reported qualitatively similar drag reduction at similar Reynolds number. Yudhistira & Skote (Reference Yudhistira and Skote2011) first investigated numerically the turbulent boundary layer with spanwise wall oscillation, and the maximum drag reduction is generally lower than that in a channel (Skote Reference Skote2012; Skote, Mishra & Wu Reference Skote, Mishra and Wu2019). For a full collection of the drag-reduction data in different geometries, the reader can refer to the review by Ricco, Skote & Leschziner (Reference Ricco, Skote and Leschziner2021).
Based on the fact that near-wall (say, below  $y^+=15$) turbulence structures convect at a constant speed
 $U_c^+=10$ (Kim & Hussain Reference Kim and Hussain1993), Viotti, Quadrio & Luchini (Reference Viotti, Quadrio and Luchini2009) transformed the temporal oscillation into spatial oscillation, which is called standing wave oscillation or spatial oscillation. The induced boundary layer is called the spatial Stokes layer (SSL). The close relation between the optimal oscillating wavelength and optimal oscillating period through
 $U_c^+$ suggests a strong analogy of these two control methods. Nevertheless, it is found that the spatial oscillation can achieve more drag reduction than temporal oscillation if the wavelength and period are linked by
 $U_c^+$ (Yakeno, Hasegawa & Kasagi Reference Yakeno, Hasegawa and Kasagi2009). Skote (Reference Skote2013) showed that the streamwise gradient of mean spanwise velocity in the spatial oscillation case lowers the production of spanwise Reynolds stress, leading to a magnitude of this stress lower than that in the temporal oscillation case. However, an unambiguous and complete paradigm that explains the difference is still lacking.
Quadrio, Ricco & Viotti (Reference Quadrio, Ricco and Viotti2009) first combined the temporal and spatial wall oscillations to form the streamwise travelling-wave control in turbulent channel flow at  $Re_\tau =200$. In their study, a large number of cases were performed to obtain a drag-reduction map by varying the oscillating frequency and spatial wavenumber. Both drag increasing and reducing regions in the control parameter space were identified, and drag increase occurs when the phase speed coincides roughly with the near-wall convection velocity
 $U_c^+$. Quadrio & Ricco (Reference Quadrio and Ricco2011) discussed the relationship between the thickness of the generalized Stokes layer and drag reduction. Later, it is found, in turbulent channel flow, that the drag reduction deteriorates at high Reynolds numbers (Gatti & Quadrio Reference Gatti and Quadrio2013, Reference Gatti and Quadrio2016; Hurst, Yang & Chung Reference Hurst, Yang and Chung2014). In particular, in addition to the variation of oscillating period and spatial wavenumber, Gatti & Quadrio (Reference Gatti and Quadrio2016) further included the variation of velocity amplitude, forming an extensive sweep of the control parameters. It is shown that the effect of outer large-scale motions on drag reduction is subordinate. The latest numerical study of turbulent boundary layer with streamwise travelling-wave control was conducted by Skote (Reference Skote2022), with attention focused on the downstream development of drag reduction. The experiments conducted by Auteri et al. (Reference Auteri, Baron, Belan, Campanardi and Quadrio2010), which is the only experimental work in a pipe, and by Bird, Santer & Morrison (Reference Bird, Santer and Morrison2018) in turbulent boundary layers both confirm the DNS results of Quadrio et al. (Reference Quadrio, Ricco and Viotti2009). More recently, drag-reduction levels of 25 % at
 $Re_\tau =6000$ and 13 % at
 $Re_\tau =12\,800$ are reported experimentally by Marusic et al. (Reference Marusic, Chandran, Rouhi, Fu, Wine, Holloway, Chung and Smits2021), demonstrating the potential application prospects in practical problems.
It is certain that the success of spanwise wall oscillation in reducing skin-friction drag is rooted in the disruption of the self-sustaining process of near-wall turbulence, which involves the quasi-organized low/high-speed streaks and streamwise vortices. When temporal oscillation is imposed, the wall motion drags the near-wall streaks laterally, while the overriding streamwise vortices remain almost unaffected, causing the relative displacement between these two structures, and hence their spatial coherence is disrupted (Akhavan, Jung & Mangiavacchi Reference Akhavan, Jung and Mangiavacchi1993; Ricco & Wu Reference Ricco and Wu2004). As a consequence, the intensity and frequency of burst-sweep activity are significantly attenuated and the friction drag is reduced. Besides, the high-speed streak is driven by the near-wall shear layer to intrude below the adjacent low-speed streak when the wall velocity is accelerating (Quadrio & Sibilla Reference Quadrio and Sibilla2000), and the low-speed streak is significantly suppressed when the direction of streamwise vortex rotation counteracts the wall motion (Choi et al. Reference Choi, Xu and Sung2002). Moreover, Yakeno, Hasegawa & Kasagi (Reference Yakeno, Hasegawa and Kasagi2014) observed that the inclination of quasi-streamwise vortices leads to a strong streamwise stretching, hence strengthening the energy exchange between normal stress components, and thereby enhancing the rotational motions. This is in accordance with Choi (Reference Choi2002) and Choi & Clayton (Reference Choi and Clayton2001), who showed that a net negative spanwise vorticity is generated by the interaction of a vortex sheet generated by the Stokes layer with longitudinal vortices, resulting in the distortion of the mean velocity profile. However, this scenario is doubted by Touber & Leschziner (Reference Touber and Leschziner2012), who claimed that the visualized streak inclination follows from the direction of shear strain rather than the wall velocity, among which the latter seems to be the basis on which the above scenario rests. The more detailed description about the drag-reduction paradigm is provided by Agostini, Touber & Leschziner (Reference Agostini, Touber and Leschziner2015), who illustrated the interactions during the drag-reduction and drag-rise intervals by linking the turbulent vorticity with the Reynolds shear stress. Blesbois et al. (Reference Blesbois, Chernyshenko, Touber and Leschziner2013) predicted the streak pattern via the generalized optimal perturbation method, and the predicted results are in reasonable agreement with DNS.
Except for the studies that focus on the modification of near-wall turbulence structures, many studies, covering many other aspects, have comprehensively investigated the effect of temporal wall oscillation. The initial response of fluids to the wall oscillation is studied by Quadrio & Ricco (Reference Quadrio and Ricco2003) and Xu & Huang (Reference Xu and Huang2005) in channel flow, in which the longitudinal flow is found to cost a longer time to reach its statistically stable state than spanwise flow, and the suppression of energy transfer between the components of turbulent kinetic energy (TKE) is responsible for the drag reduction. Under the condition of constant pressure gradient (CPG), Ricco et al. (Reference Ricco, Ottonelli, Hasegawa and Quadrio2012) showed that the enhancement of turbulent dissipation leads to the initial decline of wall shear stress. This paradigm is corroborated by Ge & Jin (Reference Ge and Jin2017), who further linked the subsequent attenuation of dissipation to the variation of vorticity components. However, Agostini, Touber & Leschziner (Reference Agostini, Touber and Leschziner2014) concluded, by examining the phasewise variation of turbulence quantities under the condition of constant flow rate (CFR), that the dissipation rises and falls when the drag increases and decreases, respectively. Similar results have also been reported by Touber & Leschziner (Reference Touber and Leschziner2012) and Yuan et al. (Reference Yuan, Zhang, Cui and Khoo2019). This contradiction stems from the fact that the drag reduction manifests itself as the increase of mass flow rate in CPG conditions. Thus the comparison should be made between cases of controlled and uncontrolled flow with the same mass flow rate (Ricco et al. Reference Ricco, Skote and Leschziner2021). In this sense, such a contradiction disappears. Moreover, the effect of streamwise locally implemented wall oscillation on the downstream development of the flow is investigated by Skote, Mishra & Wu (Reference Skote, Mishra and Wu2015) in a turbulent boundary layer, and a spanwise locally implemented wall oscillation in a duct is studied by Straub et al. (Reference Straub, Vinuesa, Schlatter, Frohnapfel and Gatti2017).
Possibly due to the similarity between temporal and spatial oscillation, relatively less attention has been devoted to the latter. Skote (Reference Skote2011) applied spatial wall oscillation to a turbulent boundary layer and observed that the maximum and minimum drag reductions correspond to the locations of maximum and minimum wall velocity, respectively. Negi, Mishra & Skote (Reference Negi, Mishra and Skote2015) did innovative research on the modulation of a single low-speed streak by spatial wall oscillation in a laminar boundary layer. Lower wavenumber is observed to possess stronger suppression on velocity fluctuations in the laminar regime. However, when the flow undergoes transition, the mechanism is significantly different due to the nonlinear amplification process, hence the deduction for laminar regime is inapplicable. By comparing the temporal and spatial oscillation, Yakeno et al. (Reference Yakeno, Hasegawa and Kasagi2009) found that the phase dependency of Reynolds shear stress is more significant for the latter. Different from the conventional sinusoidal form of oscillation, Mishra & Skote (Reference Mishra and Skote2015) investigated the spatial oscillation with square waves in a turbulent boundary layer, aiming to increase the net power saving.
When applying such wall-motion-based control to turbulent pipe flow, the crucial difference, compared with plane geometry, is that the relaminarization is more likely to occur at low Reynolds numbers. For temporal wall oscillation, Choi et al. (Reference Choi, Xu and Sung2002) showed that relaminarization occurs in pipe flow of  $Re_\tau =150$ when oscillating at period
 $T^+ >150$ with velocity amplitude
 $A^+=10$, and
 $T^+ >100$ with
 $A^+=20$, while no relaminarization occurs in a channel even at the lower Reynolds number
 $Re_\tau =100$ with the same control parameters. Nikitin (Reference Nikitin2000) also reported relaminarization at
 $Re_\tau =133$, with (
 $A^+,T^+)=(9,105)$ in pipe flow. Besides, the control with a large oscillating period does not cause a drag increase, which is opposite to the channel flow results (Jung et al. Reference Jung, Mangiavacchi and Akhavan1992). He attributed this discrepancy to the centrifugal forces in cylindrical geometry, but no further details are provided. Biggi (Reference Biggi2012) and Xie (Reference Xie2014) applied streamwise travelling-wave control to turbulent pipe flow at
 $Re_\tau =200$, and they both observed relaminarization that does not occur in a channel at the same Reynolds number and control parameters (Quadrio et al. Reference Quadrio, Ricco and Viotti2009). Hence it is clear that the geometry is of great importance in affecting the flow behaviour.
To date, it is known that the thickness of the Stokes layer is crucial to the drag-reduction performance (Quadrio & Ricco Reference Quadrio and Ricco2011), and most studies focus on the quantitative relationship between the thickness and drag reduction. However, the detailed paradigm that describes the modification of near-wall turbulence due to the different thickness of the SSL is still lacking. Besides, much attention has been paid to the drag reduction in planar flows, while the number of studies focusing on pipe flow forced by wall motion are far fewer, and nearly all of them have been restricted to the streamwise-uniform form. More importantly, the mechanisms that cause the aforementioned difference between pipe and channel are still unclear (Xie Reference Xie2014). Hence, in the present study, we consider turbulent pipe flow with standing-wave control imposed to examine the drag-reduction behaviour using DNS, in the hope of extending the wall-motion control database, providing a more detailed drag-reduction scenario for different thicknesses of Stokes layer, and gaining further insight into the physical mechanisms of relaminarization in a pipe. A range of control parameter sweep is conducted, and the changes of flow field are shown by examining the turbulence statistics and the time evolution of instantaneous flow fields.
This paper is organized as follows. The computational details and control parameters are introduced in § 2. The drag-reduction results and comparison with previous studies are given in § 3. The turbulence statistics and the modification of flow structures for the non-relaminarization cases are discussed in § 4. The transient dynamics, the physical mechanisms during the relaminarization process in a pipe, and the comparison with channel flow are explored in § 5. Finally, § 6 summarizes the main findings of this paper.
2. Methodology
2.1. Computational details
We employ a cylindrical coordinate spectral element-Fourier DNS solver Semtex (Blackburn et al. Reference Blackburn, Lee, Albrecht and Singh2019; Blackburn & Sherwin Reference Blackburn and Sherwin2004) to conduct the simulations at a friction Reynolds number  $Re_\tau =u_\tau R/\nu =180$, where
 $R$ is the pipe radius (based on bulk velocity
 $U_b$, it is approximately
 $Re_b=U_b R/\nu =5300$). This Reynolds number is consistent with the previous pipe flow simulations (Eggels et al. Reference Eggels, Unger, Weiss, Westerweel, Adrian, Friedrich and Nieuwstadt1994; Wu & Moin Reference Wu and Moin2008). The physical model and computational domain are depicted in figure 1. No-slip and no-penetration boundary conditions are applied at the pipe wall. The azimuthal component of wall velocity is
 \begin{equation} W=A\sin(kx), \end{equation}
where  $A$ and
 $k=2{\rm \pi} /\lambda$ are the amplitude and streamwise wavenumber (with
 $\lambda$ the control wavelength), respectively. That is, the wall rotation velocity varies sinusoidally in the streamwise direction but remains constant in the azimuthal direction, implying azimuthal homogeneity.
Schematic diagram of the circular pipe with spatial wall oscillation imposed. The lengths of arrows denote qualitatively the magnitudes of wall velocity. A pipe length  $L=6{\rm \pi} R$ is employed. The corresponding velocity components are listed in parentheses.

The flow simulations are conducted under the condition of CPG, yielding a constant friction velocity  $u_\tau$ and hence allowing unique wall-unit scaling. A single flow field in the fully developed turbulent state of a stationary pipe is selected as the starting point for the simulations of controlled cases with different combinations of
 $A$ and
 $\lambda$. The drag reduction manifests itself as the variation of mass flow rate. Turbulence statistics are collected for more than 5500 viscous time units, which allows a fluid particle to travel more than 23 times through the pipe axial dimension at bulk velocity.
Regarding the computational domain length, Chin et al. (Reference Chin, Ooi, Marusic and Blackburn2010) suggested that a periodic pipe length of 8 ${\rm \pi} R$ seems to be sufficient to ensure that all statistics are not affected by the finite computational domain for
 $Re_\tau =170\unicode{x2013}500$. Based on the fact that the maximum wavelength of large-scale motion in turbulent pipe flow ranges from 8
 $R$ to 16
 $R$ (Kim & Adrian Reference Kim and Adrian1999; Morrison et al. Reference Morrison, McKeon, Jiang and Smits2004; Guala, Hommema & Adrian Reference Guala, Hommema and Adrian2006), Wu & Moin (Reference Wu and Moin2008) employed pipe length 15
 $R$ at
 $Re_b=5300$ and 44 000, and demonstrated its adequacy by computing the two-point correlation data. The domain length used in Eggels et al. (Reference Eggels, Unger, Weiss, Westerweel, Adrian, Friedrich and Nieuwstadt1994) is 10
 $R$, which is proved to be too short to let the large-scale motions decouple from the computational domain. Hence, in consideration of computational cost, a periodic pipe length of
 $L=6{\rm \pi} R$ is chosen in the present study.
The two-dimensional spectral element mesh, shown in figure 2, is deployed to discretize the meridional semi-plane, together with Fourier expansions in the azimuthal direction to represent the three-dimensional computational domain. The mesh consists of a  $50\times 10$ array of elements, in which the heights of the first two elements at the pipe axis are set equally and small enough to ensure the computational stability due to polar singularity, while the remaining element heights follow a geometric degression to the wall. We employ a 10th-order nodal shape function (11 points along the edge of an element,
 $P=11$), resulting in a minimum grid resolution
 $\Delta r^+=0.53$ at the wall and a maximum of
 $\Delta r^+=3.6$ at the pipe axis. The streamwise grid spacing is
 $\Delta x^+=6.8$. In the azimuthal direction, 192 planes (
 $N_z=192$) are employed, yielding an azimuthal spacing of
 $\Delta (r\theta )^+=5.9$. The total computational nodes are approximately
 $1.2\times 10^7$. Here,
 $x,r,\theta,t,p$ denote the streamwise, radial and azimuthal directions, plus time and pressure, and the corresponding velocity components are
 $u$,
 $v$ and
 $w$, respectively. The wall-normal distance is defined as
 $y=R-r$, and the unit length scale is pipe diameter
 $2R$. Moreover, the abbreviation ‘SW’ used in this paper denotes ‘standing wave’. For a validation test of the computational mesh, see Appendix B.
Spectral element meshes for the pipe, with 500 elements in the meridional semi-plane.

There are two main aspects discussed in this paper: one is the turbulence modifications for non-relaminarization cases (NRC), and the other is the transient dynamics for relaminarization cases (RC). Based on the forcing signal (2.1), a phase-averaged quantity  $\tilde {f}$ is defined as
 \begin{equation} \tilde{f} = \frac{1}{{2{\rm \pi} T}}\int_0^T {\int_0^{2{\rm \pi} } {f\,{\rm d}\theta\, {\rm d}t} } (\text{for NRC}),\quad \tilde{f} = \frac{1}{{2{\rm \pi}}} \int_0^{2{\rm \pi} } {f\,{\rm d}\theta}\ (\text{for RC}). \end{equation}
A further average in  $x$ of
 $\tilde {f}$ is denoted as
 $\bar {f}$. A global quantity follows from
 \begin{equation} [f] = \int_0^R {\bar{f}} r\,{\rm d}r. \end{equation}
For controlled cases, the determination of the fluctuation field is given by
 \begin{equation} \{ u',v',w',p'\} = \{ u,v,w,p\} - \{ \tilde{u},\tilde{v},\tilde{w},\tilde{p}\}. \end{equation}
2.2. Control parameters
In the present study, one baseline case (uncontrolled pipe) and 12 additional controlled cases, in which the wavelength  $\lambda ^+$ varies at fixed
 $A^+=12$ or the velocity amplitude
 $A^+$ varies at fixed wavelength
 $\lambda ^+=1695$, are conducted to evaluate the drag-reduction performance of spatial wall oscillation. The whole set of simulations is documented in table 1. Under the condition of CPG, the drag reduction is defined as the ratio of the variation of the friction coefficient
 $C_f=2\tau _w/U_b^2$ to the uncontrolled value
 $C_{f,0}$ (Kasagi, Hasegawa & Fukagata Reference Kasagi, Hasegawa and Fukagata2009; Ricco et al. Reference Ricco, Ottonelli, Hasegawa and Quadrio2012), which can be written as
 \begin{equation} D = \frac{{{C_{f,0}} - {C_f}}}{{{C_{f,0}}}} = \frac{{U_b^2 - U_{b,0}^2}}{{U_b^2}}. \end{equation}
Cases with different control parameters at  $Re_\tau =180$. Case 0 is the uncontrolled pipe. Here, RLM denotes relaminarization, corresponding to a drag-reduction value
 $D=89\,\%$.

3. Control results
3.1. Drag-reduction results
The drag-reduction results for different cases are shown in table 1. Relaminarization occurs for cases where both the wavelength ( $\lambda$) and amplitude (
 $A$) are relatively large. It can be observed preliminarily that increasing the wavelength or amplitude can both lead to relaminarization, a trend that will not occur in channel flow (Viotti et al. Reference Viotti, Quadrio and Luchini2009). Hence it is necessary to compare the present results with the existing literature data, as shown in figure 3. Also included are the results from temporal wall oscillation in a pipe (Quadrio & Sibilla Reference Quadrio and Sibilla2000; Choi et al. Reference Choi, Xu and Sung2002), a channel (Quadrio & Ricco Reference Quadrio and Ricco2004) and a turbulent boundary layer (Skote Reference Skote2022) since the wavelength (
 $\lambda$) and period (
 $T$) can be linked by (Quadrio et al. Reference Quadrio, Ricco and Viotti2009; Viotti et al. Reference Viotti, Quadrio and Luchini2009)
 \begin{equation} {T^ + } = \frac{{{\lambda ^ + }}}{{{U_c^ + }}}. \end{equation}
(a) Variation of drag reduction with respect to wavelength at fixed amplitude. (b) Variation of drag reduction with respect to amplitude at fixed wavelength. For temporal oscillation cases, the oscillating period is converted to wavelength via (3.1). The dashed line represents the drag-reduction value for laminar flow. Note that Choi et al. (Reference Choi, Xu and Sung2002) did not provide the specific drag-reduction values for relaminarization cases, thus here we simply put them on the dashed line.

Figure 3(a) presents the variation of drag reduction with respect to wavelength at fixed amplitude. In channel flow, with the increasing of wavelength, the drag reduction increases initially and then decreases, yielding an optimal wavelength  $\lambda ^+=1000\unicode{x2013}1250$. For pipe flow, the results of low-wavelength cases (cases 1, 2 and 3 in table 1) coincide with those in a channel (Viotti et al. Reference Viotti, Quadrio and Luchini2009; Hurst et al. Reference Hurst, Yang and Chung2014), while further increase in wavelength leads to relaminarization. Note that the simulations in Viotti et al. (Reference Viotti, Quadrio and Luchini2009) are conducted under the condition of CFR at
 $Re_\tau =200$; the drag reduction leads to a lower
 $Re_\tau$ which is hence comparable to that in present study. The finite domain length restricts the maximum wavelength to 3390. But if the wavelength increases to infinity, then it can be considered theoretically as a purely rotating pipe with circumferential wall velocity
 $A^+=12$ in the finite pipe domain. Therefore, we also performed DNS of a purely rotating pipe with
 $A^+=12$, and the results show that the turbulence also relaminarizes, which is broadly in line with Murakami & Kikuyama (Reference Murakami and Kikuyama1980), Orlandi & Fatica (Reference Orlandi and Fatica1997) and White (Reference White1964). However, it should be noted that the relaminarization mechanism is different from spatial wall oscillation. For a purely rotating pipe, the whole bulk flow is rotating, and the strong centripetal force prevents the outward motion of fluid particles from the fast-moving central region towards the pipe wall (White Reference White1964), which significantly suppresses the turbulence; while for wall oscillation, the central region is not rotating, and the generated spatial Stokes layer (SSL) is confined to only the very near-wall region. It will be shown in § 5 that the SSL in pipe flow can continuously drain energy from turbulence, leading to the gradual decay of turbulence and final relaminarization.
When considering the temporal wall oscillation, the same trend can be observed for a channel (Quadrio & Ricco Reference Quadrio and Ricco2004) and a turbulent boundary layer (Skote Reference Skote2022), with the optimal oscillating period located at around  $T^+=100\unicode{x2013}125$. It is already known that spatial oscillation can achieve more drag reduction than temporal oscillation (Viotti et al. Reference Viotti, Quadrio and Luchini2009; Skote Reference Skote2013). However, for pipe flow, the increase of oscillating period also leads to relaminarization (Choi et al. Reference Choi, Xu and Sung2002). (For cases in Quadrio & Sibilla (Reference Quadrio and Sibilla2000), the oscillating period is not large enough to induce relaminarization.) Besides, for low oscillating periods, the results of pipe flow agree well with those in a channel. Therefore, it can be concluded, at relatively low Reynolds numbers, that for low wavelength or low oscillating period, there is no remarkable difference between pipe and channel. But for large wavelength and period, the flow relaminarizes in a pipe, while it remains turbulent in a channel and the drag reduction deteriorates.
Some of the experimental data that pertain to standing wave control in Auteri et al. (Reference Auteri, Baron, Belan, Campanardi and Quadrio2010) are also included for comparison. The lower drag reduction compared to numerical results can be attributed to the spatial transient at the upstream end of the actuated section (the section where the wall is rotating) because the drag-reduction values are determined by measuring the pressure drop across the actuated section. Another issue that deserves to be noted is that no relaminarization is reported in the experiment despite the fact that relaminarization is also achievable by the streamwise travelling-wave control (Biggi Reference Biggi2012; Xie Reference Xie2014). This is predictable since the perturbations from the discrete actuated section and the roughness of the pipe surface in the real world are large enough to trigger the transition to turbulence at the Reynolds number considered in the experiment, hence the laminar state cannot be maintained.
Figure 3(b) shows the variation of drag reduction as a function of amplitude at fixed wavelength. Again, the drag-reduction results of low-amplitude cases (cases 6, 7 and 8 in table 1) agree well with those in a channel (Viotti et al. Reference Viotti, Quadrio and Luchini2009), indicating the strong similarity between pipe and channel for low-amplitude cases. Similarly, relaminarization occurs at large amplitudes in a pipe. For channel flow, the literature data for large amplitude of standing wave control are limited, therefore it is uncertain whether it relaminarizes at large amplitudes. Nevertheless, the temporal oscillation data from Quadrio & Ricco (Reference Quadrio and Ricco2004) clearly show that there is a saturation of drag reduction up to  $A^+=27$. In addition, according to Choi et al. (Reference Choi, Xu and Sung2002), the drag reduction shows a trend of saturation for
 $T^+=50$, but relaminarization occurs at large amplitude for
 $T^+=100$. Since the thickness of the temporal or spatial Stokes layer is closely related to the oscillating period or wavelength, it can be inferred that sufficiently large thickness of Stokes layer and simultaneously large amplitude are required for the relaminarization in pipe flow.
It is worth noting that Zhao, Huang & Xu (Reference Zhao, Huang and Xu2019a) conducted DNS of turbulent flow along a cylinder with circumferential oscillating Lorentz force. They showed that the generated Stokes layer weakens the turbulence intensity and reduces the wall friction drag. But if the thickness of the Stokes layer is large enough, then the occurrence of centrifugal instability will generate intense circumferential vortices that are similar to the rotation-induced vortices reported in Zhao, Huang & Xu (Reference Zhao, Huang and Xu2019b) and lead to the sharp increase of friction drag, indicating that the thickening of the Stokes layer makes the flow unstable; in the present study, the thickening of Stokes layer relaminarizes the flow (i.e. the flow becomes stable). Such opposite trends highlight the difference between external and internal flow forced by rotational forcing. That is, for external flow, the angular momentum decreases with the radius, and the centrifugal effect tends to throw the fluid particles outwards, which destabilizes the flow, while for internal flow, the radial motions are impeded since the centrifugal force acting on the fluid particle from the outer layer is larger than that on the inner particle, hence the flow tends to be stable (White Reference White1964).
3.2. Energetic performance
In this subsection, a series of control performance indices (Kasagi et al. Reference Kasagi, Hasegawa and Fukagata2009; Gómez et al. Reference Gómez, Blackburn, Rudman, Sharma and McKeon2016) are computed to evaluate the energetic performance of standing wave control. Multiplying the governing equation of  $\tilde {w}$ (4.5) by
 $\tilde {w}$ and taking the average in the
 $x$ direction, all the
 $x$-derivative terms vanish due to the streamwise periodicity of the forcing signal (2.1). After that, by integrating along the radial direction (
 $\int _0^R r\,{\rm d}r$), we have the global energy balance for circumferential mean flow in pipe:
 \begin{equation} \left[ { - \widetilde{v'w'}\,\frac{{\partial \tilde{w}}}{{\partial r}}} \right] + \left[ { - \widetilde{u'w'}\,\frac{{\partial \tilde{w}}}{{\partial x}}} \right] + \underbrace{\left[ {\frac{{\widetilde{v'w'}\tilde{w}}}{r}} \right]}_{\wp} = \frac{1}{2}\,\nu [\nabla^2 {\tilde{w}^2}] - \nu \left[ \left({\frac{{{{\tilde{w}}}}}{r}}\right)^2+{\left(\frac{{\partial \tilde{w}}}{{\partial r}}\right)^2} + {\left(\frac{{\partial \tilde{w}}}{{\partial x}}\right)^2}\right]. \end{equation}
In the derivation of (3.2), the transport term disappears since Reynolds stress and velocity are zero at the wall. The three terms on the left-hand side represent the energy exchange with the TKE transport equation. The rightmost term on the right-hand side is the mean dissipation. Hence  $\tfrac {1}{2}\nu [\nabla ^2 {\tilde {w}^2}]$ is the power input. By further manipulations, the power input for the whole system reads
 \begin{equation} {P_{in}} = 2{\rm \pi} RL{\left. \nu{\left(\overline{\tilde{w}\,\frac{{\partial \tilde{w}}}{{\partial r}}}\right)} \right|_ {r=R}}. \end{equation}
Under the condition of CPG, the power saving rate  $S$ is defined as (Baron & Quadrio Reference Baron and Quadrio1995)
 \begin{equation} S = ({P_c} - {P_u})/{P_u}, \end{equation}
in which  $P=f_x {\rm \pi}R^2 LU_b$ is the power required to drive the flow, and the subscripts
 $c$ and
 $u$ denote controlled and uncontrolled pipe, respectively. Note that the power saving rate is equivalent to the variation of mass flow rate. A net energy saving rate
 $N$ is calculated by taking the power input into account:
 \begin{equation} N = ({P_c} - {P_u} - {P_{in}})/{P_u}. \end{equation}
Finally, the effectiveness is computed as the ratio of power saved to power input:
 \begin{equation} E = ({P_c} - {P_u})/{P_{in}}. \end{equation}
The computed energetic performance indices are listed in table 2. Undoubtedly, relaminarization produces a vast increase of mass flow rate (207.7 %) for case 4, thereby leading to a high net energy saving rate of 161.2 % since only 46.5 % of the power input rate is required. For non-relaminarization cases of  $A^+=12$ (cases 1, 2 and 3), a power saving rate of approximately 30 % can be achieved, but it is at the cost of high power input (more than 58.2 %), which inevitably causes the high negative net energy saving rate. As the wavelength increases, the power saving rate increases accordingly, accompanied by the decrease of power input and the reduction of negative net energy saving rate. On the contrary, for non-relaminarization cases of
 $\lambda ^+=1695$ (cases 6, 7 and 8), less power input is required due to the low amplitude, and the power saving rate is relatively low accordingly (less than 17.9 %). But they all achieve positive net energy saving. As the amplitude increases, both the power input and energy saving increase, but the maximum net energy saving is attained at a moderate amplitude
 $A^+=4.5$ (case 7). Hence in order to attain a positive net energy saving, one should lower the amplitude and increase the wavelength. In terms of effectiveness, cases 6, 7 and 8 all exceed one, but cases 1, 2 and 3 are less than one. Increasing the wavelength leads to the increase of effectiveness, while the increase of amplitude reduces the effectiveness. This implies that increasing the wavelength rather than increasing the amplitude seems to be a better choice to improve the control efficiency.
Energetic performance indices for different cases. Here, RLM denotes relaminarization, corresponding to a drag-reduction value  $D=89\,\%$, and
 $(P_{in}/P_u)_{lam}$ (%) is calculated using (4.4). For relaminarization cases, only case 4 is chosen for the assessment.

4. Turbulence statistics
In this section, we focus on the modification of turbulence statistics for non-relaminarization cases. In general, it is natural to compare two cases with one control parameter fixed and the other changed. However, as shown in § 3.1, the flow relaminarizes when both the wavelength and amplitude are large. If we pick up two cases in turbulent regime with one of the control parameters fixed for comparison, then it is probable that the flow states do not differ greatly because the parameters are close. Therefore, we choose cases 2 and 8 for comparison. The former is characterized by small thickness of SSL but strong crossflow shearing, while the latter is characterized by the large thickness of SSL but weak shearing. It is found that such a difference leads to two distinct flow states, for which the drag-reduction mechanisms are significantly different.
4.1. Basic flow statistics
Profiles of streamwise mean velocity, scaled with the friction velocity  $u_\tau$, are presented in figure 4(a). All profiles overlap in the viscous sublayer (
 $0< y^+ <5$) due to the constraint of CPG. It should be noted that the existence of a logarithmic region requires that the outer part of the inner layer (
 $y/R<0.1$) corresponds to large
 $y^+$ (
 $y^+>30$) such that the viscous effect is negligible (Pope Reference Pope2000). For the Reynolds number considered here,
 $y/R=0.1$ corresponds to
 $y^+ \approx 18$, which means that the logarithmic region with ‘universal’ constants is not well-justified. Hence we determine the Kármán constant
 $1/\kappa$ by examining the local minimum region of
 $y^+ \,{\rm d}\bar {u}^+/{{\rm d}y}^+$ (Eggels et al. Reference Eggels, Unger, Weiss, Westerweel, Adrian, Friedrich and Nieuwstadt1994), as shown in figure 4(b). The calculated value
 $1/\kappa =2.76$ for the uncontrolled case is the same as in Wu & Moin (Reference Wu and Moin2008). For case 2, the local minimum of
 $y^+ \,{\rm d}\bar {u}^+/{{\rm d} y}^+$ is less distinct, implying the shrinkage of the logarithmic region, but one can still identify a value 1/
 $\kappa =2.91$. For case 8, the local minimum almost disappears. This is probably due to the larger penetration depth of the SSL, which makes the viscous effect extend to the outer region and further drives the reduction of the logarithmic region.
(a) Mean streamwise velocity profiles for cases 2 and 8. The logarithmic slope  $1/\kappa$ is determined by computing the local minimum of
 $y^+\,{\rm d}\bar {u}^+/{\rm d}y^+$, as shown in (b). The constant
 $C=5$ for uncontrolled case is obtained by substituting the mean velocity at
 $y^+ \approx 60$ into the logarithmic formula, with the given value of the slope 1/
 $\kappa$.

Figure 5(a) presents the wall-normal profiles of Reynolds stresses. As expected, the larger drag reduction corresponds to the lower Reynolds shear stress  $\overline {u'v'}$ in the buffer layer. Below
 $y^+ \approx 20$, the streamwise stress
 $\overline {u'u'}$ for case 2 is significantly lower than for case 8, but the maximum
 $\overline {u'u'}$ for case 2 is higher, indicating that there is no direct correlation between the maximum streamwise stress and the amount of drag reduction. For circumferential normal stress
 $\overline {w'w'}$, it is elevated across the buffer layer for case 8 while it is reduced for case 2 below
 $y^+ \approx 20$. Meanwhile, the variation of radial normal stress
 $\overline {v'v'}$ for case 8 is indistinguishable, while for case 2,
 $\overline {v'v'}$ declines slightly across the buffer layer. Based on these descriptions, two different drag-reduction scenarios can be depicted roughly. For case 8, the thickness of the SSL is large enough to affect the main part of near-wall streaks, causing the streaks to incline sinuously in the streamwise direction. The formation of the sinuous pattern is then accompanied by the energy transfer from
 $\overline {u'u'}$ to
 $\overline {w'w'}$ (Touber & Leschziner Reference Touber and Leschziner2012), resulting in the decline of
 $\overline {u'u'}$ and the elevation of
 $\overline {w'w'}$. Possibly due to the low amplitude, the streak inclination is not intense enough to induce a remarkable change in radial stress, whose physical interpretation is the near-wall downward or upward turbulent motions. Nevertheless, the sinuous streak pattern indeed lowers the magnitude of shear stress and achieves the drag reduction. For case 2, the thickness of the SSL is too small such that only a small fraction of the near-wall streaks is affected. In this way, there is no extensive streak inclination, and the SSL can be regarded as a thin shearing layer that lies between the wall and flow structures, affecting the near-wall splatting or anti-splatting, and leading to the decline of Reynolds shear stress. Within the SSL, the turbulence intensity is attenuated dramatically due to the strong crossflow shearing, and hence all Reynolds stresses decline accordingly.
(a) Wall-normal profiles of Reynolds normal stresses and shear stress. (b) Wall-normal profiles of the pressure-diffusion and pressure-strain terms in the transport equation of  $\overline {v'v'}$. Lines with squares indicate the pressure-diffusion term (
 $\partial (\overline {v'p'})/\partial r$); lines with circles indicate the pressure-strain term (
 $\overline {p'\partial v'/\partial r}$). Black lines indicate uncontrolled case; blue lines indicate case 8; red lines indicate case 2.

The different drag-reduction scenarios depicted above can be demonstrated preliminarily by examining the velocity–pressure gradient term in the transport equation of  $\overline {v'v'}$, as shown in figure 5(b). It is known that the velocity–pressure gradient term can be split into the pressure-diffusion (
 $\partial (\overline {v'p'})/\partial r$) and pressure-strain (
 $\overline {p'\,\partial v'/\partial r}$) fragments, which have opposite signs and virtually cancel each other near the wall. Below
 $y^+ \approx 10$, the pressure-diffusion term is positive, feeding energy into the radial normal stress and hence corresponding to the formation of ejection events (anti-splatting). In contrast, the pressure-strain term is negative, and its role is to drain energy from
 $\overline {v'v'}$ and redistribute it to the other two stress components through wall-normal splatting (downward sweep events; Mansour, Kim & Moin Reference Mansour, Kim and Moin1988; Eggels et al. Reference Eggels, Unger, Weiss, Westerweel, Adrian, Friedrich and Nieuwstadt1994). Interestingly, compared to the uncontrolled case, the magnitudes of these two terms are significantly attenuated below
 $y^+=10$ for case 2, especially at around
 $y^+=5$ where a local minimum can be observed, reflecting the considerably weakened splatting or anti-splatting. On the contrary, case 8 is similar to that of the uncontrolled case, and the magnitude increases within the viscous sublayer but decreases slightly in the region
 $5< y^+<10$. Such a significant difference between cases 2 and 8 clearly indicates the different flow states. Due to the streamwise non-homogeneity of the wall velocity, the
 $x$-derivative term in the continuity equation should be reserved:
 \begin{equation} \frac{{\partial \tilde{u}}}{{\partial x}} + \frac{{\partial r\tilde{v}}}{{r\,\partial r}} = 0, \end{equation}
which implies that  $\tilde {v}$ is non-zero within the SSL. Such weak wall-normal mean flow is probably the cause of the stronger splatting in the viscous sublayer for case 8.
To provide a more detailed physical interpretation of the velocity–pressure gradient terms discussed above, we examine the ensemble conditionally averaged flow fields in figure 6, with the samples being conditional on the detection of positive streamwise velocity fluctuations ( $u'^+>2$) at
 $y^+=10$. For a better representation of the flow pattern, we use magenta arrows to represent the flow motions conceptually. The conditionally sampled ensemble-averaged value of
 $f$ is denoted as
 $\bar {f}_{cond.}$, with
 $f$ being
 $p'$ or
 ${\rm d}v'/{\rm d}r$. The white arrows represent the in-plane velocity vectors, and the background contour gives
 $\overline {p'^+}_{cond.}$. For the uncontrolled case, the impingement of fluids on the wall forms a zone of high positive pressure where the pressure-strain term is negative (figure 5b), implying that
 $\overline {{\rm d}v'/{\rm d}r_{cond.}}$ is negative in this area. This is easily understood because the wall-normal velocity must decrease to let the fluids spread out in the wall-parallel plane. In the outer region (
 $y^+ \approx 20$), the pressure is negative, and the pressure-strain term is positive, indicating that
 $\overline {{\rm d}v'/{\rm d}r_{cond.}}$ is still negative. Thus the downward motion (splatting) is accompanied by the continuously decreasing velocity. For case 8, the velocity field is quite similar to that in the uncontrolled case, but the peak negative pressure is nearly three times larger. Given the fact that the positive peak value of the pressure-strain term at around
 $y^+ \approx 20$ in case 8 is only slightly larger than that in the uncontrolled case (figure 5b), it can be inferred that
 $\overline {{\rm d}v'/{\rm d}r_{cond.}}$ is also negative in this region but with a much smaller magnitude, which means that the decreasing rate of downward velocity is smaller, leading to a higher positive peak pressure near the wall. For case 2, the most striking feature is that the pressure at around
 $y^+ \approx 20$ is positive, indicating that
 $\overline {{\rm d}v'/{\rm d}r_{cond.}}$ is also positive in this region. Thus the fluids are in fact accelerating towards the wall, resulting in the significantly high value of positive pressure near the wall. It seems that the downward fluids do not feel the existence of the wall until they approach further. Hence only a small amount of fluids spreads out during the downward motion, and this explains why the pressure-strain term is markedly attenuated in case 2. The main spreading out happens in a small region within the SSL (below
 $y^+=5$). Moreover, as shown in figure 6(b), the spreading out of fluids is the weakest between the upper and lower magenta arrows, corresponding to the local minimum of the pressure-strain term in case 2.
Ensemble conditionally averaged flow fields, with the samples being conditional on the high-speed streaks ( $u'^+>2$) at
 $y^+=10$. The vectors give the in-plane stochastic velocity fields, and
 $s=r\theta$ is the arc length. The contour in the background gives the wall-normalized pressure fluctuations
 $\overline {p'^+}_{cond.}$. The magenta arrows depict qualitatively the direction of flow motion. The red curved lines mark the wall-normal location where
 $\tilde {w}$ drops below 1 % of the amplitude
 $A$. Note the different magnitudes in the colour bar. (a) Uncontrolled case; (b) case 2; (c) case 8.

The flow patterns described above might explain why the amount of drag reduction in case 2 is larger than in case 8. As demonstrated in figure 6(a), the velocity of downward moving fluids keeps decreasing in the uncontrolled case. More importantly, this process is accompanied by the energy transfer from wall-normal velocity to the other two velocity components, contributing to the formation of streamwise vortices that are responsible for the skin-friction drag. The decrease of the decreasing rate of downward velocity in case 8 implies a weakening of this energy transfer process and hence a weakening of streamwise vortices, leading to the lower degree of turbulent flow organization and the drag reduction. In case 2, the downward velocity even increases as the fluids approach the wall, indicating that such a weakening effect is further enhanced. Thus a larger amount of drag reduction is foreseeable.
4.2. Spatial Stokes layer
Based on the assumption that the thickness of the SSL is significantly small compared with the channel width, Viotti et al. (Reference Viotti, Quadrio and Luchini2009) derived an analytical solution of the spanwise velocity for laminar channel flow with spatial wall oscillation, whose accuracy is demonstrated by Skote (Reference Skote2013) in the flat turbulent boundary layer. For the boundary condition (2.1), the laminar solution reads
 \begin{equation} \tilde{w}(x,y) = \frac{A}{{\rm Ai(0)}}\,\mathrm{Re} \left[{\rm e}^{{\rm i}kx}\,{\rm Ai}\left( - {\rm i}\,\frac{y}{{{\delta _x}}}\,{{\rm e}^{ - ({{4{\rm \pi} }}/{3}){\rm i}}}\right)\right], \end{equation}
where  ${\rm Ai}$ is the Airy function of the first kind,
 $\mathrm {Re}$ denotes the real part, and the characteristic thickness of SSL can be written as
 \begin{equation} {\delta _x} = {\left(\frac{{{\lambda}{\nu ^2}}}{{2{\rm \pi} u_\tau ^2}}\right)^{{1}/{3}}}. \end{equation}
According to (3.3), one can derive the analytical form of the input power (Appendix A) as
 \begin{equation} {P_{in}} = 2{\rm \pi} RL\nu {\left. {\overline{\tilde{w}\,\frac{{\partial \tilde{w}}}{{\partial y}}} } \right|_{y = 0}} =\frac{{\sqrt 3 {\rm \pi}RL\nu {A^2}\,\rm{Ai}'(0)}}{{{2\,\rm{Ai}}(0)\,{\delta _x}}}. \end{equation}
We computed  $P_{in}$ using (4.4) for different cases, and the results are listed in table 2 and compared with those calculated from the turbulence DNS data. It is shown that
 $P_{in}$ in the laminar state is slightly higher, but the difference is within 3 %. This indicates that once the control parameters (
 $\lambda$ and
 $A$) are determined, we can estimate the input power using (4.4) regardless of the flow state, since (4.4) depends only on
 $\lambda$ and
 $A$ (if we assume that
 $R$,
 $L$ and
 $\nu$ are constant).
In cylindrical geometry, the curvature effect is an important factor that might influence the velocity profile ( $\tilde {w}$). However, it has been shown in Quadrio & Sibilla (Reference Quadrio and Sibilla2000) that a Stokes layer thickness
 $\delta ^+ \sim 35$ will induce negligible curvature effect, leading to excellent agreement between the laminar solution for a flat plate and turbulence results for a circular pipe with temporal wall oscillation. Thus it is interesting to evaluate the degree of closeness between the present turbulence DNS results and the laminar solution of (4.2).
The governing equation of  $\tilde {w}$ for a pipe follows from
 \begin{align} \underbrace{\tilde{v}\,\frac{{\partial \tilde{w}}}{{\partial r}} + \frac{{\tilde{v}\tilde{w}}}{r}}_{{1}} + \underbrace{\tilde{u}\,\frac{{\partial \tilde{w}}}{{\partial x}}}_{{2}} + \underbrace{\frac{{\partial \widetilde{v'w '}}}{{\partial r}} + \frac{{2\widetilde{v'w '}}}{r}}_{{3}} + \underbrace{\frac{{\partial \widetilde{u'w '}}}{{\partial x}}}_{{4}} = \underbrace{\nu \left(\frac{{{\partial ^2}\widetilde{{w }}}}{{\partial {r^2}}} + \frac{{{\partial ^2}\tilde{w}}}{{\partial {x^2}}} + \frac{1}{r}\,\frac{{\partial \tilde{w}}}{{\partial r}} - \frac{{\tilde{w}}}{{{r^2}}}\right)}_{{5}}. \end{align}
Term 1 is associated with the curvature effect since  $\tilde {v}$ is zero in a flat plate, while term 2 denotes the mean convection in the streamwise direction. The sum of terms 3 and 4 represents the turbulence modulation, and term 5 is the viscous term. Terms 1, 2 and 5 lead to the laminar solution for a circular pipe, which will turn into (4.2) if the curvature effect is negligible. Thus the deviation of DNS data from (4.2) results from the curvature effect and turbulence modulation, which can be estimated qualitatively by means of the following dimensional analysis.
According to figure 7, the thickness of the SSL  $\delta _x$ is less than 35, hence the curvature effect can be neglected such that term 1 is not considered. (Indeed, the magnitude of term 1 is examined to be orders of magnitude smaller than the other terms.) Therefore, the turbulence modulation is the only factor that affects the velocity profile of the turbulent SSL. The characteristic length in the streamwise direction can be taken as
 ${\lambda }$ due to the streamwise periodicity of (2.1), and the velocity scale of
 $\tilde {w}$ is
 $A$. As shown in Viotti et al. (Reference Viotti, Quadrio and Luchini2009), the thickness equation (4.3) provides a universal representation of scaling properties for the turbulent SSL. Hence
 $\delta _x$ is applicable for the wall-normal length scale. The mean streamwise velocity grows linearly along the wall-normal direction in the viscous sublayer, thus
 $\tilde {u}$ can be considered as the same order of magnitude within the SSL for all cases. Here,
 $\partial ^2 \tilde {w}/\partial x^2$ is negligible because
 ${\lambda }$ is significantly larger than
 $\delta _x$. As a consequence, we obtain
 \begin{equation} 2 \sim \frac{{\bar{u}A}}{\lambda},\quad 3 \sim \frac{{{\varepsilon _1}}}{{{\delta _x}}},\quad 4 \sim \frac{{{\varepsilon _2}}}{\lambda},\quad 5 \sim \frac{{\nu {A}}}{{\delta _x^2}}, \end{equation}
where  $\varepsilon _1$ and
 $\varepsilon _2$ characterize the magnitudes of
 $\widetilde {v'w '}$ and
 $\widetilde {u'w '}$, respectively. Term 2 is very important because it relates directly to the control parameters, and high amplitude together with low wavelength tends to yield a large value. As expected, for term 2, DNS data give order of magnitude
 $10^{-1}$ for case 2, and
 $10^{-2}$ for case 8, while for terms 3 and 4, the magnitudes of the Reynolds stresses in cases 2 and 8, shown in figure 8, both result in a turbulence modulation of order of magnitude of
 $10^{-2}$. Hence the turbulent velocity profile in case 2 should be closer to the laminar solution than in case 8 since the turbulence modulation is one order of magnitude smaller than term 2 in case 2, and this is demonstrated by figures 7(a,b), in which very good agreement between (4.2) and the present DNS data is found for case 2, while noticeable deviations can be observed for case 8. Moreover, large wavelength tends to induce a larger magnitude of Reynolds stresses
 $\widetilde {u'w'}$ and
 $\widetilde {v'w'}$, among which
 $\widetilde {u'w'}$ is significantly larger than
 $\widetilde {v'w'}$. However, the fact that
 $\lambda \gg \delta _x$ significantly diminishes the magnitude of term 4, making it act as the same order of magnitude as term 3 or even smaller according to (4.6a–d).
Wall-normal profiles of  $\tilde {w}$ at different phases: (a) case 2, (b) case 8.

Reynolds stresses  $\widetilde {u'w'}$ and
 $\widetilde {v'w'}$ at different phases
 $\varphi$, for (a) case 2, (b) case 8. Only half a wavelength (
 $\lambda$/2) is shown for brevity. Black lines indicate
 $\widetilde {u'w'}$; red lines indicate
 $\widetilde {v'w'}$.

4.3. One-dimensional spectra
Contours of streamwise premultiplied spectra of  $u'$ as a function of wall-normal position and wavelength are shown in figure 9. In consideration of the streamwise periodicity of the forcing signal (2.1), it is interesting to examine the relationship between control wavelength and the dominant wavelengths of flow structures. There are two kinds of contour map for each case, with figures 9(a,c,e) giving the absolute value of the spectrum, and figures 9(b,d, f) the spectrum normalized by the total resolved energy at the corresponding wall-normal position. In this way, we can identify not only the most energetic region in the total flow field, but also the dominant wavelengths of motions at different wall-normal positions. The respective control wavelengths are marked by black vertical lines.
Streamwise premultiplied spectra of streamwise velocity fluctuations. (a,c,e) The absolute value of  $k_x \phi _{uu}$ non-dimensionalized by
 $u_\tau$. (b,d, f) The spectra normalized by the total resolved energy at corresponding wall-normal position. The control wavelengths are marked by the vertical black lines. (a,b) Uncontrolled case; (c,d) case 2; (e, f) case 8.

For an uncontrolled pipe, the most energetic wavelength is of  $O(10^3)$ wall-units below
 $y^+ \approx 15$, which coincides with the commonly accepted length scale of near-wall flow structures. With control imposed, there is a broadening of the absolute energy peak in wavelength for case 2, with the wall-normal location moving outwards to
 $y^+ \approx 20$, as shown in figure 9(c). Note that
 $y^+=20$ is outside the SSL of case 2 (see figure 7a), hence such a broadening effect can be attributed to the increased mean velocity gradient in this region (figure 4a), which stretches the near-wall structures in the streamwise direction and allocates partial energy to the larger scale of motions. Interestingly, below
 $y^+ \approx 15$, the dominant wavelength is very close to the control wavelength, highlighting the close correspondence between the dominant scale of motion and control wavelength within the SSL. For case 8, the elevation of the wall-normal position of the absolute energy peak is attenuated compared with case 2, and the most energetic wavelength is reduced to approximately
 $\lambda ^+=400$. Similarly, the relative energy also peaks at around
 $\lambda ^+=300\unicode{x2013}400$ within the SSL (figure 9f), which is far smaller than the control wavelength
 $\lambda ^+=1695$. This implies that the streaks cannot maintain a full streamwise wavy pattern of such a long wavelength as
 $\lambda ^+=1695$, as will be discussed later in detail. In the central region, the energy distributions show great resemblance in the controlled and uncontrolled cases, for which the dominant wavelength is approximately
 $\lambda ^+=400\unicode{x2013}500$, indicating that the central region is unaffected by the SSL. Thus it can be summarized that for the low wavelength control (case 2), the dominant scale of motions is closely related to the control wavelength within the SSL, while for the large wavelength control (case 8), such correlation is rather weak, with the dominant scale of motions being far smaller than the control wavelength.
Figure 10 presents the circumferential premultiplied spectra of  $u'$ at wall-normal locations where
 $\overline {u'u'}$ reaches its maximum. All curves feature only one peak, indicating that there are no such outer very-large-scale motions that occur at sufficiently high Reynolds numbers. The peak wavelength corresponds to the average streak spacing, which is the well-known
 $\lambda ^+_\theta \approx 100$ in the uncontrolled case. In comparison, the streak spacing changes little in case 8, whereas in case 2, it increases to approximately
 $\lambda ^+_\theta =129$, which is comparable with that in Ricco & Wu (Reference Ricco and Wu2004) (
 $\lambda ^+_\theta =142.2$ for
 $T^+=67.5$ and
 $A^+=22.3$ at
 $y^+=5$).
Circumferential premultiplied spectra of streamwise velocity fluctuations at  $y^+=15$ for the uncontrolled case,
 $y^+=22$ for case 2, and
 $y^+=19$ for case 8.

4.4. Flow structures
In this subsection, we present the modification of near-wall low-speed streaks by the spatial wall oscillation. The streaks are displayed mainly in the form of contours of streamwise velocity fluctuations, which are constructed by unfolding the  $x$–
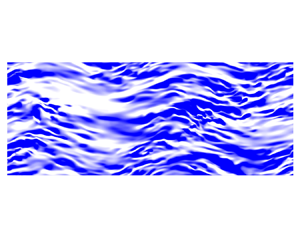
 $\theta$ plane at a specified wall-normal location. We also include the ‘spine’ plot of the low-speed streaks. The points along the ‘spine’ are extracted by taking the location of the local minimum of the negative streamwise velocity fluctuations at many streamwise locations (Dennis & Nickels Reference Dennis and Nickels2011), and consequently only the information of the streak length is preserved. Such a plotting manner allows us to examine qualitatively the change of the streamwise scale of low-speed streaks. The typical streak pattern and the ‘spine’ of low-speed streaks in the uncontrolled case are shown in figure 11.
Instantaneous field of streamwise velocity fluctuations  $u'$ at
 $y^+=10$ for the uncontrolled case, where
 $s=r\theta$ represents arc length. (a) Contour map of
 $u'$, in which the data range is set to
 $u'^+ \in [-2,2]$. White regions correspond to the velocity deficit, while blue regions denote the excess. (b) ‘Spine’ plot of the field in (a).

When control is imposed, the streamwise wavy pattern of low-speed streaks can be observed for case 2 at  $y^+=4$ (figure 12a). But the streaks are blurred, and the ‘spines’ are also fragmentized (figure 12c), indicating the strong attenuation of turbulence intensity within the SSL. At
 $y^+=22$, where the streamwise stress reaches its maximum, the streak pattern retains a straight orientation (figure 12b), which is similar to the uncontrolled case except for the larger streak spacing. As for case 8, similar wavy pattern can also be found at both
 $y^+=4$ and 10 but with a larger streamwise scale (figures 13a,b). The larger control wavelength produces a larger thickness of the SSL, hence expanding the wall-normal scope of wavy streaks. Compared with the uncontrolled case, the flow field seems to be occupied by shorter streaks (see figure 13c), which coincides with the spectra in figure 9( f) where the near-wall energy peak is located at a smaller wavelength. This suggests that the original long streaks are cut into several pieces by the streamwise-varying crossflow shearing.
Instantaneous field of streamwise velocity fluctuations  $u'$ at
 $y^+=4$ and 22 for case 2, where
 $s=r\theta$ represents arc length. (a,b) Contour maps of
 $u'$, in which the data range is set to
 $u'^+ \in [-2,2]$. White regions correspond to the velocity deficit, while blue regions denote the excess. (c,d) ‘Spine’ plots of the fields in (a,b).

Instantaneous field of streamwise velocity fluctuations  $u'$ at
 $y^+=4$ and 10 for case 8, where
 $s=r\theta$ represents arc length. Additional vectors at four phases, which are
 $x=0$,
 $\lambda /2$,
 $\lambda /4$,
 $3\lambda /4$ from left to right, are shown. Magenta arrows represent the local mean shear-strain vectors, and orange arrows correspond to the local mean velocity vectors. (a,b) Contour maps of
 $u'$, in which the data range is set to
 $u'^+ \in [-2,2]$. White regions correspond to the velocity deficit, while blue regions denote the excess. (c) ‘Spine’ plot of the field in (b).

A purely visual inspection of figure 13 seems to suggest that the streamwise wavy streaks conform to the wall velocity since the streak inclination is visually consistent with the graph of wall velocity shown in figure 1. But in fact, the mean circumferential velocity is a function of both the wall-normal and streamwise locations, and the generated strong shear forces also play an important role. Hence, following Touber & Leschziner (Reference Touber and Leschziner2012), the correspondence between the local mean shear-strain, local mean velocity and streak orientation is explored with the aid of two snapshots at different wall-normal positions from case 8. This choice is motivated by the fact that the distinct near-wall streaky structures in this case allow us to make unambiguous comparison. The directions of local mean shear-strain vectors (magenta arrows,  $[\partial \tilde {u}/\partial r,\partial \tilde {w}/\partial r+\partial \tilde {w}/\partial x]$) and mean velocity vectors (orange arrows,
 $[\tilde {u},\tilde {w}]$) at four phases, which are
 $x=0$,
 $\lambda /4$,
 $\lambda /2$,
 $3\lambda /4$ and cover a whole wavelength, are displayed in figure 13. The small plots on the right-hand side show the streamwise variation of angles of these two vectors over the pipe length. In particular, the angles at the above four phases are indicated by the circular symbols. In fact, the two components of mean shear-strain that are associated with
 $\tilde {w}$ can alternately possess the same direction or the opposite, but
 $\partial \tilde {w}/\partial x$ is usually one order of magnitude lower than
 $\partial \tilde {w}/\partial r$ due to the large difference of scale between
 $\lambda$ and
 $\delta _x$. Hence these two components are merged together.
At  $y^+=4$, the shear-strain and velocity vectors both point to a direction that forms an angle to the streak orientation when the wall velocity is zero (
 $x=0$,
 $\lambda /2$). On the contrary, when the wall velocity reaches its maximum (
 $x=\lambda /4$,
 $3\lambda /4$), their directions separate, among which the shear vector seems to be aligned with the streak orientation. Note that these vectors are representing the directions at a single streamwise location, hence it can be interpreted that the shear force twists the streak at an angle. This scenario also suits
 $y^+=10$, but the difference is that the shear-strain vectors change their directions at
 $x=0$ and
 $\lambda /2$, and are aligned with the streak orientation, while the mean velocity vectors do not. Such change results from the non-monotonic wall-normal variation of
 $\tilde {w}$ at these phases, as shown in figure 7(b). Overall, the mean shear-strain outside the viscous sublayer dominates the streak orientation, and there is a phase difference between the streak orientation and local mean velocity vector, which is broadly in line with Touber & Leschziner (Reference Touber and Leschziner2012). It is tempting to speculate that the streamwise-varying crossflow shearing disrupts the downstream development of near-wall flow structures, leading to the shortening of the streamwise scale of motions. Furthermore, the maximum angles of streak inclination, which are obtained from the shear-strain vector, are approximately 31
 $^\circ$ at
 $y^+=4$, and 25
 $^\circ$ at
 $y^+=10$. This is comparable to the data reported in Ricco (Reference Ricco2004) (27.1
 $^\circ$ for
 $T^+=167$ and
 $A^+=9.4$ at
 $y^+=5$) and Touber & Leschziner (Reference Touber and Leschziner2012) (approximately 33
 $^\circ$ for
 $T^+=200$ and
 $A^+=12$ at
 $y^+=10$).
5. Relaminarization
In this section, we focus on the relaminarization cases (cases 4 and 11) to investigate the transient dynamics during the relaminarization process, in an effort to explore the physical mechanism. Specifically, we aim to figure out what causes the relaminarization in turbulent pipe flow as no relaminarization occurs in a channel with the same flow conditions (Quadrio et al. Reference Quadrio, Ricco and Viotti2009; Viotti et al. Reference Viotti, Quadrio and Luchini2009). To this end, we additionally performed DNS of turbulent channel flow at  $Re_\tau =180$ with the control parameter the same as in case 4. Through the comparison between channel and pipe, we are able to gain some insights into the relaminarization mechanism.
5.1. Transient dynamics in the relaminarization process of case 11
Figure 14 presents the time evolution of streamwise mean velocity profile  $\bar {u}(r)$. Control is imposed at
 $t^+=0$. As expected, the profile evolves from an initial flat shape (black solid line) to the final parabolic shape (blue solid line) that matches well the analytical laminar Hagen–Poiseuille profile in a pipe, indicating a full relaminarization. Under the condition of CPG, the fully developed turbulent profile overlaps the laminar profile in the vicinity of the wall (
 $0.96< r/R <1$) (Marusic, Joseph & Mahesh Reference Marusic, Joseph and Mahesh2007). It is shown that
 $\bar {u}$ increases monotonically in the core region, while in the near-wall region (
 $0.85< r/R <1$), it decreases to its minimum at around
 $t^+=741$ and then rises slowly until the final laminar profile is reached (see the enlarged view in figure 14b). This leads to the same trend of wall shear stress
 $\nu \, \partial \bar {u}/\partial r |_{r=R}$, which can be linked to the variation of mass flow rate by the integrated streamwise momentum equation
 \begin{equation} \frac{\partial }{{\partial t}}\left(\int_0^R {\bar{u} } r\,{\rm d}r\right) ={-} \int_0^R \,{\frac{{{\rm d}p}}{{{\rm d} x}}}\,r\,{\rm d}r + \nu R{\left. {\frac{{\partial \bar{u} }}{{\partial r}}} \right|_{r=R}}. \end{equation}
In a statistically steady turbulent state,  $- \int _0^R\, ({{{{\rm d}p}}/{{{\rm d} x}}}) r\,{\rm d}r$ is positive and is cancelled out by the wall shear stress. Immediately after the control is imposed, the wall shear stress decreases, and the time derivative of mass flow rate (
 $\int _0^R {\bar {u}} r\,{\rm d}r$) must be positive to compensate the difference on the right-hand side of (5.1), leading to the increase of mass flow rate. Subsequently, the increasing of mass flow rate in turn increases the wall shear stress, and the increasing rate of mass flow rate decreases accordingly. Once the balance is reached, the new fully developed laminar state is established. Another implication is that the thickness of SSL increases initially and then decreases according to (4.3). Hence in figures 16(a), 17 and 18, we mark the largest SSL thickness (
 $y^+=32$) by a black vertical dashed line, which is calculated by finding the wall-normal location, from the wall to the centre, where
 $\vert \tilde {w} \vert$ decreases below 1 % of the velocity amplitude at
 $t^+=741$.
(a) Temporal evolution of  $\bar {u}(r)$ for case 11. (b) Enlarged view of the grey box in (a).

Figure 15 presents instantaneous snapshots at five instants during the relaminarization. Figures 15(a,c,e,g,i) show the instantaneous  $u$ contours of the same cross-section slice, while figures 15(b,d, f,h,j) present instantaneous streamwise velocity fluctuations at two cylindrical surfaces, i.e.
 $y^+=10$ and 36. These two wall-normal locations are chosen deliberately such that the smaller one is always located within the SSL while the larger one is outside the SSL.
Temporal evolution of instantaneous flow fields for case 11. Five instants are chosen for presentation. Control is imposed at  $t^+=0$. (a,c,e,g,i) Contours of instantaneous streamwise velocity
 $u$ at the same cross-sectional slice. (b,d, f,h,j) Contours of streamwise velocity fluctuation
 $u'$ at two cylindrical surfaces, i.e.
 $y^+=10$ and 36; the contours share the same colour legend.

Without control, several high-momentum flow structures, which extend from the core of the pipe towards the wall, together with the near-wall low-momentum fluids jigsawed along the azimuthal direction, can be observed clearly (figure 15a). When control is imposed, a time interval  $t^+=37$ is large enough to allow the near-wall streaks to response to the wall rotation. At this moment, streaks within the SSL incline sinuously while the outer streaks remain nearly straight (figure 15d). No remarkable change can be observed from the cross-sectional contour (figure 15c). At
 $t^+=185$, an annular layer with indistinguishable velocity fluctuations can be observed clearly near the wall (figure 15e), suggesting that the SSL seems to smear out the turbulent motions, and the flow within it becomes nearly laminar (figure 15f). Meanwhile, the annular SSL blocks the protrusion of high-momentum fluids towards the wall, and encloses the core turbulence. Also, the outer turbulence intensity is significantly attenuated (figure 15f). With time elapsing, the turbulence in the core region decays gradually (figures 15g,h), and finally the flow reaches a laminar state (figures 15i,j). Note that the formation of a laminar SSL occurs in a short time scale, while the relaxation of core turbulence requires a large amount of time. This is in consonance with figure 29(b), in which the global TKE falls exponentially at the beginning and then declines very slowly.
The above qualitatively described process can be quantified by examining the time evolution of TKE, as shown in figure 16(a). Indeed, the TKE in the near-wall region declines sharply at the initial stage ( $0< t^+ <278$), followed by the decay of core turbulence since its energy originates mainly from the diffusion process of turbulent activities in the buffer layer. At
 $t^+=278$, the TKE drops to nearly zero below
 $y^+=20$, and peaks at
 $y^+ \approx 40$. This period corresponds to the formation of a laminar SSL. After that, the peak TKE lingers for a while (
 $t^+=278\unicode{x2013}556$), and the TKE in the central region is further attenuated during this time interval. After this short lingering time, the overall TKE keeps declining, with the peak position moving towards the central region.
(a) Temporal evolution of TKE for case 11. (b) Time evolution of mean velocity gradient  $\partial \bar {u}/\partial r$ for case 11. The black vertical dashed line denotes the thickness of the SSL at
 $t^+=741$. The arrows represent an increase in time.

Obviously, two evolution stages can be identified roughly. The first is the formation of laminar SSL, and the second is the subsequent decay of outer turbulence. For the first stage, the mechanism that eliminates turbulence within the SSL can be attributed to the enhancement of turbulent dissipation ( $\varepsilon _k$). This mechanism has been explained by Ricco et al. (Reference Ricco, Ottonelli, Hasegawa and Quadrio2012): they concluded that the inclination of near-wall streaks enhances the turbulent enstrophy whose volume-integrated value equals the total turbulent dissipation. This is also valid for the present study and confirmed in figure 17(a). As seen, immediately after the control is imposed (
 $t^+=7$), the turbulent dissipation is enhanced at around
 $y^+=10$ where the near-wall streaks populate. After that, it declines rapidly. Note that during the first stage, the dissipation rate and production rate (
 $P_k$) of TKE both decline, but the ratio of production to dissipation quickly decreases below 1 across the whole radius (see figure 18a), suggesting the continuous decline of overall TKE.
Temporal evolution of the production (dashed lines) and dissipation (solid lines) rate in TKE budget for case 11. The arrows represent an increase in time. Black vertical dashed lines denote the thickness of the SSL at  $t^+=741$. (a) The first stage; (b) the second stage.

(a) Time evolution of the ratio of production to dissipation ( $P_k/\varepsilon _k$) for case 11. The black horizontal dashed line indicates
 $P_k/\varepsilon _k=1$. (b) Time evolution of the pressure diffusion (solid lines) and pressure strain term (dashed lines) in the
 $\overline {v'v'}$ budget for case 11. The arrows represent an increase in time. Black vertical dashed lines denote the thickness of the SSL at
 $t^+=741$.

As noted earlier, the formation of a laminar SSL is accompanied by the decline of wall shear stress. Due to the CPG constraint, the fluids in outer region accelerate, resulting in the substantial increase of velocity gradient in the buffer layer (figure 16b). Note that  $\tilde {w}$ is negligible outside the SSL, hence the only term that contributes to the TKE production is
 $\widetilde {u'v'}\,\partial \tilde {u}/ \partial r$. However, the increase of
 $\partial \tilde {u}/ \partial r$ cannot lead to the increase of TKE production. Instead, it declines continuously during the second stage (figure 17b), which implies that the shear stress
 $\widetilde {u'v'}$ declines more rapidly. The rapidly declined
 $\widetilde {u'v'}$ further indicates the sharply weakened wall-normal lift-up and splatting events, which can be assessed by examining the velocity–pressure gradient terms in the
 $\widetilde {v'v'}$ transport equation. As shown in figure 18(b), the splatting event weakens rapidly at the border of the SSL, despite the considerable increase of velocity gradient in that region. Moreover, according to figure 18(a), the ratio of production to dissipation keeps increasing and exceeds 1 in the region
 $30< y^+ <70$ during the time interval
 $t^+=278\unicode{x2013}556$, and the peak location matches well that of TKE. Hence it can be inferred that the increasing of
 $\partial \tilde {u}/ \partial r$ makes the production decline less rapidly than dissipation, leading to the lingering of peak TKE at that time interval.
So far, we have presented the transient dynamics during the relaminarization process in detail. However, the mechanism responsible for the continuous decay of turbulence after the formation of a laminar SSL is still unclear. Since the velocity gradient increases significantly, the intensity of turbulent motions is supposed to be strengthened rather than attenuated. To answer this question, we make a comparison between channel and pipe with the same control parameter of case 4 at  $Re_\tau =180$, and the results will be shown in the next subsection.
5.2. Comparison with channel flow
We performed DNS of turbulent channel flow at  $Re_\tau =180$ with the control parameter the same as in case 4, i.e.
 $(\lambda ^+,A^+)=(1695,12)$. For computational details, the reader can refer to Appendix C. Figure 19(a) compares the temporal evolution of global TKE and mass flow rate, as well as the integrated streamwise wall shear stress between channel and pipe. In a channel, as expected, the flow does not relaminarize in the end. Both the TKE and wall shear stress decline initially and reach a minimum, after which they bounce back to a level that overshoots the averaged value in the uncontrolled state, and then drop to its statistically steady value. The initial decline is consistent with Ricco et al. (Reference Ricco, Ottonelli, Hasegawa and Quadrio2012), in which the channel flow with temporal wall oscillation is investigated under the condition of CPG. Nevertheless, the subsequent overshoot is not reported in Ricco et al. (Reference Ricco, Ottonelli, Hasegawa and Quadrio2012). This may characterize the difference between temporal and spatial wall oscillation, which is, however, beyond the scope of this paper. According to (5.1), the overshoot of wall shear stress in channel flow leads to the transient decrease, albeit subtle, of mass flow rate, while in pipe flow, the mass flow rate increases smoothly with the decrease of increasing rate. Also, the mean velocity profile (figure 19b) exhibits a similar trend to the pipe flow, that is, in the vicinity of the wall, it decreases initially and then increases to the final value, leading to the continuously increasing velocity gradient in the buffer layer. Here, we focus on the transient behaviours before the new fully developed turbulence state is established, aiming to find why the flow does not relaminarize.
(a) Temporal evolution of the integrated wall shear stress (solid lines), global TKE (dashed lines) and mass flow rate (dash-dotted lines). Black lines indicate channel; red lines indicate pipe. All quantities are normalized by the average values of the uncontrolled case. (b) Time evolution of the streamwise mean velocity profile  $\bar {u}({y}^+)$ in a channel.

Similar to the pipe flow, first we examine the temporal evolution of flow field at a single cross-sectional slice in channel, shown in figure 20. Snapshots at six instants are chosen for examination. Moreover, in order to provide more detailed information, enlarged views of black boxes in figures 20 are presented in figure 21, superimposed with the vectors that denote the in-plane velocity. During the TKE-declined stage, the evolution of flow field in the channel is analogous with that in the pipe, which is characterized by the formation of a laminar SSL and the attenuation of outer turbulence activity. However, as time elapses, the turbulence outside the SSL will not decay completely. Instead, the downward motion of high-momentum fluids starts to penetrate into the laminar SSL (see figures 20c and 21a), which causes the local instability of the laminar SSL. As is evident in figures 20(d) and 21(b), in the unstable region, the vortices penetrate into the laminar SSL, and the strong transverse convection tilts the ejection and sweep events. Note that the velocity magnitudes (the lengths of vectors) in the unstable region are considerably larger than that in surrounding regions. Next, the local unstable region contaminates the surrounding laminar SSL (figure 20e), and eventually the whole SSL becomes turbulent (figure 20f). Hence the ascent stage of the wall shear stress in figure 19 can be considered as the contaminating stage. When the instability occurs, the intense generation of vortices increases the impact of fluids against the wall, resulting in the overshoot of wall shear stress. After the transient, the wall shear stress returns to its uncontrolled value due to the CPG.
Time evolution of instantaneous flow fields at a single cross-sectional slice in channel flow. Control is imposed at  $t^+=0$. The enlarged views of black boxes in (c,d) are shown in figure 21.

Enlarged views of black boxes in figures 20(c,d). The black arrows denote in-plane velocity vectors. The lengths of arrows qualitatively represent the magnitudes of local velocity.

Since the fluids convect downstream, the inspection on a fixed cross-sectional slice cannot exhibit the evolution of the total flow field. Hence we further present the time evolution of the instantaneous three-dimensional  $v$ contour in the
 $x$–
 $z$ plane at
 $y^+=10$, as shown in figure 22. The transition of the
 $v$ contour from a rugged surface, which represents the random upward and downward motions, to a smooth flat surface indicates clearly the formation of a laminar SSL. After that, local fluctuations occur, contaminating the surrounding laminar region, and in the meantime, it convects downstream and expands. In the local fluctuating region, the peaks of the
 $v$ contour are evidently larger, and the number of peaks also increases, corresponding to the transient overshoot of wall shear stress. Eventually, the whole SSL becomes turbulent and the streamwise wavy pattern can be observed clearly.
Time evolution of three-dimensional contours of instantaneous wall-normal velocity  $v$ at
 $y^+=10$ in the channel.

Figure 23 compares the temporal evolution of TKE between the channel and pipe flow. During the stage of the formation of a laminar SSL, the flow evolution in the channel is consistent with the pipe. But the crucial difference is that the laminar SSL in the channel will eventually be disturbed, while it remains stable in the pipe. This is reflected by the fact that TKE bounces back in the channel but decays completely in the pipe. Note that the velocity gradient also increases in the buffer layer of the channel, hence we infer that the increased velocity gradient enhances the turbulent motions outside the SSL, strengthening the impact of outer turbulence on the laminar SSL. Finally, the laminar SSL loses its stability when the magnitude of such an impact is beyond some certain threshold. This scenario can be confirmed simply by examining the temporal evolution of wall-normal stress  $\overline {v'v'}$, shown in figure 24, since
 $\widetilde {v'v'}$ dictates the production of
 $\widetilde {u'v'}$ and hence governs the production of TKE outside the SSL. As expected,
 $\overline {v'v'}$ is enhanced continuously after the laminar SSL is completely formed in the channel, which is opposite to that in the pipe where
 $\widetilde {v'v'}$ decreases rapidly. We believe that finding the origin of such a difference is crucial to understanding the physical mechanism that leads to the relaminarization in pipe flow.
Time evolution of TKE, in (a) the channel, (b) the pipe (case 4). The arrows represent an increase in time.

Time evolution of wall-normal stress  $\overline {v'v'}^+$, in (a) the channel, (b) the pipe (case 4). The arrows represent an increase in time. The time interval chosen for the channel corresponds to the initial stage of the TKE bounce-back. For the pipe, the time interval corresponds to the decay of outer turbulence.

5.3. Relaminarization mechanism
It is known, from previous sections, that the relaminarization in the pipe is closely related to the stability of an annular SSL, hence we proceed to find the mechanism by examining the energy flux that pertains to circumferential mean flow in the pipe. As shown in (3.2), the energy input eventually flows into two places: one is the mean dissipation that converts energy into heat, and the other is the energy exchange with TKE. In the  $\overline {w'w'}$ transport equation, the leftmost two terms in (3.2) appear as the production, which means that the Reynolds stress
 $\overline {w'w'}$ drains energy from the circumferential mean flow. Term
 $\wp$ is of great interest since it appears in the transport equations of both
 $\overline {w'w'}$ and
 $\overline {v'v'}$, which read: for the
 $\overline {v'v'}$ budget,
 \begin{equation} \frac{1}{2}\,\frac{{\partial \overline{v'v'} }}{{\partial t}} = {D_v} + {V_v} + {\varepsilon _v} + 2\underbrace{\frac{{\overline{\widetilde{v'w'}\tilde{w}} }}{r}}_{\wp}, \end{equation}
and for the  $\overline {w'w'}$ budget,
 \begin{equation} \frac{1}{2}\,\frac{{\partial \overline{w'w'} }}{{\partial t}} = {D_w} + {V_w} + {\varepsilon _w} + {P_w}-\underbrace{\frac{{\overline{\widetilde{v'w'}\tilde{w}} }}{r}}_{\wp}, \end{equation}
where the production rate  $P_w$ is
 \begin{equation} {P_w} ={-}\overline{\widetilde{v'w'}\,\frac{{\partial \tilde{w}}}{{\partial r}}} - \overline{\widetilde{u'w'}\,\frac{{\partial \tilde{w}}}{{\partial x}}}. \end{equation}
Equation (3.2) can be reorganized as
 \begin{equation} \frac{1}{2}\,\frac{{\partial \overline{\tilde{w}\tilde{w}} }}{{\partial t}} = {E_w} + {\phi _w} - {P_w} - \underbrace{\frac{{\overline{\widetilde{v'w'}\tilde{w}} }}{r}}_{\wp}. \end{equation}
In the above equations,  $D$ denotes the diffusion term,
 $V$ represents the velocity–pressure gradient term,
 $\varepsilon$ is the turbulent dissipation rate,
 $E$ is associated with the energy input, and
 $\phi$ corresponds to the mean dissipation rate. For a complete expression of the above equations, the reader can refer to Appendix D.
We first examine the role of term  $\wp$ in the
 $\overline {v'v'}$ budget (5.2). Obviously, only when the SSL is turbulent can the effect of term
 $\wp$ appear. Hence figure 25 presents the time evolution of terms 2
 $\wp$ and
 $\varepsilon _v$ for case 11 at the initial stage after the control is imposed. It can be observed that term 2
 $\wp$ acts as a sink term and is comparable to
 $\varepsilon _v$ in the near-wall region. As time elapses,
 $\varepsilon _v$ declines monotonically, while term 2
 $\wp$ increases initially and reaches its maximum at around
 $t^+=37$, after which it vanishes gradually, accompanied by the peak location moving away from the wall. Note that the signs of term
 $\wp$ in (5.3) and (5.5) are opposite to that in (5.2), which means that the role of term
 $\wp$ is draining energy from
 $\overline {v'v'}$ and redistributing equally to the circumferential mean flow and
 $\overline {w'w'}$. The latter part of the energy pertains to the inter-component exchange of TKE, while the portion of energy flowing into the circumferential mean flow is of great interest as it indicates a new path of energy exchange between the mean flow and turbulence. Thus, following the procedure introduced in Ricco et al. (Reference Ricco, Ottonelli, Hasegawa and Quadrio2012), the global energy balance in pipe flow can be summarized in figure 26. Note that the MKE (mean kinetic energy) that pertains to radial direction is omitted since
 $\tilde {v}$ is examined to be negligible compared with
 $\tilde {u}$ and
 $\tilde {w}$. The red arrow highlights the energy transfer from TKE-
 $v$ to MKE-
 $w$, namely the term
 $\wp$, that is absent in channel flow. It is worth mentioning that the global energy flux associated with term
 $\wp$ might be negligible when compared with the global TKE production or dissipation since term
 $\wp$ is effective only in the very near-wall region. But as shown in figure 25, term
 $\wp$ dominates the
 $\overline {v'v'}$ budget within the SSL, indicating that term
 $\wp$ plays a crucial role in the attenuation of
 $\overline {v'v'}$, which corresponds to the near-wall wall-normal turbulent motions (anti-splatting or splatting) and is crucial to the turbulence self-sustaining mechanisms.
Time evolution of  $\varepsilon _v^+$ (solid lines) and term 2
 $\wp ^+$ (dashed lines) for case 11 at the initial stage.

Energy box for controlled pipe flow:  $E$,
 $\phi$,
 $P$ and
 $\varepsilon$ denote the energy input, mean dissipation, turbulent production and turbulent dissipation, respectively. The subscripts denote the velocity components to which the energy pertains. The red arrow highlights the energy transfer from TKE-
 $v$ to MKE-
 $w$, namely the term
 $\wp$, which is absent in the channel.

Now we proceed to discuss the physical meaning of term  $\wp$. Here,
 $\tilde {w}/r$ is the local angular velocity, therefore the role of term
 $\wp$ can be interpreted as follows. Inside the SSL where the circumferential velocity is large enough, the interaction between the strong rotation and Reynolds stress
 $\widetilde {v'w'}$ continuously drains energy from wall-normal stress
 $\overline {v'v'}$ into the circumferential mean flow, leading to the continuous decline of
 $\overline {v'v'}$. The implication is that due to the term
 $\wp$, any wall-normal turbulent motions, specifically the wall-normal splatting and lift-up events, will be absorbed by the annular SSL in the pipe, disrupting the turbulence self-sustaining mechanisms. In other words, the annular laminar SSL is stable because it can continuously absorb energy from outer turbulence, leading to the decay of outer turbulence and the final relaminarization, whereas in the channel, the turbulence self-sustaining mechanism can be maintained since the spanwise mean flow cannot absorb energy from wall-normal stress. As the mass flow rate increases, the impact of outer turbulent motions on the laminar SSL is enhanced due to the continuously increasing velocity gradient. When the strength of such an impact increases beyond some certain threshold, the transition of flat laminar SSL to a turbulent state will be triggered, and the whole flow system becomes turbulent.
Next, we further demonstrate that the laminar SSL in the pipe is stable at  $Re_\tau =180$ if the control wavelength and velocity amplitude are both large enough. Case 11 is selected as the object. In the fully developed laminar state, we chose a single flow field and replaced the data in the region
 $0< r <0.35$ by the instantaneous velocity and pressure fields extracted from a single fully developed turbulent flow field. The
 $u$ contour of a cross-sectional slice of the composite flow field is shown in figure 27(a). Note that
 $r=0.35$ (
 $y^+=54$) is well beyond the SSL, and we take this composite flow field as the starting point for the subsequent simulation. We note that this approach has been employed in Wu et al. (Reference Wu, Moin, Adrian and Baltzer2015) to study the gradual transition from laminar to fully developed turbulence in pipe flow. The purpose of this simulation is to verify whether the laminar SSL is stable to such intense perturbations.
DNS of case 11 with intense perturbations imposed at the initial fully developed laminar field. (a) Initialcomposite flow field. (b) Instantaneous flow field at  $t^+=44$ when the laminar SSL becomes turbulent. (c) Instantaneous flow field at
 $t^+=500$ where the turbulence is decaying. (d) Temporal evolution of instantaneous streamwise velocity at
 $y^+=11,36,180$. (e) Temporal evolution of TKE.

The time evolutions of instantaneous streamwise velocity at different wall-normal positions and TKE are shown in figures 27(d) and 27(e), respectively, together with the instantaneous  $u$ contour of a single cross-sectional slice at three instants shown in figures 27(a–c). At the beginning, the sudden variation of streamwise velocity at
 $r=0.35$ causes the intense transient turbulence burst. The TKE increases dramatically in this region, reaching the maximum at
 $t^+=7\unicode{x2013}15$. After that, the laminar SSL is disturbed, which is reflected by the rapid growth of TKE below
 $y^+=40$ and the strong fluctuations of streamwise velocity at
 $y^+=11$. This is also confirmed visually by the snapshot at
 $t^+=44$ in figure 27(b). Besides, the disruption of laminar SSL is accompanied by the relaxation of outer turbulence after the transient burst. At around
 $t^+=30$, the TKE inside the SSL reaches the maximum, suggesting the complete disruption of the laminar state. Surprisingly, however, as time elapses, the strong velocity fluctuations decay gradually and the velocity in the central region rises smoothly. The wall-normal profile of TKE at
 $t^+=148$ indicates clearly that the flow returns back to the laminar state. This result is interesting as it demonstrates the stability of laminar SSL in the pipe at this Reynolds number. Even such a high magnitude of perturbations can only temporarily disturb the laminar SSL, and eventually the system will return to the laminar state. The implication is that, from the perspective of system dynamics, the laminar state is probably the only fixed point for case 11. We also conducted the same simulation using the control parameter of case 4. The result shows that the flow also experiences transient chaos and returns back to the laminar state, which is hence not shown here. Again, we examined the time evolution of 2
 $\wp$,
 $\varepsilon _v$ in the
 $\overline {v'v'}$ budget and
 $\overline {v'v'}$ itself at
 $y^+=7$ during the transient burst, shown in figure 28. As expected, term 2
 $\wp$ is comparable to
 $\varepsilon _v$, contributing to the attenuation of
 $\overline {v'v'}$. Also, the increase in term 2
 $\wp$ is accompanied by the increasing of
 $\overline {v'v'}$, indicating that the effect of term
 $\wp$ is self-adapting; that is, the larger
 $\overline {v'v'}$, the more energy absorbed by circumferential mean flow, which in turn results in the decline of
 $\overline {v'v'}$.
Time evolution of  $\varepsilon _v^+$, 2
 $\wp ^+$ and
 $\overline {v'v'}$ at
 $y^+=7$ during the transient in the DNS of case 11, in which the initial flow field is imposed with intense perturbations. Note that the magnitude of
 $\overline {v'v'}^+$ is divided by factor 10.

Although we claim that the annular SSL can absorb energy from wall-normal stress, it is hard to find distinguishable change if we examine the time evolution of global energy that pertains to circumferential mean flow because the energy of wall-normal stress is too small compared with the circumferential mean flow. Hence we reiterate here that term  $\wp$ contributes dominantly to the attenuation of wall-normal stress within the SSL, leading to the subsequent decay of turbulence. After highlighting the importance of term
 $\wp$, it is easy to understand why it requires both large control wavelength and velocity amplitude to relaminarize the turbulence in pipe flow. Term
 $\wp$ is the product of Reynolds stress
 $\widetilde {v'w'}$ and angular velocity. As already shown in figure 8, large control wavelength corresponds to large thickness of the SSL, hence producing large values of Reynolds stress
 $\widetilde {v'w'}$. On the other hand, large velocity amplitude generates large angular velocity. If any one of these two conditions is not satisfied, then the effect of term
 $\wp$ will be negligible and the flow cannot be relaminarized. Another issue is about the effect of the Reynolds number. The above conclusions are drawn in the context of low Reynolds number
 $Re_\tau =180$; whether they still hold at high Reynolds numbers remains unclear. At high Reynolds numbers, the modulation of near-wall turbulence by the outer large-scale motions would undoubtedly influence the control result. Moreover, the streaks in channel flow are stronger than in the pipe for the same
 $Re_\tau$. The significant difference between channel and pipe exhibited in the present study could vanish rapidly as the Reynolds number increases.
6. Summary
In this study, we have examined the effect of streamwise-varying wall rotation on turbulent pipe flow by DNS at Reynolds number  $Re_\tau =180$. Two control parameters, velocity amplitude and wavelength, are considered. When one of the control parameters is small enough, the flow remains turbulent and drag reduction is achieved. When the two control parameters are both large enough, the flow relaminarizes, which does not occur in channel flow with the same flow conditions. Such a significant difference suggests the important role of geometry when employing this wall-motion-based control strategy. In terms of energetic performance, high amplitude tends to increase the power input and hence reduces the net energy saving rate. Positive net energy saving is achievable when the wavelength is large and the amplitude is small. An examination of effectiveness reveals that increasing the wavelength is probably more effective than increasing the amplitude in achieving the power saving.
The transverse boundary layer, called spatial Stokes layer (SSL), significantly affects the control result. For non-relaminarization cases, two drag-reduction scenarios can be identified based on the thickness of the SSL. In the case of low thickness, only a small fraction of near-wall streaks are affected, hence the SSL acts as a spacer layer lying between the wall and near-wall flow structures, inhibiting the formation of streamwise vortices and thereby reducing the shear stress. An inspection of one-dimensional spectra reveals that the flow structures outside the SSL are stretched due to the increased mean velocity gradient. Within the SSL, the strong crossflow shearing significantly diminishes the turbulence intensity, and the dominant wavelength of motions is closely related to the control wavelength. When the thickness is large enough to cover the main part of the flow structures, the streaks are inclined sinuously in the streamwise direction, forming a wavy pattern and followed by a energy transfer from streamwise stress to circumferential stress. However, the dominant wavelength of motions is significantly smaller than the control wavelength, and even smaller than that in uncontrolled case. Such a shortening effect is believed to disrupt the downstream development of flow structures, leading to a low degree of turbulence organization and low shear stress. Moreover, there is a phase difference between the streak orientation and local mean velocity vector as the former is determined by the local mean shear-strain vector outside the viscous sublayer.
The discrepancy between the phase-averaged turbulent velocity profile and the laminar analytical solution is closely related to the control parameters. With the aid of dimensional analysis, it is shown that high amplitude together with low wavelength tends to increase the magnitude of the mean convection term, to which the turbulence modulation can be comparatively small, thereby leading to the small discrepancy. On the contrary, large wavelength and low amplitude tend to generate a large discrepancy.
The relaminarization process in a pipe can be divided into two stages. The first is the formation of a laminar SSL, which is caused by the enhancement of turbulent dissipation as discussed in Ricco et al. (Reference Ricco, Ottonelli, Hasegawa and Quadrio2012), accompanied by the sharp decline of wall shear stress and turbulence intensity. Due to the constant pressure gradient (CPG), the streamwise mean flow accelerates and the mean velocity gradient ( $\partial \bar {u}/\partial r$) increases in the buffer layer. The second stage is the decay of turbulence outside the laminar SSL. This stage is characterized by the continuously declined TKE production despite the increasing of
 $\partial \bar {u}/\partial r$. However, the ratio of TKE production to dissipation temporarily exceeds 1 in the buffer layer, leading to the temporary lingering of peak TKE. For channel flow with the same flow conditions, the first stage is the same as pipe flow, whereas after the complete formation of the laminar SSL, the outside TKE bounces back rather than completely decaying. This is the crucial difference between channel and pipe. During the TKE bounce-back stage, the laminar SSL is disrupted locally at the beginning, and then the perturbations gradually contaminate the surrounding laminar region. Finally, the whole laminar SSL loses its stability and the flow re-establishes itself in a new fully developed state. It is found that due to the increased
 $\partial \bar {u}/\partial r$, the impact of outer turbulence on the laminar SSL is gradually enhanced, which causes the local instability.
By examining the energy flux that pertains to circumferential mean flow in a pipe, it is found that due to the rotation effect, part of the energy that pertains to wall-normal velocity fluctuations is continuously absorbed by circumferential mean flow, which is believed to be the root cause of the continuous decay of outer turbulence since the wall-normal turbulent motion plays a crucial role in the turbulence self-sustaining mechanism. This process is self-adapting, i.e. the larger the turbulence intensity, the more energy absorbed by the circumferential mean flow, while in the channel, such an effect is absent since no rotation effect exists in flat plane geometry. Hence we conclude that the laminar SSL in a pipe is stable at the Reynolds number considered in the present study as it can continuously absorb energy from outer turbulence. This is confirmed by additional simulations where we manually impose disturbances of great strength to the laminar SSL. The fact that the laminar SSL undergoes transient chaos and returns to the laminar state strongly demonstrates our conclusion.
Funding
The authors gratefully acknowledge the financial support by the National Natural Science Foundation of China (nos 11772193, 42076210, 52122110, 61875123) and the National Youth Science Foundation of China (no. 52101322).
Declaration of interests
The authors report no conflict of interest.
Appendix A. Analytical formula of input power  $P_{in}$

Using (4.2), we have
 \begin{align} {P_{in}} &= 2{\rm \pi} RL\nu {\left. {\overline{\tilde{w}\,\frac{{\partial \tilde{w}}}{{\partial y}}} } \right|_{y = 0}}\nonumber\\ &= 2{\rm \pi} RL\nu \times \overline{\frac{A}{{\rm Ai(0)}}\,\mathrm{Re} [{{\rm e}^{{\rm i}kx}}\,{\rm Ai}(0)] \times \frac{A}{{{\rm Ai}(0)}}\,\mathrm{Re} \left[ - \frac{{\rm i}}{{{\delta _x}}}\,{{\rm e}^{(kx - ({4}/{3}){\rm \pi} ){\rm i}}}\,{\rm Ai}'(0)\right]}\nonumber\\ &= 2{\rm \pi} RL\nu \times \overline{A\cos (kx) \times \frac{{A \times {\rm Ai}'(0)}}{{{\rm Ai}(0)\,{\delta _x}}}\sin \left(kx - \frac{4}{3}{\rm \pi} \right)}\nonumber\\ &=\frac{{2{\rm \pi} RL\nu {A^2}\,{\rm{Ai'(0)}}}}{{{\rm{Ai}}(0)\,{\delta _x}}}\left(\frac{{\sqrt 3 }}{4} + \frac{1}{2}\,\overline{\sin \left(2kx - \frac{4}{3}{\rm \pi} \right)} \right)\nonumber\\ &=\frac{{\sqrt 3 {\rm \pi}RL\nu {A^2}\,\rm{Ai}'(0)}}{{{2\,\rm{Ai}}(0)\,{\delta _x}}}. \end{align}
Appendix B. Validation for pipe flow simulations
Figure 29(a) shows the Reynolds normal stresses in comparison with that from a previous pipe flow database (Eggels et al. Reference Eggels, Unger, Weiss, Westerweel, Adrian, Friedrich and Nieuwstadt1994; Wu & Moin Reference Wu and Moin2008). Good agreement can be found for all statistics, including the dissipation rate of streamwise Reynolds stress, demonstrating the reliability of the present simulation of fully developed turbulent pipe flow.
(a) Turbulence statistics in comparison with those in previous literature. The dissipation rate of streamwise stress is scaled by  $u_\tau ^3/D$ and further divided by a factor of 36. (b) Time evolution of global TKE during the relaminarization process for different meshes. The values of global TKE are normalized by the average value of the uncontrolled case. The baseline mesh is
 $P=11$,
 $N_z=192$. For the other four meshes, only one parameter (either
 $P$ or
 $N_z$) is varied with respect to the baseline mesh. The black dashed line represents the TKE evolution with a different initial field. The inset displays an exponential fit to the TKE evolution data.

On the other hand, in order to verify that the relaminarization is a physically relevant process rather than the consequence of insufficient mesh resolution, case 11 is chosen for an additional check because  $A^+=30$ is the maximum velocity amplitude employed in the present study. The success of mesh independence validation of this extreme case allows us to be confident with the results for other relaminarization cases. Since the relaminarization is a gradual process (Sreenivasan Reference Sreenivasan1982) and it takes extremely long time for the flow to transform from turbulent state to fully developed laminar state, it is reasonable that relaminarization occurs when the global turbulent kinetic energy (TKE) decreases to zero (Lieu, Moarref & Jovanović Reference Lieu, Moarref and Jovanović2010). Figure 29(b) shows the time evolution of global TKE for case 11. Except for the baseline simulation, results from four additional meshes, in which either the order of the shape function (
 $P-1$) or the number of Fourier planes (
 $N_z$) is varied with respect to the baseline mesh, are also included. The overlap of all TKE evolution curves indicates that the present mesh is adequate and the relaminarization is indeed a physical process. Moreover, the complete flow excursion of relaminarization is calculated only for the baseline mesh due to the extremely long computing time. No instability occurs, and the flow indeed reaches the final laminar state. We also changed the initial flow field at which control is imposed, and relaminarization also occurs with the same trend, indicating independence from initial conditions.
Appendix C. Details for channel flow simulations
The channel flow DNS at  $Re_\tau =180$ are performed in a Cartesian coordinate system using the spectral element-Fourier DNS solver Semtex (Blackburn & Sherwin Reference Blackburn and Sherwin2004; Blackburn et al. Reference Blackburn, Lee, Albrecht and Singh2019). The simulations are conducted under the condition of CPG, and
 $x,y,z$ represent the streamwise, wall-normal and spanwise directions, respectively. The two-dimensional spectral element meshes, shown in figure 30, are deployed to discretize the
 $x$–
 $y$ plane, with 288 (
 $N_z$) Fourier planes in the
 $z$ direction to represent the three-dimensional computational domain. The element height follows a geometric degression from the centreline to the wall. A 10th-order nodal shape function is employed, i.e.
 $P=11$. The resulting grid resolutions are
 $(\Delta x^+, \Delta y^+_{min/max}, \Delta z^+)=(8.5,0.42\unicode{x2013}3.9,5.9)$, covering a channel section 6
 ${\rm \pi} h \times 3{\rm \pi} h \times 2h$, where
 $h$ is the half-channel height. Such grid resolutions yield total computational nodes of approximately
 $3.1\times 10^7$, which is a little less than that in Quadrio et al. (Reference Quadrio, Ricco and Viotti2009) and Viotti et al. (Reference Viotti, Quadrio and Luchini2009). To ensure that the differences between channel and pipe are caused only by the geometry, the friction velocity
 $u_\tau$ and kinematic viscosity
 $\nu$ are set to be equal to the pipe flow. Similarly, a single flow field at fully developed turbulent state is chosen as the starting point for the subsequent simulation with spatial wall oscillation.
Two-dimensional spectral element meshes for channel flow simulations, with 880 elements in the  $x$–
 $y$ plane.

The calculated drag-reduction value for channel flow with the control parameters ( $\lambda ^+,A^+)=(1695,12)$ (the same as case 4) is 38.2 %. As shown in figure 3, this result is lower than the drag-reduction curve reported by Viotti et al. (Reference Viotti, Quadrio and Luchini2009) in which the channel flow DNS are conducted under the condition of constant flow rate (CFR). Such a difference is reasonable as Quadrio & Ricco (Reference Quadrio and Ricco2011) showed that the drag reduction for CPG is lower than that for CFR with these control parameters. Besides, the very good agreement between the present result for an uncontrolled channel and that in Kim et al. (Reference Kim, Moin and Moser1987) indicates the adequacy of the present mesh to simulate the fully developed turbulence in the channel (figure 31a). We also simulated the transient behaviour of controlled channel flow with different mesh resolutions (i.e. changing the value of
 $P$ and
 $N_z$) to ensure the mesh independence. As shown in figure 31(b), the initial decline, the subsequent bounce-back and the overshoot of wall shear stress occurs in all simulations, indicating that such behaviour is authentic and physically relevant. Moreover, the discrepancy of the bounce-back stage for different meshes suggests that the contamination of the laminar SSL is sensitive to the grid resolution.
Validation of channel flow simulations. (a) Reynolds normal stresses in comparison with that in Kim, Moin & Moser (Reference Kim, Moin and Moser1987) (denoted as KMM). (b) Time evolution of integrated wall shear stress during the transient in the channel for different meshes. The values of wall shear stress are normalized by the average value of the uncontrolled case. The baseline mesh is  $P=11$,
 $N_z=288$. For the other three meshes, only one parameter (either
 $P$ or
 $N_z$) is varied with respect to the baseline mesh.

Appendix D. Reynolds stress transport equations in a pipe
Here we present the  $\widetilde {v'v'}$ and
 $\widetilde {w'w'}$ transport equation in full detail. The mean convection term (
 $M$) disappears after spatial average due to the streamwise periodicity of the forcing signal (2.1).
For the  $\widetilde {v'v'}$ budget:
 $$\begin{align} &\frac{1}{2}\,\frac{\partial \widetilde{v'v'}}{\partial t}=\underbrace{-\frac{{\partial r\,\widetilde{v'v'v'} }}{{2r\,\partial r}}-\frac{{\partial \widetilde{v'v'u'} }}{2\,{\partial x}}+\frac{{\widetilde{v'w'w'} }}{r}+ \frac{1}{2}\,\nu \left( {{\nabla^2}\widetilde{v'v'}} + \frac{{2\left( {\widetilde{w'w'} - \widetilde{v'v'} } \right)}}{{{r^2}}} \right)}_{D_v}\nonumber\\ &\qquad\underbrace{{}-\frac{1}{2}\,\tilde{u}\,\frac{{\partial \widetilde{v'v'} }}{{\partial x}}}_{{M_v}} \underbrace{{}-\widetilde{{v'}\,\frac{{\partial p'}}{{\partial r}}}}_{{V_v}} \underbrace{{}-\nu \left[ {\widetilde{{{\left( {\frac{{\partial v'}}{{\partial z}}} \right)}^2}} + \widetilde{{{\left( {\frac{{\partial v'}}{{\partial r}}} \right)}^2}} + \frac{1}{{{r^2}}}\widetilde{{{\left( {\frac{{\partial v'}}{{\partial \theta }} - w'} \right)}^2}} } \right]}_{{\varepsilon_v}} + 2\underbrace{\frac{{\widetilde{v'w'}\,\widetilde{w} }}{r}}_{{\wp}}. \end{align}$$
For the  $\widetilde {w'w'}$ budget:
 \begin{align} &\frac{1}{2}\,\frac{\partial \widetilde{w'w'}}{\partial t}=\underbrace{-\frac{{\partial r\,\widetilde{w'w'v'} }}{{2r\,\partial r}}-\frac{{\widetilde{w'w'v'} }}{r}-\frac{{\partial \widetilde{w'w'u'} }}{{\partial x}}+\frac{1}{2}\,\nu \left( {{\nabla^2}\widetilde{w'w'}- \frac{{2\left( {\widetilde{w'w'} - \widetilde{v'v'} } \right)}}{{{r^2}}}} \right)}_{\text{$D_w$}}\nonumber\\ &\qquad \underbrace{{}-\frac{1}{2}\,\tilde{u}\,\frac{{\partial \widetilde{w'w'} }}{{\partial x}}}_{\text{$M_w$}} \underbrace{{}-\widetilde{v'w'}\,\frac{{\partial \widetilde{{w }} }}{{\partial r}} - \widetilde{u'w'}\,\frac{{\partial \widetilde{w} }}{{\partial x}} -\frac{{\widetilde{v'w'}\, \widetilde{w} }}{r}}_{\text{$P_w$}}\nonumber\\ &\qquad \underbrace{{}-\frac{{\widetilde{v'p'} }}{r} + \frac{1}{r}\,p'\widetilde{\left( {\frac{{\partial w'}}{{\partial \theta }} + v'} \right)}}_{\text{$V_w$}} \underbrace{{}-\nu\left[ {\widetilde{{{\left( {\frac{{\partial w'}}{{\partial x}}} \right)}^2}} + \widetilde{{{\left( {\frac{{\partial w'}}{{\partial r}}} \right)}^2}} + \frac{1}{{{r^2}}}\widetilde{{{\left( {\frac{{\partial w'}}{{\partial \theta }} + v'} \right)}^2}}} \right]}_{\text{$\varepsilon_w$}}. \end{align}



