





1. Introduction
The ASTRI Mini-Array represents a significant step forward in ground-based gamma-ray astronomy, consisting of multiple small-sized telescopes operating in a distributed configuration. Designed as a precursor to the larger Cherenkov Telescope Array , the ASTRI Mini-Array serves as both a technological pathfinder and a scientific instrument in its own right. Its architecture enables high-throughput, multi-telescope observations, but also introduces challenges in maintaining system reliability, ensuring data integrity, and supporting uninterrupted operations across geographically dispersed components. Given the volume and velocity of telemetry generated by such distributed systems, robust monitoring, logging, and fault-detection mechanisms are essential for operational continuity. These tools must handle complex telemetry streams, enable real-time analytics, and support early detection of anomalies to reduce downtime and optimize performance. To address these needs, we introduced ServiMon , a scalable, Docker-based data collection and monitoring pipeline specifically designed for complex environments like the ASTRI Mini-Array. ServiMon integrates cloud-native technologies-including Prometheus , Grafana , Loki , Promtail , Cassandra , and Kafka -to deliver real-time system monitoring, interactive visualization, and intelligent fault detection. This paper presents ServiMons architecture and implementation, showing how it can enhance system reliability and scalability while laying the foundation for predictive maintenance in next-generation astronomical infrastructures.
2. System Architecture and Core Technologies
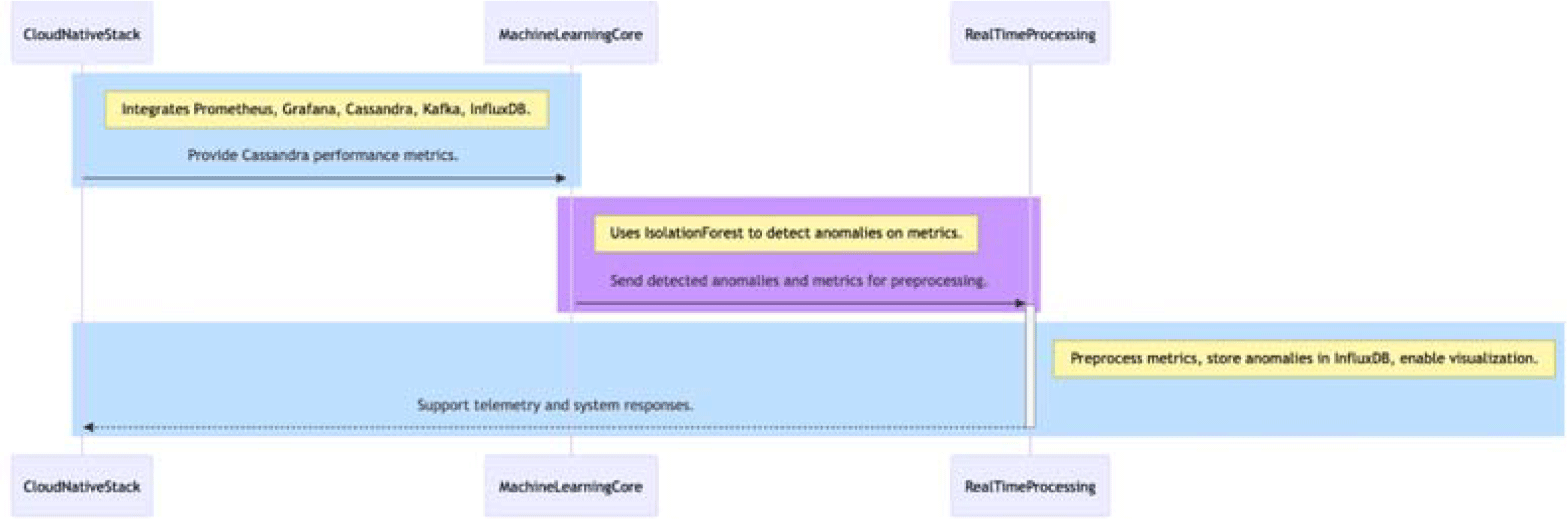
ServiMon is built upon three foundational pillars: a Cloud-Native Stack, a Machine Learning Core, and Real-Time Processing capabilities. From the cloud-native perspective, ServiMon integrates technologies such as Prometheus, Grafana, Cassandra, Kafka, and InfluxDB to enable comprehensive telemetry collection and scalable data processing across distributed astronomical infrastructures. The Machine Learning Core leverages the Isolation Forest algorithm to detect anomalies in Cassandra performance metrics, continuously monitoring key indicators such as read/write latency, throughput, and memory usage, all captured as time-series data. In terms of real-time processing, performance metrics are preprocessed for feature engineering, with detected anomalies stored in InfluxDB v2 and accessed via Flux queries to support immediate visualization and system-level responses. The sequence diagram in Figure1 reports the interaction among the three blocks.
Three blocks interaction.

3. Data Flow and System Integration
The ServiMon architecture establishes a streamlined data flow for efficient metric collection, storage, and visualization. The process begins with the metric exposure phase, where the storage container makes Prometheus-style metrics available at the endpoint <monospace>1235/metrics</monospace>, enabling continuous monitoring access. In the data collection stage, a Telegraf container retrieves these metrics over HTTP using the <monospace>inputs.prometheus</monospace> plugin, ensuring seamless integration with the monitoring pipeline. During storage processing, Telegraf forwards the collected metrics to the <monospace>cassandra_metrics</monospace> bucket in InfluxDB 2.x via the <monospace>outputs.influxdb_v2</monospace> plugin. Finally, in the visualization access phase, InfluxDB stores the time-series data, which can be queried and visualized through Grafana dashboards, supporting real-time system monitoring and analysis. Figure2 (a) shows the complete data flow.
System overview and ML anomaly detection results.

4. Machine Learning Model Implementation
The implemented machine learning model is structured to support predictive maintenance for Cassandra by analyzing real-time telemetry data. Its architecture comprises two distinct modules: a Training Module and an Inference Module which operate independently. The Training Module periodically acquires historical telemetry data from InfluxDB, preprocesses it through a defined feature engineering pipeline (including scaling, feature selection, and NaN handling), and trains the model-typically an Isolation Forest-while optimizing hyperparameters. The resulting pipeline, including preprocessing and model, is saved in a portable format (e.g., .pkl). This process is initially manual but becomes automated for subsequent retraining cycles using updated data. In contrast, the Inference Module functions in an event-driven manner, typically executing hourly. It loads the most recent model version, queries real-time Cassandra and JVM metrics from Prometheus or InfluxDB, and applies the trained pipeline to detect anomalies. The inference results are then written back to InfluxDB along with their corresponding timestamps. This modular design ensures scalable, maintainable, and timely detection of system anomalies for proactive maintenance.
5. Testing and Results
Two distinct test phases were conducted to evaluate the system: one for model training and another for validating the inference and alert generation mechanism.
With regards to the training phase, the baseline telemetry was generated using four <monospace>opcuasimulatormon</monospace> container instances, simulating 998 monitoring points over a 24-hour period. To introduce variability, two stress sessions were injected using the home-made <monospace>cassandra-traffic</monospace> container, each lasting 15 minutes and simulating fault events at approximately 2% frequency. The resulting dataset, exhibiting a typical imbalance found in real-world systems, was split 60/30 into training and test sets. These were used for preprocessing, feature engineering, and training the Isolation Forest model. As shown in Figure2 (b), the model successfully identified known anomalies within the test set, demonstrating its capability to detect abnormal behavior in a predominantly normal signal stream.
For inference validation, a 10-minute stress simulation was launched using <monospace>cassandra-traffic</monospace>, applying a model previously trained on two weeks of normal telemetry. The inference module, running in event-driven mode, successfully detected injected anomalies, as evidenced by its internal logs and the anomaly entries recorded in InfluxDB. Figure3 confirms this behavior, showing both log traces (Fig.4) and stored anomalies accessible via the databases Web UI.
Anomalies shown in the browser.

Anomaly detection on log files.

6. Conclusion
Originally developed to provide a monitoring system for astrophysical applications, ServiMon has been enhanced with an additional module focused on predictive maintenance. This work has presented the basic architecture of ServiMon, detailing the machine learning module introduced and highlighting the overall system design as well as the main interactions among its components. Preliminary tests and results demonstrate the validity of the proposed approach and the potential of the system. Future developments include the integration of alternative algorithms to Isolation Forest-selected in this phase for its execution speed and ease of implementation-within the predictive maintenance module, as well as the use of real-world data to evaluate the systems functionality and performance.
7. Acknowledgment
This work is supported by ICSC - Centro Nazionale di Ricerca in High Performance Computing, Big Data and Quantum Computing, funded by the European Union - NextGenerationEU.


 Open access

