Obesity is a multifactorial, chronic disease characterised by excessive body fat accumulation(Reference Busetto, Dicker and Frühbeck1). The risk of all-cause mortality increases substantially with rising BMI and nearly doubles in severe obesity (BMI > 40 kg/m2) compared with grade I obesity (BMI 30–35 kg/m2)(Reference Burgess, Sun and Zhou2,Reference Di Angelantonio, Bhupathiraju and Wormser3) , emphasising the need for effective treatment strategies. Although surgical and pharmacological approaches are effective, uncertainty remains regarding their cost-effectiveness and large-scale applicability in public health settings(Reference Mital and Nguyen4,Reference Jacobsen, Boyers and Manson5) . In clinical practice, nutritional interventions are commonly used preoperatively(Reference Simancas-Racines, Reytor-González and Parise-Vasco6) and combined with pharmacological treatment(Reference Mozaffarian, Agarwal and Aggarwal7) to reduce complications and enhance treatment outcomes. Therefore, dietary interventions remain essential components of multidisciplinary weight-management strategies, even in severe obesity.
Although still a recommended dietary strategy for weight loss(Reference Mechanick, Apovian and Brethauer8–10), energy restriction (ER) often results in less than expected weight loss as well as long-term weight regain(Reference Casanova, Beaulieu and Finlayson11). Identifying alternative approaches to overcome recognised metabolic adaptations – such as the reduction in resting metabolic rate (RMR) that hinders sustained weight loss(Reference Martins, Roekenes and Gower12–Reference Müller, Enderle and Bosy-Westphal14) – is highly desirable. Time-restricted eating (TRE) is defined as an eating pattern restricted to an eating window of up to 10 h/day(Reference Koppold, Breinlinger and Hanslian15). When combined with ER, TRE has been proposed to enhance weight and fat mass (FM) loss compared with continuous ER, although with a low-quality level of evidence(Reference Sun, Tan and He16–Reference Garegnani, Oltra and Ivaldi19). Furthermore, TRE does not appear to have greater effects than continuous ER on lipid and glycaemic profiles(Reference Sun, Tan and He16–Reference Garegnani, Oltra and Ivaldi19). Its effects on other energy-related metabolic responses (e.g. RMR) remain unclear.
It is not clear whether TRE confers additional benefits on weight loss, body composition and metabolic outcomes in individuals with severe obesity, a subgroup that has been largely underrepresented in previous clinical trials(Reference Garegnani, Oltra and Ivaldi19). We hypothesised that TRE + ER would promote greater weight loss compared with continuous ER. The primary objective of this 12-wk clinical trial was to evaluate the effects of TRE combined with ER (TRE + ER) on weight loss and body composition changes in individuals with severe obesity. Secondary objectives were to assess the effects of TRE + ER on hormones related to energy homeostasis and on lipid and glycaemic profiles. In addition, we explored the baseline determinants of weight change after intervention.
Methods
Study design and population
This is a randomised and controlled parallel clinical trial (metabolic adaptation during caloric restriction in obesity – MACRO) that includes two groups of individuals with severe obesity exposed to the following dietary strategies for weight loss: continuous energy restriction (CER) and ER diet combined with TRE (TRE + ER). The trial was registered in the Brazilian Registry of Clinical Trials (RBR-45fpgqh). This paper is reported following the Consolidated Standards of Reporting Trials (CONSORT)(Reference Hopewell, Chan and Collins20). The study protocol was approved by the Institutional Ethics Committee (Hospital Universitário Pedro Ernesto/UERJ, no 7.075.010). All participants read and signed the informed consent form to participate in the study.
Adults (20–60 years old) with severe obesity (BMI ≥ 40 kg/m2) were eligible. Detailed inclusion and exclusion criteria have been described previously(Reference de Moraes Campos, Brasil and Bezerra21). Briefly, participants were excluded if they were pregnant or lactating, had severe infectious, oncologic, endocrine or organ diseases, had undergone bariatric surgery, had lost >10 % body weight in the previous 6 months or were using medications known to affect body weight or energy metabolism.
The primary outcome measure in MACRO is a 12-wk change in body weight. On the basis of published data (sd of the between-group difference in weight loss = 2·4 kg)(Reference Peeke, Greenway and Billes22), it was estimated that fifty-eight participants (twenty-nine per group) would be sufficient to detect a significant difference of 2 kg in weight variation between groups with the assumption of a 95 % CI and 80 % power. Predicting a potentially high dropout rate (35 %),(Reference Moroshko, Brennan and O’Brien23) we adjusted the minimum sample size to 78 participants. We were able to randomise 100 individuals.
Participants were recruited through social media and posters. Eligible individuals attended a pre-study visit at the Nutrition Clinic for Outpatient Care at the Piquet Carneiro Policlinic of State University of Rio de Janeiro (UERJ), where they completed an interview on socioeconomic, general health, eating habits and anthropometric data. Participants were scheduled for their baseline visit at the Nutritional Assessment Laboratory to begin the study.
Participants were randomly assigned in a 1:1 ratio to the CER or TRE + ER groups, based on the order of participants’ entry into the study, using block randomisation (blocks of four) via the platform https://www.randomizer.org. Allocation concealment was maintained until the baseline laboratory visit. Due to the nature of the intervention, neither the researchers nor the participants were blinded. Throughout the 12 wk of the study, participants attended five laboratory visits for data collection (baseline and after 1, 5, 9, and 12 wk), as shown in supplemental material Figure S1.
Nutritional intervention
The prescription was provided at baseline and adjusted considering the measured RMR at each visit to maintain a 60 % restriction of total energy expenditure (TEE)(Reference Ebbeling, Feldman and Klein24).
The dietary prescription aimed to provide a normoprotein (0·8 to 1·0 g/kg/d), normoglycidic (50–60 % of energy), and normolipidic (25 to 30 % of energy) diet using Webdiet software (© 2024 WebDiet Health Manager). Participants in the TRE + ER group were instructed to follow an 8-hour eating window (10 am–6 pm), while those in the CER group were instructed to maintain their usual meal schedule. Dietary choices were tailored to each participant’s eating habits. Equivalent food substitutions were provided as needed to enhance adherence. Additionally, weekly motivational messages and practical guidance were delivered via a messaging application. Participants could contact the dietitians throughout the study for diet-related queries.
ER adherence at each time point was assessed by calculating the difference between the actual and expected daily energy lost (kcal). The expected daily energy loss was defined as daily TEE minus prescribed energy intake. Considering the immediately preceding time point, changes in fat-free mass (FFM) and FM (from DXA) were converted to actual daily energy loss as follows:
-
if FFM decreased:
Actual daily energy loss (kcal) = [(9.3 × ΔFM(g)) + ((1.1 × -ΔFFM(g))/days of ER)];
-
if FFM increased:
Actual daily energy loss (kcal) = [(9.3 × ΔFM (g)) + (1.8 × ΔFFM (g))/days of ER].
Negative values indicated a smaller-than-expected weight loss, based on the ER prescribed. ER adherence was expressed as a percentage(Reference Martins, Roekenes and Gower12,Reference Del Corral, Chandler-Laney and Casazza25) .
Compliance with the eating window and ER adherence were monitored using energy intake and reported meal timing from 24-hour dietary recalls, using the Multiple Pass Method(Reference Conway, Ingwersen and Vinyard26). Actual energy intake at baseline was estimated using the Multiple Source Method (MSM)(Reference Harttig, Haubrock and Knüppel27) based on two 24-hour dietary recalls collected at recruitment and at the baseline visit, representing usual intake before the intervention. At subsequent assessments, actual energy intake was estimated using the MSM from two 24-hour dietary recalls collected every two wks within each interval between laboratory visits. The difference between actual and prescribed energy intake was calculated using the actual energy intake estimated for each interval and the energy prescription provided at the immediately preceding visit.
Study assessments and procedures
At each visit, participants were instructed to attend the lab for data collection after fasting for 10–16 h overnight. Additionally, they were instructed to avoid (24 h) smoking, alcohol, vigorous exercise, and ensure 6–8 h sleep before measurements. A questionnaire was administered to confirm adherence to this protocol. RMR, body composition, blood samples, and subjective appetite ratings data were collected at the Nutritional Assessment Laboratory (Institute of Nutrition, UERJ).
Energy expenditure
RMR was measured in all study time points by indirect calorimetry (Vmax Encore 29, Sensormedics, Palm Springs, CA) under standardised conditions, as previously described(Reference de Moraes Campos, Brasil and Bezerra21). Participants rested for 15 min before starting the measurement. After flow and gas calibration, the volume of oxygen consumed (VO2) and carbon dioxide produced (VCO2) were measured for at least 15 min, or until steady state was achieved (coefficient variations for VO2 and VCO2 < 10 % for ≥ 5 min). The first 5 min were excluded from the calculations. Energy expenditure (kcal/d) was calculated using Weir’s equation (1949)(Reference de Weir28).
Physical activity energy expenditure was estimated at baseline using the International Physical Activity Questionnaire data and categorised according to physical activity factor (PAF) criteria proposed by the IOM (2005)(29): PAF 1·0–1·4 (inactive/irregularly active B), 1·4–1·6 (irregularly active A), 1·6–1·9 (active), and 1·9–2·5 (very active). TEE was calculated using the factorial method, by multiplying measured RMR and PAF. Participants were instructed not to modify their physical activity patterns during the study period.
As previously suggested(Reference Nunes, Jesus and Francisco30), predicted RMR (RMRp) was calculated using an equation based on baseline participant data of the present study:
RMRp(kcal/d) = [(16·2 × FFM (kg)) + (0·04 × FM (kg)) – (3·35 × AGE (years)) – (43·4 × sex) + 764·2]
Sex (Women = 1, Men = 0), R 2 adjusted = 0·58; P < 0·001.
Adaptive thermogenesis was calculated by the difference between measured RMR (RMRm) and predicted RMR(RMRp): [(RMRm – RMRp (intervention))] – [RMRm – RMRp (baseline)](Reference Nunes, Jesus and Francisco30). Negative values indicate a reduction in RMR disproportionate to changes in body composition.
Body composition
Body composition was assessed at all study time points using dual-energy X-ray absorptiometry (DXA; Lunar iDXA, EnCore 2008 software version 12.20, GE Healthcare, WI) by trained professionals supervised by a certified clinical densitometrist. Half-body analysis of the right side was performed using the mirror-imaging tool to estimate total body measurements. FFM and FM were obtained, with FM also expressed relative to body mass (%FM). Visceral adipose tissue was obtained from the android region using CoreScan VAT software.
Hormonal and biochemical profile
Blood samples were collected after an overnight fast, by a qualified professional, at baseline, 1 and 12 wk. Serum concentrations of total GLP-1, leptin, total ghrelin and adiponectin were measured by ELISA using commercial kits (Merck Millipore) at the Laboratory of Pathophysiology and Biochemistry of Nutrition (UERJ). Samples from the same participant were analysed on the same assay batch to minimise variability. Intra-and inter-assay coefficients of variation were <7 % and <10 %, respectively. Lipid and glycaemic profile (baseline and at 12 wk) and insulin concentrations were measured at the Clinic Analysis Laboratory (Cápsula/UERJ) using an automated platform.
Subjective appetite ratings
Subjective appetite ratings were assessed at baseline, 1 and 12 wk. Participants rated their desire to eat, hunger, satiety and prospective food consumption using four 10 cm visual analogue scales without tick marks. Participants completed the scales before, immediately after and 60 min after consuming the same standardised breakfast (bread, cheese and orange juice; 300 kcal: 17·4 % protein, 28·3 % fat, 54·3 % carbohydrate), representing on average 20 % of the prescribed energy(Reference Buckland, Camidge and Croden31). Total AUC for subjective appetite ratings was calculated at each time point (baseline, 1 and 12 wk) using the trapezoidal rule across fasting, postprandial and 60 min postprandial measurements. An appetite score was also calculated at each time point for fasting, immediately postprandial and 60 min after postprandial, using the formula: [hunger + desire to eat + prospective food consumption + (10 – satiety)]/4(Reference Anderson, Catherine and Woodend32).
Statistical analyses
Data were analysed using the intention-to-treat approach, including all randomised participants in their originally assigned groups. Summary measures of outcomes and covariates of interest were expressed as median and interquartile range or mean and standard deviation (sd). Between-group comparisons at baseline were evaluated using the Mann–Whitney U test for continuous variables and the χ 2 test for categorical variables. The effect of time and group × time interaction on anthropometry, body composition, RMR, adaptive thermogenesis, hormonal concentrations, appetite feelings, glucose and lipid profiles was analysed using linear mixed-effects models (PROC MIXED – SAS® Studio), which incorporate all available data. All models were fitted using random intercepts at the individual level, assuming an unstructured covariance pattern. For variables with more than two time points, a quadratic term (group × time2) was used if both the quadratic time term and the interaction were significant in the model. In these cases, time was centred to avoid collinearity. Profile analysis was conducted to assess changes in outcomes at each time point. The effect size for each outcome was defined as the between-diet difference in within-group changes from baseline to 12 wk (ΔTRE + ER − ΔCER), with mean estimates and 95 % CI derived from the linear mixed-effects models. An additional analysis with completers was conducted to explore the baseline determinants of weight and FM change (dependent variables) after 12 wk. The independent variables (potential exposures or confounders) to be included in the analysis were first identified using a directed acyclic graph (DAG) (Supplemental Material Figure S2). The identified baseline variables (age, TEE, body composition, HOMA-IR, hormonal profile and energy intake) were subsequently selected using the least absolute shrinkage and selection operator with 10-fold cross-validation. Two penalty parameters were considered: lambda 1-se (λ1 se), representing a more parsimonious model, and lambda minimum (λmin), representing the model with minimum cross-validated error(Reference Friedman, Hastie and Tibshirani33). Variables retained at each λ were then entered into separate multivariable linear regression models to estimate coefficients (β) and P values. Models were adjusted for adherence at 12 wk, intervention group and early adaptive thermogenesis (at 1 wk). Additionally, an exploratory linear mixed-effects model with participant-specific random intercepts was performed among completers to investigate whether longitudinal variations in total energy expenditure, energy intake, hormonal profile, adherence and adaptive thermogenesis throughout the intervention were associated with changes in weight and FM. Time and intervention group were included as fixed effects.
Results
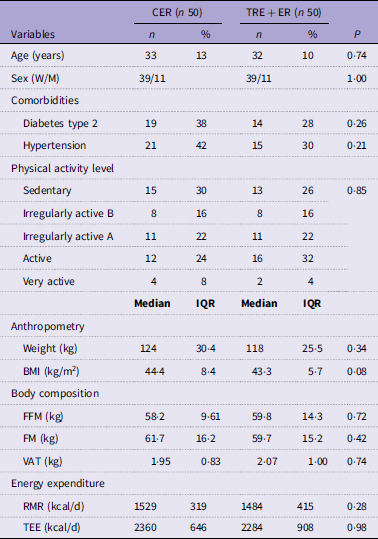
Between 3 August 2022 and 31 July 2024, 100 participants were randomised into CER (n 50) and TRE + ER (n 50) groups (Figure 1). Participants in both groups were about 32 years old, with an equal sex distribution. No significant between-group differences were observed at baseline for physical activity levels, anthropometry, body composition or energy expenditure (Table 1).
CONSORT diagram of the intervention.

Characteristics of participants at baseline – MACRO study*

Table 1. Long description
A table comparing characteristics of participants in two groups at baseline. The table has 23 rows and 7 columns. Column headers are Variables, CER (n 50) n, CER (n 50) %, TRE + ER (n 50) n, TRE + ER (n 50) %, and P. Row labels include Age (years), Sex (W/M), Comorbidities (Diabetes type 2, Hypertension), Physical activity level (Sedentary, Irregularly active B, Irregularly active A, Active, Very active), Anthropometry (Weight (kg), BMI (kg per square meter)), Body composition (FFM (kg), FM (kg), VAT (kg)), and Energy expenditure (RMR (kilocalories per day), TEE (kilocalories per day)). Each row provides data for both groups, including counts, percentages, medians, and interquartile ranges. Notable trends include similar distributions of age, sex, comorbidities, physical activity levels, anthropometry, body composition, and energy expenditure between the two groups.
CER, continuous energy restriction; TRE + ER, time-restricted eating combined with energy restriction; W, women; M, men; FFM, fat-free mass; FM, fat mass; VAT, visceral adipose tissue. RMR, resting metabolic rate; TEE, total energy expenditure. Physical activity level determined by International Physical Activity Questionnaire.
* Values are n (%) for categorical variables; median (IQR) for continuous variables. P values represent between-group comparisons at baseline using the Mann–Whitney U test for continuous variables and the χ 2 test for categorical variables.
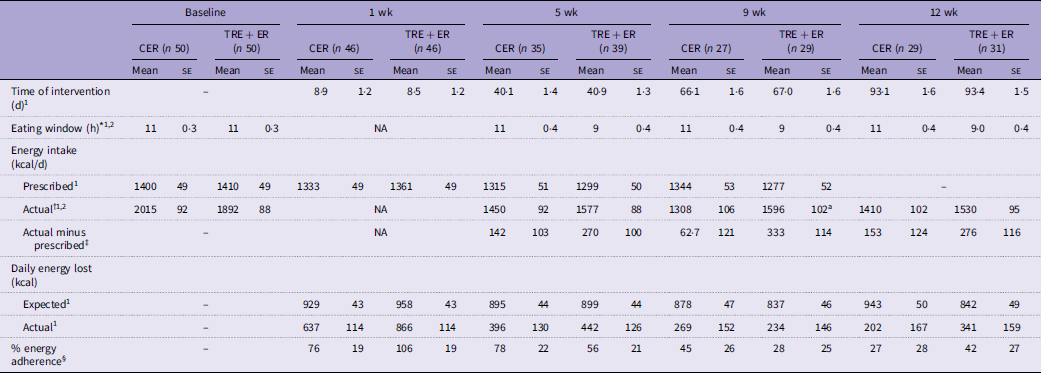
At baseline, the mean eating window was approximately 11 h in both groups (Table 2), and only nine participants (CER n = 6) reported an eating window shorter than 8 h. As expected, during the study, the eating window was significantly shorter in the TRE + ER compared with CER group (group × time interaction, P < 0·001). The intervention lasted approximately 93 days in both groups. There was a significant time effect on prescribed and actual energy intake and on expected and actual daily energy loss (P < 0·01). There was no group × time interaction effect on percentage adherence (P = 0·530) or on the difference between actual and prescribed energy intake (P = 0·568, Table 2).
Intervention details during the 12 wk of energy restriction – MACRO study

Table 2. Long description
The table presents data on energy restriction interventions over 12 weeks, comparing two groups: CER and TRE + ER. It includes measurements at baseline, 1 week, 5 weeks, 9 weeks, and 12 weeks. The table has 10 rows and 12 columns. Column headers include Time of intervention, Eating window, Energy intake, Actual, Actual minus prescribed, Daily energy lost, Expected, Actual, and % energy adherence. Row labels include Baseline, 1 wk, 5 wk, 9 wk, and 12 wk. Each row provides mean and standard error values for various metrics such as time of intervention, eating window, prescribed and actual energy intake, daily energy loss, and percentage adherence. Notable trends include a significant difference in the eating window between the CER and TRE + ER groups over time, with the TRE + ER group having a shorter eating window. There are also significant time effects on prescribed and actual energy intake and on expected and actual daily energy loss. The table does not show a significant group-time interaction effect on percentage adherence or the difference between actual and prescribed energy intake.
CER, continuous energy restriction; TRE + ER, time-restricted eating combined with energy restriction; NA, not available (due to study design). Time (1) and group × time (2) effect were obtained using linear mixed model.
a Significant difference between groups at each time point by Bonferroni post hoc test.
* Obtained from 24-h dietary recalls.
† Estimated energy intake using the MSM method based on two 24-h dietary recalls.
‡ Actual minus prescribed energy intake was calculated as the difference between actual energy intake estimated for each interval and the energy prescription provided at the immediately preceding study visit.
§ % energy adherence is the percentage relative to the expected daily energy lost (kcal).
After 12 wk of intervention, both groups showed reductions in weight, FM and VAT, with no significant change in FFM over time (Figure 2). No significant group × time interaction was observed for weight (–4·3 ± 0·4 kg v. –3·8 ± 0·4 kg; group × time P = 0·464, Figure 2A) or VAT change (–270 ± 4 g v. –188 ± 4 g; group × time P = 0·24, Figure 2B). There was a significant group × time interaction for FM, with greater decreases over time in the TRE + ER group (–3·5 ± 0·32 kg v. –2·4 ± 0·34 kg; group × time P = 0·040, Figure 2C).
Effect of time-restricted eating with energy restriction in ∆ weight (A), ∆ visceral adipose tissue (B) ∆ fat mass (C), and ∆ fat-free mass (D) in individuals with severe obesity. Time and group × time interaction and estimated means were derived by linear mixed model. Between-diet difference: difference between within-group changes from baseline to 12 wk (ΔTRE + ER − ΔCER) derived from linear mixed-effects models. TRE + ER: Baseline, n 49; 1 wk, n 45; 5 wk, n 38; 9 wk, n 29; 12wk, n 31. CER: Baseline, n 49; 1wk, n 45; 5 wk, n 34; 9 wk, n 27; 12 wk, n 25. *Different from baseline. TRE + ER, time-restricted eating combined with energy restriction; CER, continuous energy restriction.

Significant time effects were observed for RMR changes from baseline (P < 0·001; Figure 3A) and for adaptive thermogenesis (P < 0·001; Figure 3B). A significant group × time interaction was observed for changes in RMR from baseline (P = 0·032) and approached significance for adaptive thermogenesis (P = 0·061). In the TRE + ER group, the decrease in RMR from baseline was −22 ± 16 kcal/d at 1 wk and −133 ± 25 kcal/d at 12 wk and was accompanied by a trend towards a more pronounced adaptive thermogenesis (from-15 ± 16 at 1 wk to-121 ± 24 kcal/d at 12 wk).
Effect of time-restricted eating with energy restriction in ∆RMR (A) and adaptive thermogenesis (RMRm – RMRp) (B) in individuals with severe obesity. Time and group × time interaction and estimated means were derived by linear mixed model. Between-diet difference: difference between within-group changes from baseline to week 12 (ΔTRE + ER − ΔCER) derived from linear mixed-effects models. TRE + ER: Baseline, n 50; 1wk, n 46; 5wk, n 38; 9wk, n 29; 12wk, n 28. CER: Baseline, n 50; 1wk, n 46; 5wk, n 35; 9wk, n 27; 12wk, n 29. *Different from baseline. TRE + ER, time-restricted eating combined with energy restriction; CER, continuous energy restriction.

Figure 3. Long description
Two line graphs depict changes in RMR and adaptive thermogenesis over weeks of intervention. Panel A: The line graph shows the change in resting metabolic rate (RMR) in kilocalories per day over 12 weeks of intervention. The x-axis represents the weeks of intervention, ranging from 0 to 12. The y-axis represents the change in RMR, ranging from 0 to -200 kilocalories per day. The graph includes four lines: raw mean TRE+ER, estimated mean TRE+ER, raw mean CER, and estimated mean CER. The lines show a general downward trend, indicating a decrease in RMR over time. Significant differences from baseline are marked with asterisks. Panel B: The line graph shows adaptive thermogenesis in kilocalories over 12 weeks of intervention. The x-axis represents the weeks of intervention, ranging from 0 to 12. The y-axis represents adaptive thermogenesis, ranging from 0 to -200 kilocalories. The graph includes four lines: raw mean TRE+ER, estimated mean TRE+ER, raw mean CER, and estimated mean CER. The lines also show a general downward trend, indicating a decrease in adaptive thermogenesis over time. Significant differences from baseline are marked with asterisks.
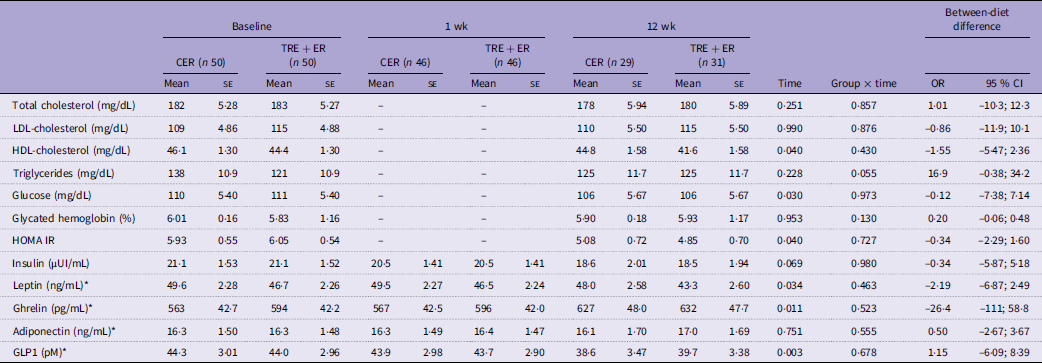
Serum HDL-cholesterol, glucose and HOMA-IR decreased from baseline to 12 wk (time effect, P < 0·05; Table 3). Leptin and GLP-1 concentrations also decreased over time (time-effect, P = 0·034 and P = 0·003, respectively; Table 3), whereas insulin showed a non-significant decline (P = 0·069). In contrast, ghrelin concentrations increased over time (time effect, P = 0·011), while adiponectin concentrations remained unchanged. No group × time interactions were observed for hormones or lipid and glycaemic profiles, except for serum TAG that tended to decrease only in the CER group (P = 0·055). No significant between-diet differences were observed at 12 wk for any lipid, glycaemic or hormonal profile (Table 3). Appetite scores and the AUC of appetite feelings did not change over time, except for prospective food consumption, which decreased overtime (time effect, P = 0·016). No group × time interaction was found for subjective appetite ratings (Supplemental Material, Table S1).
Effect of time-restricted eating combined with energy restriction during 12 wk on lipid, glycaemic and hormonal profile in adults with severe obesity – MACRO study

Table 3. Long description
The table presents data on various lipid, glycaemic, and hormonal profiles measured at baseline, 1 week, and 12 weeks for two groups: CER and TRE + ER. The table has 13 rows and 18 columns, including headers and footers. Each row represents a different variable, such as total cholesterol, LDL-cholesterol, HDL-cholesterol, triglycerides, glucose, glycated hemoglobin, HOMA IR, insulin, leptin, ghrelin, adiponectin, GLP1, and between-diet difference. Each column represents different time points and groups, with mean values and standard errors provided for each measurement. Notable trends include decreases in serum HDL-cholesterol, glucose, and HOMA-IR from baseline to 12 weeks. Leptin and GLP-1 concentrations also decreased over time, while ghrelin concentrations increased. Insulin showed a non-significant decline, and adiponectin concentrations remained unchanged. No significant between-diet differences were observed at 12 weeks for any of the measured profiles.
Values are absolute estimated mean ± se by linear mixed model.
CER, continuous energy restriction; TRE + ER, time-restricted eating combined with energy restriction; HOMA IR, homeostatic model assessment for insulin resistance; GLP1, glucagon-like peptide 1.
P values for time and group × time interaction were derived by linear mixed model. Between-diet difference: difference between within-group changes from baseline to 12 wk (ΔTRE + ER − ΔCER) derived from linear mixed-effects models. (–) not collected at 1 wk. *A quadratic effect of time was included in the model.
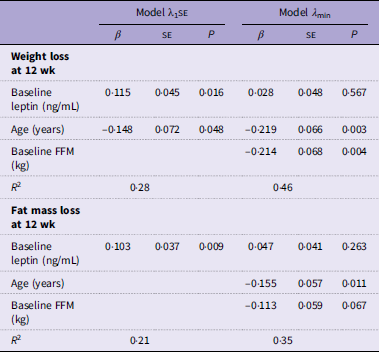
Among completers (n 60), we explored baseline factors associated with 12-wk changes in body weight and FM. Models were adjusted for adaptive thermogenesis at 1 wk, adherence to the energy prescription and intervention group (Table 4 and Table S2). Applying least absolute shrinkage and selection operator procedure, baseline age, leptin concentrations and FFM explained 46 % and 35 % of the variability in body weight change and FM loss, respectively, after 12 wk (Table 4). In an additional exploratory longitudinal analysis, we examined weight and FM changes associations with energy metabolism, energy intake, hormonal profile and adherence throughout the 12-week intervention (Table S3). Decreases in leptin concentrations and greater adherence over time were associated with greater weight and FM loss, whereas higher adaptive thermogenesis was associated with smaller weight and FM loss.
Regression models using LASSO procedure for baseline determinants of weight and fat mass loss (12 wk – baseline) in completers (n 60) – MACRO study

Table 4. Long description
A table comparing regression models for weight and fat mass loss determinants. The table has two main sections: Weight loss at 12 wk and Fat mass loss at 12 wk. Each section contains data for two models, Model λ1SE and Model λmin, with columns for β, SE, and P values. Row labels include Baseline leptin (ng/mL), Age (years), and Baseline FFM (kg). For Weight loss at 12 wk, Model λ1SE shows Baseline leptin with β 0.115, SE 0.045, P 0.016; Age with β -0.148, SE 0.072, P 0.048; and Baseline FFM with β -0.214, SE 0.068, P 0.004. Model λmin shows Baseline leptin with β 0.028, SE 0.048, P 0.567; Age with β -0.219, SE 0.066, P 0.003; and Baseline FFM with β -0.155, SE 0.057, P 0.011. R-squared values are 0.28 for Model λ1SE and 0.46 for Model λmin. For Fat mass loss at 12 wk, Model λ1SE shows Baseline leptin with β 0.103, SE 0.037, P 0.009; Age with β -0.155, SE 0.057, P 0.011; and Baseline FFM with β -0.113, SE 0.059, P 0.067. Model λmin shows Baseline leptin with β 0.047, SE 0.041, P 0.263; Age with β -0.155, SE 0.057, P 0.011; and Baseline FFM with β -0.113, SE 0.059, P 0.067. R-squared values are 0.21 for Model λ1SE and 0.35 for Model λmin.
LASSO, least absolute shrinkage and selection operator.
Values are β ± se. FFM: fat-free mass. Baseline variables tested in the models: age, total energy expenditure, fat-free mass, fat mass, ghrelin, leptin, adiponectin, GLP-1, insulin, HOMA-IR, usual energy intake. Variables were selected by the LASSO procedure using both lambda 1 − standard error (λ1 se) and lambda minimum (λmin) penalisation criteria. Models are adjusted for intervention group, adaptive thermogenesis at 1 wk and percentual of energy adherence.
Discussion
This 12-wk randomised clinical trial evaluated the effects of TRE + ER on weight loss and body composition in individuals with severe obesity. TRE + ER did not enhance weight loss; nevertheless, it resulted in an additional FM reduction (∼1·1 kg) relative to the CER group, without further compromising FFM. No additional effects of TRE + ER were observed on lipid or glycaemic profiles or subjective appetite ratings. TRE + ER was associated with a greater decline in RMR and a tendency towards more pronounced adaptive thermogenesis over time compared with CER.
Meal timing is a major synchroniser of peripheral clocks, including those in adipose tissue. Evidence suggests that concentrating energy intake within the daytime window may support the synchronisation of central and peripheral clocks, improving nutrient metabolism and promoting greater fat oxidation and reduced adiposity and body weight(Reference Peters, Vahlhaus and Pivovarova-Ramich34,Reference Manoogian, Chow and Taub35) . However, recent meta-analyses including individuals across a wide BMI range have reported either no additional weight loss(Reference Garegnani, Oltra and Ivaldi19) or only slight reductions (−0·93 to −2·11 kg)(Reference Sun, Tan and He16–Reference Schroor, Joris and Plat18) when TRE is combined with ER compared with ER alone. Similarly, pooled estimates indicate only modest additional reductions in FM, ranging from −0·71 to −0·91 kg(Reference Sun, Tan and He16–Reference Schroor, Joris and Plat18). Our results focusing on severe obesity are consistent with previous meta-analyses, as we did not observe a significant additional effect of TRE on weight loss and only a modestly greater reduction in FM compared with CER. Nevertheless, it should be noted that while the absolute difference in FM loss was small (∼1·1 kg), it represented approximately half of the FM loss achieved in the CER group. Taken together, these findings suggest that TRE may confer improvements in FM reduction when combined with ER, although the clinical relevance of this effect remains to be established.
Different than previous studies reporting no effect of TRE combined with ER on RMR after 3 wk(Reference Pureza, Macena and da Silva Junior36) or 9 wk(Reference Fagundes, Tibães and Silva37), we observed a more pronounced RMR decline after 12 wk in the TRE + ER group. This greater decline in RMR may be partly explained by larger decreases in FM and FFM (although not significant for FFM) found in this group. Nevertheless, reductions in RMR occurred disproportionately to changes in body composition, with a tendency towards a greater magnitude in the TRE + ER group. Although early (∼1 wk) adaptive thermogenesis was lower in the TRE + ER group(Reference de Moraes Campos, Brasil and Bezerra21), a compensatory mechanism may have contributed to greater metabolic adaptation after a longer period of ER. The mechanisms underlying this greater FM loss in TRE + ER group remain unclear. It should also be considered that energy intake was estimated from 24-h dietary recalls, a method subject to measurement error. Therefore, we cannot exclude the possibility that participants in the TRE + ER group achieved a slightly greater energy deficit than estimated, which may have contributed to the greater FM loss and larger RMR decline observed in this group.
It is well accepted that baseline FFM and FM influence weight-loss responses to ER possibly through their contribution to energy expenditure(Reference Martins, Roekenes and Gower12,Reference Forbes38) . Adherence is also a key determinant of weight-loss success, whereas adaptive thermogenesis, by conserving energy in response to ER, attenuates weight and FM loss(Reference Martins, Roekenes and Gower12). Consistent with these findings, our exploratory analyses among those who completed the 12-wk intervention suggest that individuals with more favourable baseline metabolic (lower leptin) and body composition (greater FFM) profiles may be more responsive to the intervention. Moreover, complementary longitudinal analysis confirmed the relevance of adherence and adaptive thermogenesis in explaining weight and FM loss.
Insulin sensitivity and β-cell function are greater earlier in the day(Reference Poggiogalle, Jamshed and Peterson39,Reference Sutton, Beyl and Early40) . Lipid oxidation is favoured by longer fasting periods(Reference Ruppert and Kersten41) and exhibits a circadian rhythm(Reference Poggiogalle, Jamshed and Peterson39,Reference Sutton, Beyl and Early40) . Therefore, restricting food intake to the daytime has been hypothesised to improve glucose homeostasis and lipid metabolism. Although previous studies reported a greater decrease in fasting glucose concentrations with TRE combined with ER compared with continuous ER after 8 wk(Reference Peeke, Greenway and Billes22) and 12 wk(Reference Kahleova, Belinova and Malinska42), this benefit has not been consistently confirmed by meta-analyses(Reference Sun, Tan and He16–Reference Schroor, Joris and Plat18). In the present study, results on glycaemic markers suggest that the observed metabolic improvements were primarily driven by ER, with no further benefits of TRE on glycaemic or lipid profile, although there is modest additional reduction in FM with TRE + ER.
A reduction in leptin concurrent with an increase in ghrelin concentrations is an expected response during ER(Reference Müller, Enderle and Pourhassan43). There is also evidence that TRE may promote greater reductions in leptin, partly through greater FM loss(Reference Turner, Charrouf and Martínez-Vizcaíno44) and may attenuate increases in ghrelin through improved circadian alignment of food intake(Reference Habe, Črešnovar and Petelin45,Reference Ravussin, Beyl and Poggiogalle46) . However, no additional effect of TRE has been observed on the expected hormonal changes in response to ER(Reference Pureza, Macena and da Silva Junior36,Reference Pureza, Melo and Macena47) . Similarly, our results suggest that ER, rather than meal timing, was the primary driver of decreases in leptin and increases in ghrelin concentrations over time.
Furthermore, no effects of TRE on subjective appetite ratings were observed during the study. These results do not support the hypothesis that TRE combined with ER promotes greater weight loss by reducing appetite(Reference Ravussin, Beyl and Poggiogalle46). However, because hormones were measured only in the fasting state and appetite ratings were assessed after a single standardised meal, the results should be interpreted with caution.
A limitation of our study was the significant follow-up losses, which may have compromised the model estimates. However, the losses were considered missing at random, and we still managed to reach the calculated sample size at the end of the 12 wk. Another limitation was the low adherence to the prescribed ER, which contributed to less weight loss than expected and may have influenced the evaluation of the intervention effects. However, adherence did not differ between groups, mitigating the impact of the low adherence on the main outcomes. Additionally, as DXA cannot distinguish body water losses from true lean tissue losses, adherence estimated from DXA-derived actual energy loss may be imprecise. Nevertheless, this potential misclassification likely affected both groups similarly. Moreover, adherence to ER was independently monitored through energy intake from 24-h dietary recalls, supporting comparable adherence between groups. We cannot rule out the possibility that the participants had a habitually short eating window, as we did not use this information as an exclusion criterion. However, we observed that less than 10 % of the individuals began the study following a window equal to or shorter than that prescribed for the TRE group (8 h); therefore, we believe this had little impact on the results. Strengths of the study include its randomised, controlled design, which ensured comparable baseline characteristics and similar ER between groups. Furthermore, it was conducted in a growing population (severe obesity)(Reference Burgess, Sun and Zhou2,48) with still limited research on body composition, energy expenditure, appetite and hormonal profiles during dietary interventions.
Conclusion
Our findings suggest that combining ER with the TRE strategy does not enhance weight loss, despite the modestly greater FM loss observed over 12 wk in individuals with severe obesity. Because TRE did not appear to influence the assessed subjective appetite ratings or related hormones, the mechanisms underlying the greater FM reduction remain unclear. The greater decline in RMR and the trend towards more pronounced adaptive thermogenesis observed after 12 wk suggest that the benefits of the TRE strategy may not be sustained over extended periods. This highlights the importance of evaluating long-term metabolic implications of TRE when combined with ER. Nevertheless, the short-term application of this strategy in clinical settings may be considered as an adjunct to improve short-term FM loss.
Supplementary material
For supplementary material/s referred to in this article, please visit https://doi.org/10.1017/S0007114526108629
Data availability statement
The data of this study are available from the corresponding author upon reasonable request.
TAMC: Conceptualisation, Data curation, Formal analysis, Investigation, Methodology, Project administration, Writing – original draft. RLFB: Data curation, Investigation, Methodology, Writing – review & editing. MAO: Investigation, Writing – review & editing. ACFF: Investigation, Writing – review & editing. NBB: Methodology, Writing – review & editing. APM: Conceptualisation, Writing – review & editing. FFB: Conceptualisation, Funding acquisition, Methodology, Resources, Supervision, Writing – review & editing. All authors have read and approved the final version of the manuscript.
This work was supported by Coordenação de Aperfeiçoamento de Pessoal de Nível Superior, Grant/Award Number: finance code 001; Fundação Carlos Chagas Filho de Amparo à Pesquisa do Estado do Rio de Janeiro, Grant/Award Numbers: E-26/204·084/2024, E-26/211·229/2021 and E-26/211·841/2021
The authors declare no conflict of interest.