1 Introduction
The turbulent burning velocity  $S_{T}$ measures how fast a premixed flame consumes the fresh fuel mixture in turbulence, and characterizes the impact of turbulence on the enhancement of the burning rate. The determination of
 $S_{T}$ is one of the most important unsolved problems in turbulent premixed combustion (Peters Reference Peters2000), and is critical in many models of turbulent premixed flames (Lipatnikov & Chomiak Reference Lipatnikov and Chomiak2002; Driscoll Reference Driscoll2008).
In general,  $S_{T}$ depends on the turbulence intensity
 $u^{\prime }$, flame geometry, fuel chemistry (see Lipatnikov & Chomiak Reference Lipatnikov and Chomiak2002; Driscoll Reference Driscoll2008) and gas expansion (Peters Reference Peters2000; Sabelnikov & Lipatnikov Reference Sabelnikov and Lipatnikov2017). Recent studies also investigate the dependence of
 $S_{T}$ on the low temperature fuel chemistry (Won et al. Reference Won, Windom, Jiang and Ju2014), high pressure (Bradley et al. Reference Bradley, Lawes, Liu and Mansour2013; Venkateswaran et al. Reference Venkateswaran, Marshall, Seitzman and Lieuwen2014), high turbulence intensity (Wabel, Skiba & Driscoll Reference Wabel, Skiba and Driscoll2017; Nivarti, Cant & Hochgreb Reference Nivarti, Cant and Hochgreb2019), flame stretch rates and curvatures (Thiesset et al. Reference Thiesset, Halter, Bariki, Lapeyre, Chauveau, Gökalp, Selle and Poinsot2017).
Although there are a variety of empirical models (e.g. Bradley Reference Bradley1992; Lipatnikov & Chomiak Reference Lipatnikov and Chomiak2002; Driscoll Reference Driscoll2008) for predicting  $S_{T}$ and the related flame area ratio, the predictions from different models cannot collapse owing to the lack of a rigorous theoretical framework and a unique definition for
 $S_{T}$, and to the uncertainties of different measurement methods and flame geometries. Various power laws are used to fit data points from the experimental measurement of
 $S_{T}$ in terms of
 $u^{\prime }$, but most expressions depend on empirical parameters (e.g. Bradley Reference Bradley1992; Peters Reference Peters1999; Lipatnikov & Chomiak Reference Lipatnikov and Chomiak2002; Driscoll Reference Driscoll2008; Venkateswaran et al. Reference Venkateswaran, Marshall, Seitzman and Lieuwen2014; Wabel et al. Reference Wabel, Skiba and Driscoll2017), and the corresponding scaling exponent is sensitive to flame configurations and measurements (see Verma & Lipatnikov Reference Verma and Lipatnikov2016). Therefore, a consensus on the universal model for predicting
 $S_{T}$ versus
 $u^{\prime }$ from experimental data remains elusive. In addition, it is possible to use the direct numerical simulation (DNS) to calculate
 $S_{T}$ for turbulent premixed flames with a simple geometry and moderate turbulent Reynolds number
 $Re$ (e.g. Tanahashi, Fujimura & Miyauchi Reference Tanahashi, Fujimura and Miyauchi2000; Bell et al. Reference Bell, Day, Shepherd, Johnson, Cheng, Grcar, Beckner and Lijewski2005; Bell, Day & Lijewski Reference Bell, Day and Lijewski2013; Wang et al. Reference Wang, Hawkes, Chen, Zhou, Li and Aldén2017a), but the computational cost is formidable for engineering applications.
In a theoretical framework,  $S_{T}$ can be modelled by the Eulerian or the Lagrangian approach. Both approaches generally presume that the premixed flame is in the flamelet regime, and this assumption can be extended to the corrugated flame and thin-reaction-zone regimes with further modelling efforts (e.g. Peters Reference Peters1999).
In the Eulerian approach, the local geometry and topology of the flame surface is essential to modelling methods, e.g. the flame surface density (FSD) (see Pope Reference Pope1988; Candel & Poinsot Reference Candel and Poinsot1990; Trouvé & Poinsot Reference Trouvé and Poinsot1994; Veynante & Vervisch Reference Veynante and Vervisch2002), G-equation model (see Peters Reference Peters2000), level-set methods (e.g. Creta & Matalon Reference Creta and Matalon2011; Yu, Bai & Lipatnikov Reference Yu, Bai and Lipatnikov2015) and fractal models (e.g. Gouldin Reference Gouldin1987; Veynante & Mebeveau Reference Veynante and Mebeveau2002; Fureby Reference Fureby2005). In general, the flame front is extracted as the isosurface of an auxiliary scalar function, and the scalar is evolved through a partial differential equation. The additional transport equation of the Reynolds-averaged or filtered scalar field needs to be solved along with modelled conservation equations, and the modelled equations involve some empirical constants and unclosed terms which have to be modelled by further assumptions. The Eulerian modelling methods are usually used in the context of the large-eddy simulation and Reynolds-averaged Navier–Stokes simulation. Although their computational cost can be much lower than that of combustion DNS, most of them are not able or not intended to be converted to explicit expressions for  $S_{T}$ as the empirical correlations obtained from experiments in terms of integral quantities.
Compared with the Eulerian approach, the Lagrangian approach appears to be more natural to describe flame wrinkling with a ‘memory’ of any wrinkling occurring upstream (see Driscoll Reference Driscoll2008; Zhou et al. Reference Zhou, You, Xiong, Yang, Thévenin and Chen2019), but the Lagrangian modelling is generally restricted to non-reacting turbulence. Pope (Reference Pope1988) established a rigorous formulation to describe the Lagrangian evolution of surface elements in turbulent flows. To date, the Lagrangian approach has been extensively applied to investigate the local dynamics of non-reacting turbulence using material or propagating surface elements (Girimaji & Pope Reference Girimaji and Pope1990, Reference Girimaji and Pope1992; Zheng, You & Yang Reference Zheng, You and Yang2017), Lagrangian particles (see Yeung Reference Yeung2002; Toschi & Bodenschatz Reference Toschi and Bodenschatz2009) and Lagrangian scalars (Yang, Pullin & Bermejo-Moreno Reference Yang, Pullin and Bermejo-Moreno2010). In particular, Girimaji & Pope (Reference Girimaji and Pope1992) investigated Lagrangian statistics of the tangential strain rate and the characteristic curvature of propagating surface elements in homogeneous isotropic turbulence (HIT), which helps us to understand the deformation of premixed flames under turbulent straining motion.
Recently, the Lagrangian approach also emerged as a diagnostic tool for investigating turbulence–flame interactions in turbulent combustion. Steinberg, Coriton & Frank (Reference Steinberg, Coriton and Frank2015) quantified variations of the vorticity and strain rate of fluid parcels undergoing combustion by tracking Lagrangian fluid particles and using the three-dimensional, time-resolved experimental measurement in premixed dimethyl-ether/air piloted jet flames. Day et al. (Reference Day, Tachibana, Bell, Lijewski, Beckner and Cheng2015) observed the complex nature of thermodynamic and chemical evolutions along Lagrangian trajectories, including the non-monotonic evolution of temperature within fluid parcels, in a joint experimental and computational study of lean hydrogen turbulent premixed flames in low swirl burners. Hamlington et al. (Reference Hamlington, Darragh, Briner, Towery, Taylor and Poludnenko2017) examined the effects of high-speed turbulence on the non-monotonic thermochemical trajectories in DNS of hydrogen–air premixed flames. Chaudhuri (Reference Chaudhuri2015) developed a method of Lagrangian flame particles to study the time history of specific portions and associated properties of the flame surface. This method has been utilized to analyse turbulence–chemistry interactions (Chaudhuri Reference Chaudhuri2015) and extinction dynamics in  $\text{H}_{2}$/air premixed flames (Uranakara et al. Reference Uranakara, Chaudhuri, Dave, Arias and Im2016). Dave, Mohan & Chaudhuri (Reference Dave, Mohan and Chaudhuri2018) developed a backward flame-particle tracking method to locate the origin of the complex topology and physico-chemical state in a fully developed turbulent premixed flame.
Although the Lagrangian investigation on turbulent premixed flames serves as a valuable diagnostic tool to gain physical insights by interrogating combustion DNS data, there is a lack of predictive models of  $S_{T}$ from the Lagrangian perspective. Thus, we aim to incorporate the statistical information of Lagrangian surface elements into the modelling of
 $S_{T}$, which can bridge the gap between the studies of Lagrangian statistics in non-reacting turbulence and Lagrangian-based diagnostics in turbulent premixed combustion.
The present modelling framework of  $S_{T}$ is based on the Lagrangian statistics of an ensemble of propagating surface elements. The propagating surface elements, which approximate the flame surface, evolve independently via a set of ordinary differential equations for Lagrangian quantities (see Pope Reference Pope1988; Girimaji & Pope Reference Girimaji and Pope1992; Zheng et al. Reference Zheng, You and Yang2017). Each surface element is driven by a local fluid velocity and a displacement velocity normal to itself. The influence of molecular diffusion and chemical reaction on the motion of the flame front is only through the displacement velocity. As a simple model, the propagating surface decouples the diffusion and chemical reaction from the hydrodynamics effect on turbulent premixed combustion.
In the present study, we explore connections between  $S_{T}$ and the statistical geometry of propagating surfaces from a Lagrangian viewpoint, and then propose a simple predictive model of
 $S_{T}$ in terms of
 $u^{\prime }$. Most of the model parameters are pre-determined by Lagrangian statistics of propagating surfaces during a short time period in non-reacting HIT. We remark that the modelling of
 $S_{T}$ can be very sensitive to the flame geometry, so the present flow configuration and the applicability of the proposed
 $S_{T}$ model are restricted to HIT.
The outline of this paper is as follows. In § 2, we describe the numerical methods for the combustion DNS and tracking of propagating surfaces. In § 3, we discuss the area growth of propagating surfaces, and then develop a predictive model of  $S_{T}$ based on the Lagrangian statistics and several physical assumptions. In § 4, we present both a posteriori and a priori tests for the proposed model. Some conclusions are drawn in § 5.
2 Numerical overview
2.1 Combustion DNS
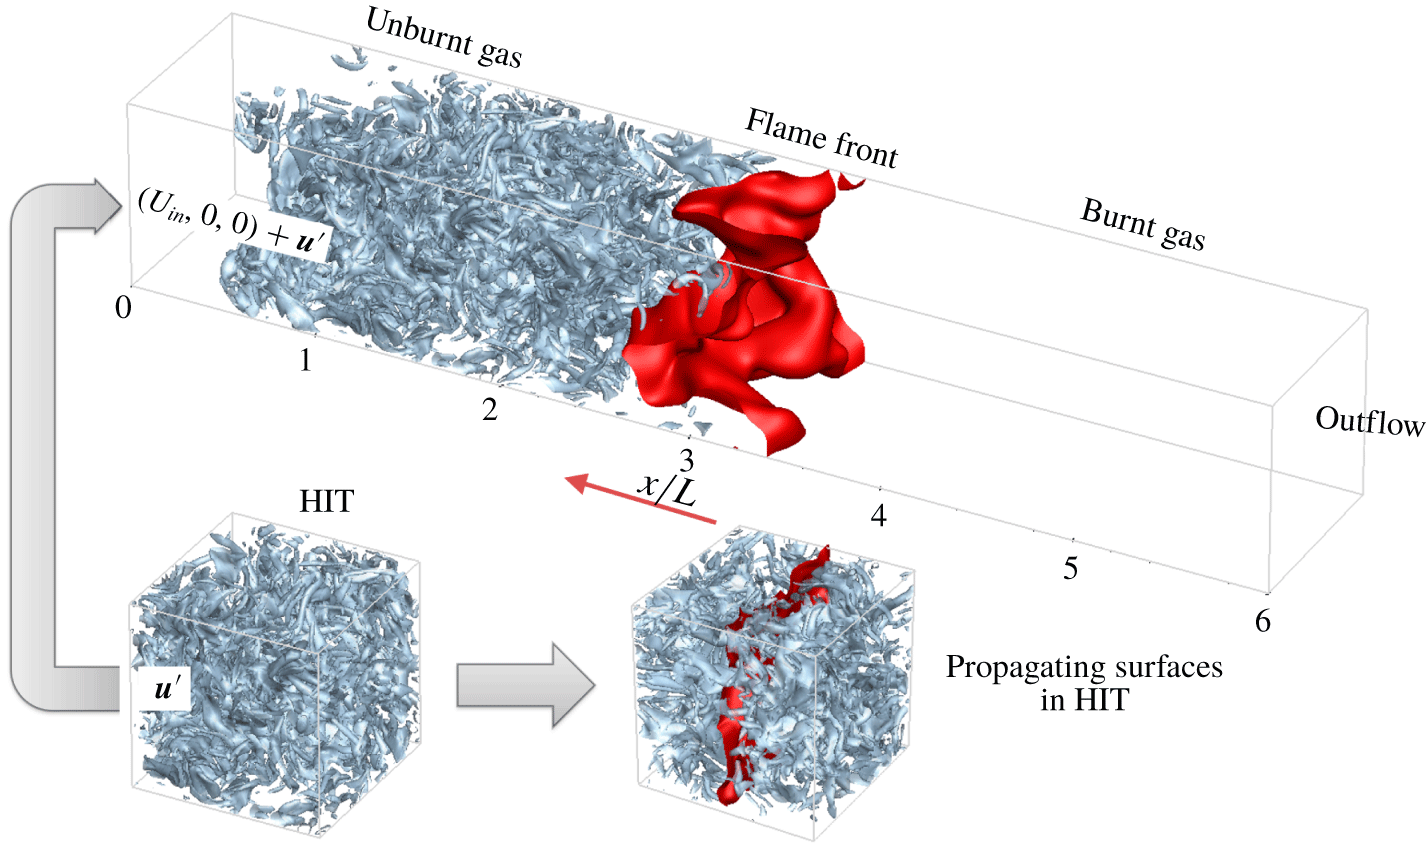
For the combustion DNS, we consider the free propagation of a planar  $\text{H}_{2}$/air premixed flame along the streamwise
 $x$-direction in statistically stationary HIT. This inflow–outflow DNS configuration of turbulent flames (e.g. Tanahashi et al. Reference Tanahashi, Fujimura and Miyauchi2000; Aspden, Day & Bell Reference Aspden, Day and Bell2011; Savard, Bobbitt & Blanquart Reference Savard, Bobbitt and Blanquart2015; Nivarti & Cant Reference Nivarti and Cant2017; Minamoto, Yenerdag & Tanahashi Reference Minamoto, Yenerdag and Tanahashi2018) is presented in figure 1. The computational domain is a cuboid with sides
 $L_{x}\times L_{y}\times L_{z}=6L\times L\times L$ and
 $L=2~\text{mm}$. It has inflow and outflow conditions at the left and right boundaries, respectively, and periodic boundary conditions in the lateral
 $y$- and
 $z$-directions. This domain is discretized on uniform grid points
 $N_{x}\times N_{y}\times N_{z}=6N\times N\times N$ with the mesh spacing
 $\unicode[STIX]{x0394}x$.
A schematic diagram of DNS configurations of the premixed flame propagation (top) and the non-reacting HIT (bottom), with light blue isosurfaces of  $|\unicode[STIX]{x1D74E}|=3\times 10^{5}~\text{s}^{-1}$, the red flame front (top) and the red global propagating surface (bottom). The non-reacting HIT is utilized for the inflow condition in combustion DNS and for the tracking of propagating surfaces.

The unburnt gas is a lean  $\text{H}_{2}$/air mixture with the equivalence ratio
 $\unicode[STIX]{x1D719}=0.6$ at the temperature
 $T_{u}=300~\text{K}$ and atmospheric pressure. It is ignited by a planar laminar flame initially located in the middle of the computational domain. The one-dimensional steady laminar premixed flame is computed using the PREMIX code (Kee et al. Reference Kee, Grcar, Smooke and Miller1985) with the nine-species detailed kinetic mechanism and mixture-averaged transport properties. The laminar flame speed is
 $S_{L}=0.723~\text{m}~\text{s}^{-1}$, the flame thermal thickness
 $\unicode[STIX]{x1D6FF}_{L}\equiv (T_{b}-T_{u})/|\unicode[STIX]{x1D735}T|_{max}=0.361~\text{mm}$ and the flame time scale
 $\unicode[STIX]{x1D70F}_{f}\equiv \unicode[STIX]{x1D6FF}_{L}/S_{L}=0.499~\text{ms}$, where
 $T_{u}$ and
 $T_{b}$ are temperatures in the unburnt and burnt mixtures, respectively, and
 $|\unicode[STIX]{x1D735}T|_{max}$ denotes the maximum temperature gradient in the laminar premixed flame.
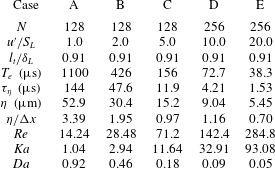
We carried out five DNS cases with varied turbulent intensity  $u^{\prime }$ listed in table 1. For the inflow condition, we first performed a separate DNS of non-reacting, statistically stationary HIT. These HIT data are then imposed on the bulk inflow velocity
 $U_{in}(t)$ by using Taylor’s hypothesis. Thus the inflow condition is
 $\boldsymbol{u}_{in}(y,z,t)=U_{in}(t)+\boldsymbol{u}^{\prime }(y,z,t)$ with the fluctuating velocity
 $\boldsymbol{u}^{\prime }(y,z,t)$ on the
 $y$–
 $z$ plane moving through the HIT field at
 $U_{in}(t)$. A feedback control algorithm (Bell et al. Reference Bell, Day, Grcar and Lijewski2006) is applied to dynamically adjust
 $U_{in}(t)$ to stabilize the turbulent flame in the middle of the computational domain. The convective condition (Desjardins et al. Reference Desjardins, Blanquart, Balarac and Pitsch2008) is used for the velocity and scalars at the outflow boundary in the streamwise direction. A stable, linear velocity forcing (Carroll & Blanquart Reference Carroll and Blanquart2013; Savard et al. Reference Savard, Bobbitt and Blanquart2015) is adopted to maintain the turbulent intensity from
 $x=0.5L$ to
 $5L$ along the streamwise direction in combustion DNS and in the entire domain in non-reacting DNS.
The integral length scale  $l_{t}$, the eddy turnover time
 $T_{e}$, the Kolmogorov time scale
 $\unicode[STIX]{x1D70F}_{\unicode[STIX]{x1D702}}$ and length scale
 $\unicode[STIX]{x1D702}$ and the turbulent Reynolds number
 $Re\equiv u^{\prime }l_{t}/\unicode[STIX]{x1D708}$ of the HIT are summarized in table 1. The Karlovitz number
 $Ka\equiv (u^{\prime }/S_{L})^{3/2}(\unicode[STIX]{x1D6FF}_{L}/l_{t})^{1/2}$ and the Damköhler number
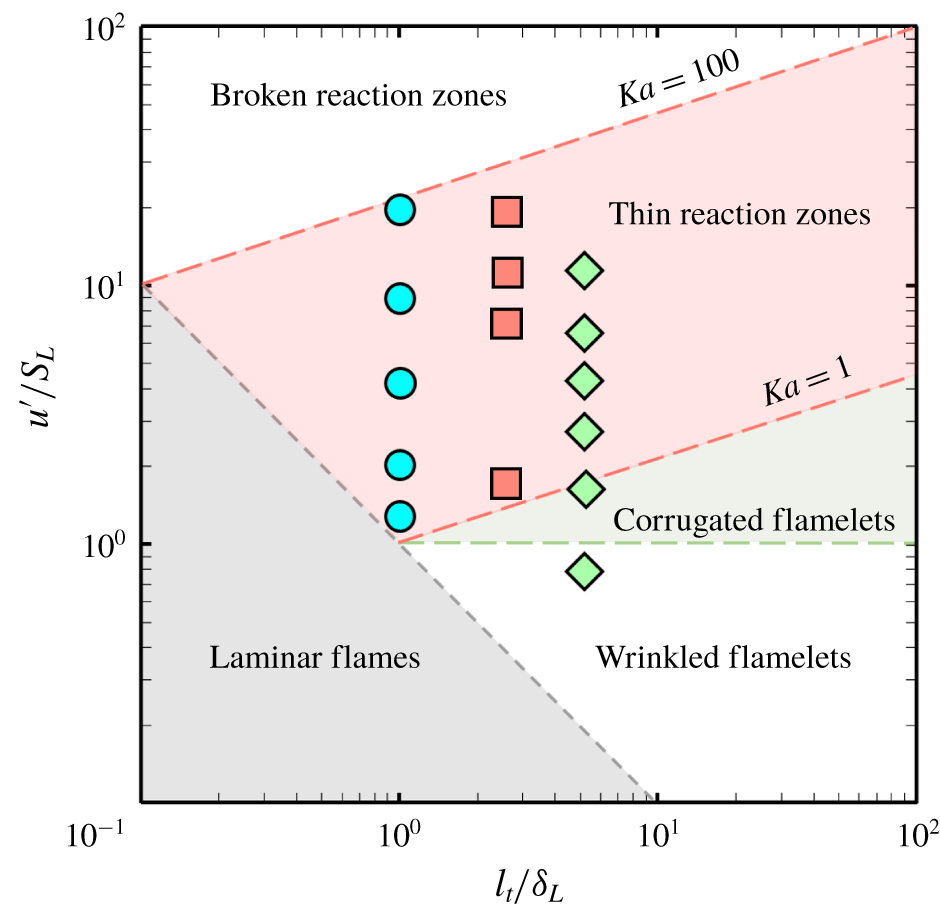
 $Da\equiv (S_{L}/u^{\prime })(l_{t}/\unicode[STIX]{x1D6FF}_{L})$ are computed in the unburnt side. In terms of the regime diagram (Peters Reference Peters2000) in figure 2, case A is very close to the regime of wrinkled flamelets and laminar flames, cases B, C and D are in the thin reaction zone and case E is close to the broken reaction zone. We remark that the boundaries dividing different regimes in the Borghi diagram in figure 2 are solely based on phenomenological arguments and dimensional analysis. Thus the applicability of the diagram is still under debate for accurately characterizing flame structures (e.g. Aspden et al. Reference Aspden, Day and Bell2011; Tamadonfar & Gülder Reference Tamadonfar and Gülder2015; Aspden et al. Reference Aspden, Bell, Day and Egolfopoulos2017; Wabel et al. Reference Wabel, Skiba and Driscoll2017; Skiba et al. Reference Skiba, Wabel, Carter, Hammack, Temme and Driscoll2018), and the diagram is only presented for roughly comparing flow and flame parameters in different DNS series.
The numerical resolution in all the cases is ensured to resolve the smallest turbulent scales by the criterion  $\unicode[STIX]{x1D702}/\unicode[STIX]{x0394}x>0.5$ (see Pope Reference Pope2000) and to resolve the flame length scales using a minimum of 24 grid points within
 $\unicode[STIX]{x1D6FF}_{L}$. In addition, our grid convergence study (see supplementary material available at https://doi.org/10.1017/jfm.2019.1081) further validates that the present combustion DNS is sufficiently well resolved by comparing
 $S_{T}$ and flame structures from simulations on the present grid and a coarser one.
Parameters for DNS cases.

Parameters of three DNS series in the regime diagram of turbulent premixed combustion. Circles: the present DNS; squares: DNS of Nivarti & Cant (Reference Nivarti and Cant2017); diamonds: DNS (group T) of Lee & Huh (Reference Lee and Huh2010).

The low-Mach-number, variable-density formulation of conservation equations of mass, momentum, species and energy are solved on staggered grid points using the NGA code (Desjardins et al. Reference Desjardins, Blanquart, Balarac and Pitsch2008). A second-order centred, kinetic-energy conservative finite difference scheme is used to discretize the spatial derivatives in the momentum equations. A third-order bounded QUICK scheme (Herrmann, Blanquart & Raman Reference Herrmann, Blanquart and Raman2006) with low numerical dissipation and preserved physical bounds of scalars is adopted to treat convection terms in the scalar transport equations of species mass fractions and temperature, and this scheme has been used in a series of DNS of turbulent premixed flames (e.g. Savard et al. Reference Savard, Bobbitt and Blanquart2015; Bobbitt, Lapointe & Blanquart Reference Bobbitt, Lapointe and Blanquart2016). The temporal integration of the conservation equations is advanced by an iterative semi-implicit Crank–Nicolson scheme (Pierce Reference Pierce2001). The detailed nine-species  $\text{H}_{2}$/air kinetic mechanism is employed with reaction rates, thermodynamic properties are evaluated by the CHEMKIN (Kee et al. Reference Kee, Rupley, Meeks and Miller1996) library. The constant Lewis numbers listed in table 2 are used in DNS and they are determined from the fit in terms of mixture-averaged transport properties for the laminar premixed flame. The time integration of chemical source terms is performed using the stiff DVODE solver (Brown, Byrne & Hindmarsh Reference Brown, Byrne and Hindmarsh1989). Each DNS case is first run for at least
 $10T_{e}$ to reach a statistically stationary state, and then statistical properties of interest are calculated over a period of
 $20T_{e}$.
Constant species Lewis numbers.

We define a reaction progress variable
 $$\begin{eqnarray}c\equiv \frac{Y_{f}-Y_{f,u}}{Y_{f,b}-Y_{f,u}}\end{eqnarray}$$
to characterize the progress of reaction and flame propagation, where  $Y_{f}$ is the fuel mass fraction,
 $Y_{f,u}$ and
 $Y_{f,b}$ are the fuel mass fractions in unburnt and burnt mixtures, respectively. The isosurface of
 $c={\hat{c}}$ propagates at a displacement speed
 $S_{d}$. The instantaneous flame front is chosen such that
 ${\hat{c}}=0.8$ corresponds to the location of the maximum heat release rate in the unstrained laminar flame.
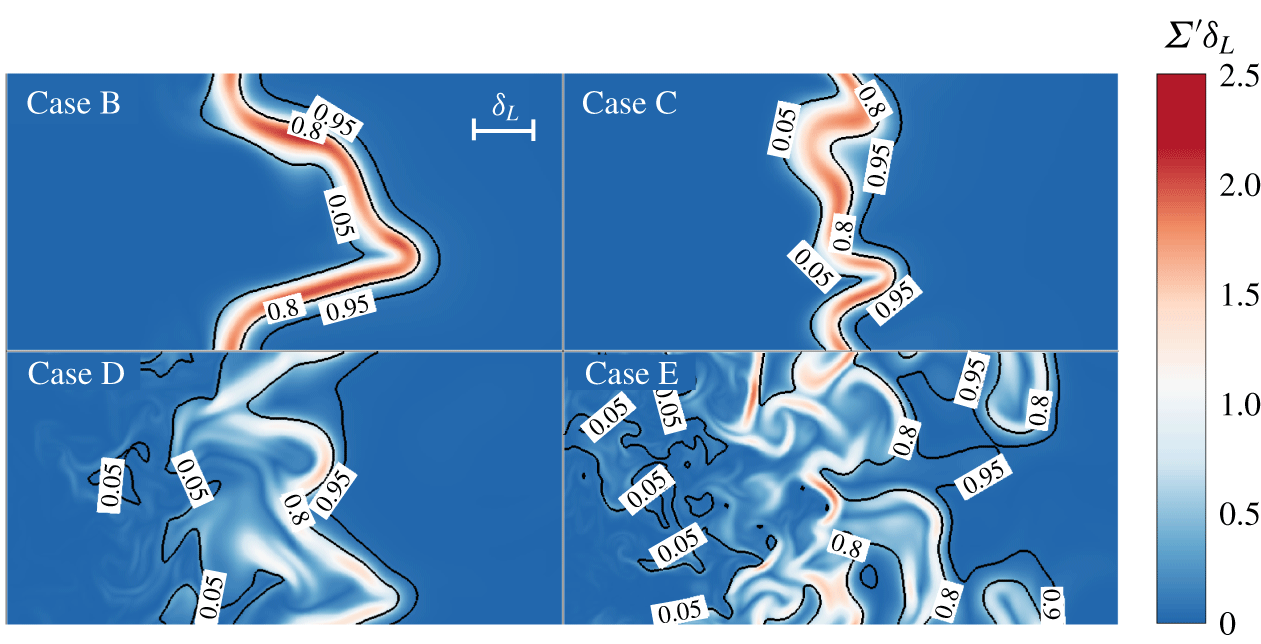
Figure 3 depicts contours of the normalized local FSD  $\unicode[STIX]{x1D6F4}^{\prime }\unicode[STIX]{x1D6FF}_{L}$ on a slice near the flame front at
 $t=20T_{e}$ in combustion DNS cases B, C, D and E, with three isolines of
 $c=0.05,0.8$ and
 $0.95$ to characterize the turbulent flame brush. Here, the large local FSD generally characterizes the flame front, and the detailed definition of the FSD is explained in appendix A. The laminar flamelet structure is retained in most of the flame brush in case B, and the flamelet structure in the preheat zone is disturbed and progressively broadened in cases C and D. The topology of the reaction layer, as the isoline of
 $c=0.8$, still retains sheet-like parallel surfaces in both cases in the thin reaction zone. With increasing
 $Ka$, some portions of the flame front are broken down in case E.
Normalized local FSD  $\unicode[STIX]{x1D6F4}^{\prime }\unicode[STIX]{x1D6FF}_{L}$ on a slice of size
 $2L\times L$ centred at
 $x=3L$ and at
 $t=20T_{e}$ from four combustion DNS cases.

2.2 Tracking of propagating surface elements
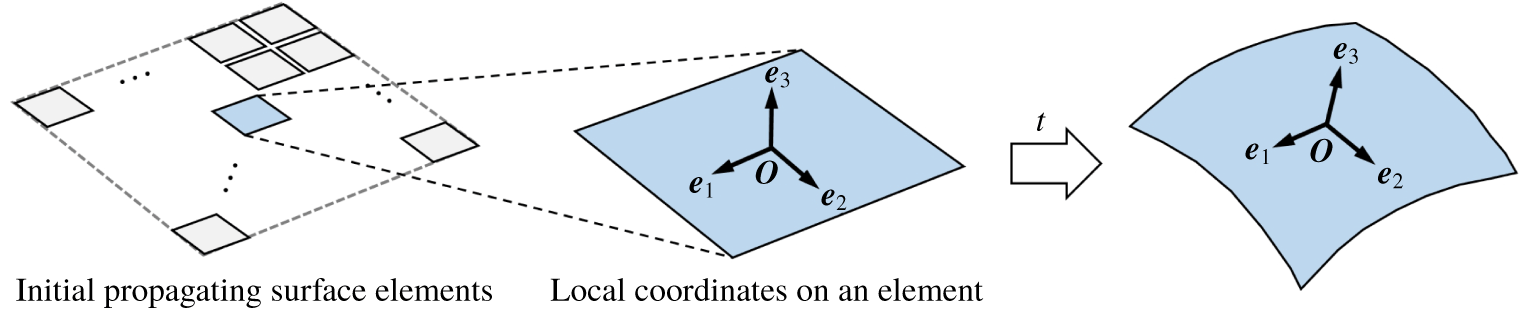
As sketched in figure 1, the non-reacting HIT field used in the inflow condition of combustion DNS is also utilized in the tracking of propagating surface elements. For each DNS case listed in table 1, an ensemble of infinitesimal propagating surface elements are initially arranged on a planar surface in non-reacting HIT to model the propagation of a turbulent premixed flame.
Each propagating surface element carries the information of its Lagrangian location  $\boldsymbol{X}(t)$, local coordinate system
 $\boldsymbol{e}_{i}(\boldsymbol{X}(t),t)$, curvature tensor
 $h_{\unicode[STIX]{x1D6FC}\unicode[STIX]{x1D6FD}}$ and nominal surface area
 $\unicode[STIX]{x1D6FF}A$ (Pope Reference Pope1988). The evolution equation of
 $\boldsymbol{X}(t)$ is
 $$\begin{eqnarray}\frac{\text{d}\boldsymbol{X}(t)}{\text{d}t}=\boldsymbol{u}(\boldsymbol{X}(t),t)+S_{d}(\boldsymbol{X}(t),t)\boldsymbol{n}(\boldsymbol{X}(t),t).\end{eqnarray}$$
Each surface element moves with the local fluid velocity  $\boldsymbol{u}$ and the displacement velocity
 $S_{d}\boldsymbol{n}$, where
 $\boldsymbol{n}$ denotes the unit normal of the surface element, and the displacement speed
 $S_{d}$ can be simply modelled by a constant
 $S_{L}$ or a variable accounting for the effect of weak flame stretch.
As sketched in figure 4, a local Cartesian coordinate system  $\boldsymbol{e}_{i}(\boldsymbol{X}(t),t)$,
 $i=1,2,3$ is attached to each surface element in order to compute
 $\boldsymbol{n}$ and other geometric properties of the surface elements. Its origin, denoted by ‘O’, is at the position
 $\boldsymbol{X}(t)$ of the surface element. The unit normal vector
 $\boldsymbol{e}_{3}$ is equivalent to
 $\boldsymbol{n}$ in (2.2), and two orthogonal unit vectors
 $\boldsymbol{e}_{1}$ and
 $\boldsymbol{e}_{2}$ span the tangent plane.
Sketch of the temporal evolution of the propagating surface elements.

The governing equations for this coordinate system are
 $$\begin{eqnarray}\displaystyle \left.\begin{array}{@{}c@{}}\displaystyle \frac{\text{d}\boldsymbol{e}_{3}}{\text{d}t}=-\boldsymbol{e}_{\unicode[STIX]{x1D6FC}}u_{3,\unicode[STIX]{x1D6FC}},\\ \displaystyle \frac{\text{d}\boldsymbol{e}_{\unicode[STIX]{x1D6FC}}}{\text{d}t}=\frac{1}{2}\boldsymbol{e}_{\unicode[STIX]{x1D6FD}}(u_{\unicode[STIX]{x1D6FD},\unicode[STIX]{x1D6FC}}-u_{\unicode[STIX]{x1D6FC},\unicode[STIX]{x1D6FD}})+\boldsymbol{e}_{3}u_{3,\unicode[STIX]{x1D6FC}},\quad \unicode[STIX]{x1D6FC},\unicode[STIX]{x1D6FD}=1,2,\end{array}\right\} & & \displaystyle\end{eqnarray}$$
where ‘ $,\unicode[STIX]{x1D6FC}$’ denotes the partial derivative in the direction of
 $\boldsymbol{e}_{\unicode[STIX]{x1D6FC}}$. The governing equation of the curvature tensor
 $h_{\unicode[STIX]{x1D6FC}\unicode[STIX]{x1D6FD}}$ is
 $$\begin{eqnarray}\frac{\text{d}h_{\unicode[STIX]{x1D6FC}\unicode[STIX]{x1D6FD}}}{\text{d}t}=s_{33}h_{\unicode[STIX]{x1D6FC}\unicode[STIX]{x1D6FD}}-(s_{\unicode[STIX]{x1D6FE}\unicode[STIX]{x1D6FD}}h_{\unicode[STIX]{x1D6FC}\unicode[STIX]{x1D6FE}}+s_{\unicode[STIX]{x1D6FE}\unicode[STIX]{x1D6FC}}h_{\unicode[STIX]{x1D6FD}\unicode[STIX]{x1D6FE}})+u_{3,\unicode[STIX]{x1D6FC}\unicode[STIX]{x1D6FD}}+S_{d}h_{\unicode[STIX]{x1D6FC}\unicode[STIX]{x1D6FE}}h_{\unicode[STIX]{x1D6FE}\unicode[STIX]{x1D6FD}},\end{eqnarray}$$
where the partial derivatives of  $S_{d}$ are neglected (Zheng et al. Reference Zheng, You and Yang2017) and
 $$\begin{eqnarray}s_{ij}\equiv \frac{1}{2}\left(\frac{\unicode[STIX]{x2202}u_{i}}{\unicode[STIX]{x2202}x_{j}}+\frac{\unicode[STIX]{x2202}u_{j}}{\unicode[STIX]{x2202}x_{i}}\right),\quad i,j=1,2,3\end{eqnarray}$$
denotes the local rate-of-strain tensor. Principal curvatures  $\unicode[STIX]{x1D705}_{i},\;i=1,2$ of a surface element are defined as
 $\unicode[STIX]{x1D705}_{i}=-k_{i}$ with
 $\unicode[STIX]{x1D705}_{1}>\unicode[STIX]{x1D705}_{2}$, where
 $k_{i},\;i=1,2$ are eigenvalues of
 $h_{\unicode[STIX]{x1D6FC}\unicode[STIX]{x1D6FD}}$. A surface element convex (or concave) to the propagating direction
 $\boldsymbol{n}$ has a positive (or negative) curvature.
At time  $t$,
 $\unicode[STIX]{x1D6FF}A(t)$ denotes the nominal surface area, which can also be considered as the area ratio of infinitesimal surface elements. The governing equation of
 $\unicode[STIX]{x1D6FF}A(t)$ or the surface stretch rate
 $K$ of the propagating surface is
 $$\begin{eqnarray}K\equiv \frac{1}{\unicode[STIX]{x1D6FF}A(t)}\frac{\text{d}\unicode[STIX]{x1D6FF}A(t)}{\text{d}t}=K_{t}+2S_{d}\unicode[STIX]{x1D705},\end{eqnarray}$$
where the tangential strain rate  $K_{t}\equiv u_{1,1}+u_{2,2}$ characterizes the stretching of the surface area due to the straining by the flow field, and
 $2S_{d}\unicode[STIX]{x1D705}$ with the mean curvature
 $\unicode[STIX]{x1D705}\equiv (\unicode[STIX]{x1D705}_{1}+\unicode[STIX]{x1D705}_{2})/2$ represents the factional rate of change of area due to propagation.
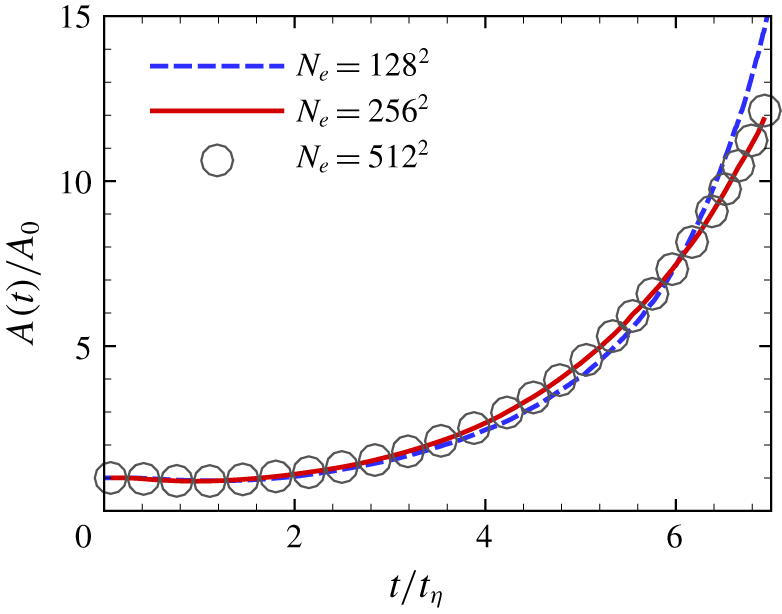
At the initial time,  $N_{e}=256^{2}$ surface elements are uniformly arranged on an
 $x$–
 $y$ plane at
 $z=L/2$ to model a propagating planar flame in premixed combustion (see figures 1 and 4). Each surface element has
 $(\boldsymbol{e}_{1},\boldsymbol{e}_{2},\boldsymbol{e}_{3})=(0,0,1)$,
 $h_{\unicode[STIX]{x1D6FC}\unicode[STIX]{x1D6FD}}=0$ and
 $\unicode[STIX]{x1D6FF}A(0)=A_{0}/N_{e}$, where
 $A_{0}\equiv \sum _{N_{e}}\unicode[STIX]{x1D6FF}A(0)$ is the initial global surface area. A convergence test with increasing
 $N_{e}$ in figure 5 shows that the total surface area ratio, which is defined later in § 3.2, from
 $N_{e}=256^{2}$ surface elements is almost identical to that from
 $N_{e}=512^{2}$, so
 $N_{e}=256^{2}$ is used in the present study. Additionally, our grid convergence study (see supplementary material) validates that the present non-reacting DNS is sufficiently well resolved to calculate Lagrangian statistics of propagating surfaces.
Convergence test of the number of propagating surface elements in non-reacting DNS case C.

The tracking of propagating surface elements begins when the non-reacting HIT has reached the statistically stationary state. A second-order, symmetry-preserved Runge–Kutta scheme (Zheng et al. Reference Zheng, You and Yang2017) is applied to advance (2.2), (2.3) and (2.6) explicitly and (2.4) implicitly. The time increment is sufficiently small to resolve the finest scales of the velocity field. The Fourier spectral method is used to evaluate the velocity derivatives involved in these equations. The interpolation is performed by a sixth-order Lagrangian interpolation scheme. In addition, the propagating surface elements can evolve into cusps after a finite time (Girimaji & Pope Reference Girimaji and Pope1992), and these cusps are removed in the tracking based on the positive definiteness of the curvature tensor. The detailed numerical implementation of the surface tracking and the criterion for detecting cusps are described in Zheng et al. (Reference Zheng, You and Yang2017), and numerical errors have been verified to be negligible. It is noted that the computational cost of the tracking of propagating surfaces in non-reacting DNS is very low, of  $O(1)$ CPU hours on a single core. By contrast, the computational cost of each combustion DNS on a parallel machine is
 $O(10^{4})\sim O(10^{5})$ CPU hours.
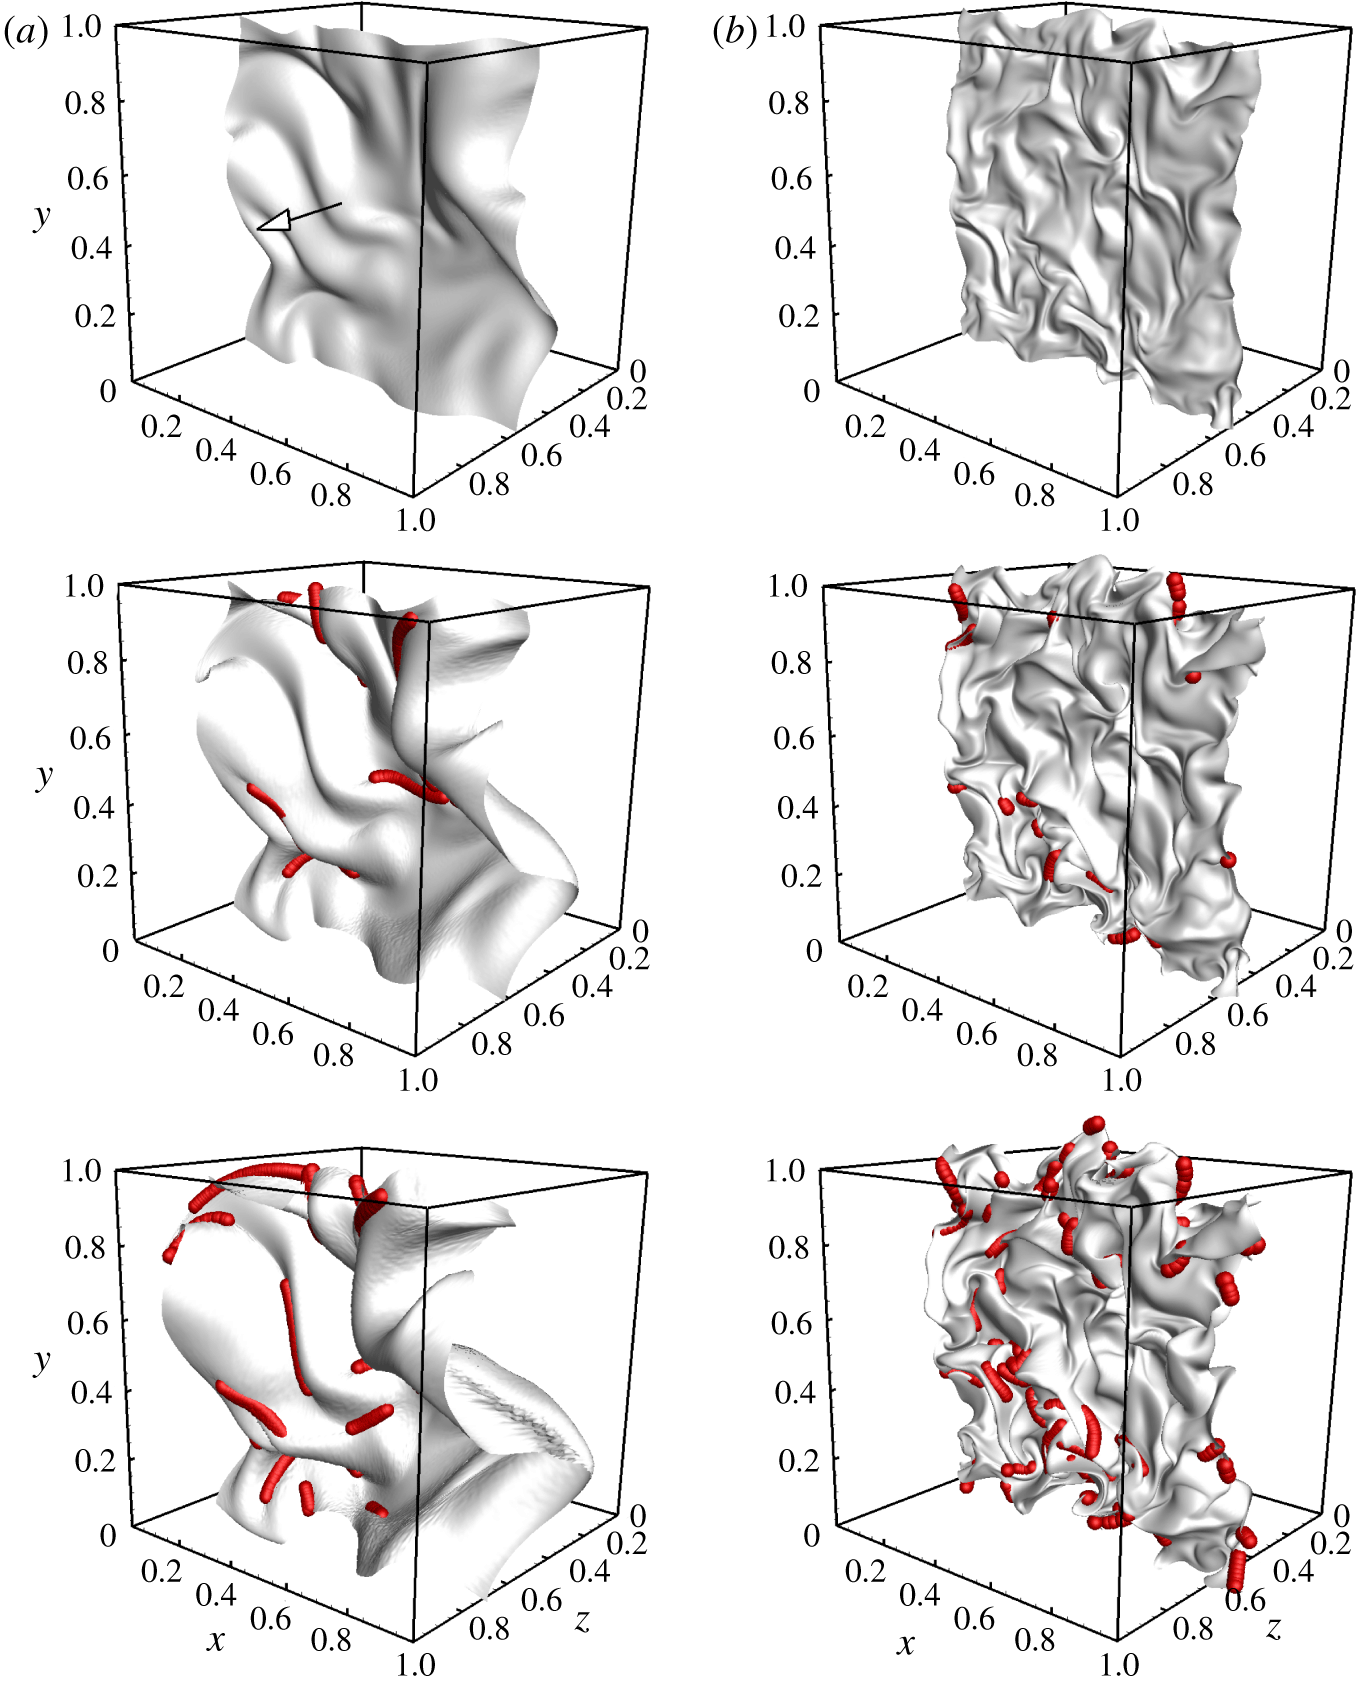
The evolution of global propagating surfaces consisting of surface elements in stationary HIT is shown in figure 6 for cases B and D. From an initial plane, the propagating surface is gradually wrinkled and corrugated by turbulent straining motion to form the cellular geometry. Compared with the persistent stretch of a passive material surface with  $S_{d}=0$, the evolution of a propagating surface with finite
 $S_{d}$ can generate cusps, and cusp locations are marked by red dots. Most of the cusps are generated around the crest of the surface with large negative curvatures. This ‘pocket structure’ is critical for predicting the flame stabilization and pollution formation in turbulent premixed combustion (Bell et al. Reference Bell, Day and Lijewski2013). At the same normalized time
 $t^{\ast }\equiv t/\unicode[STIX]{x1D70F}_{\unicode[STIX]{x1D702}}$, the surface is more wrinkled in case D with larger turbulence intensity than in case B.
Temporal evolution of the global propagating surface in cases B and D at  $t^{\ast }=1$, 2 and 3 (from top to bottom) in non-reacting HIT. The arrow denotes the propagation direction, and the red dots mark locations of cusp generation.

We remark that the ensemble of surface elements can only approximate the global propagating surface rather than exactly represent the real flame surface. The surface elements can be considered as sample points scattered on the global propagating surface. Moreover, the heat release in combustion can induce fluid thermal expansion and acceleration (Peters Reference Peters2000; Sabelnikov & Lipatnikov Reference Sabelnikov and Lipatnikov2017). The relevant density change and pressure effects can influence the turbulent flame morphology and dynamics, such as cusp formation and collision events (Fogla, Creta & Matalon Reference Fogla, Creta and Matalon2015), and they can be coupled with the Darrieus–Landau instability under weak turbulence (Creta & Matalon Reference Creta and Matalon2011; Troiani, Creta & Matalon Reference Troiani, Creta and Matalon2015). These variable-density effects are not considered in the present non-reacting HIT, and they can be incorporated via a modelled variable-density flow in future work.
3 Model development
3.1 Turbulent burning velocity
The turbulent burning velocity is defined using the global consumption speed of fuel
 $$\begin{eqnarray}S_{T}\equiv \frac{1}{\unicode[STIX]{x1D70C}_{u}Y_{f,u}L_{y}L_{z}}\int _{\unicode[STIX]{x1D6FA}}-\unicode[STIX]{x1D70C}\dot{\unicode[STIX]{x1D714}}_{f}(x,y,z,t)\,\text{d}\unicode[STIX]{x1D6FA},\end{eqnarray}$$
where  $\unicode[STIX]{x1D70C}_{u}$ denotes the density of the unburnt mixture,
 $\dot{\unicode[STIX]{x1D714}}_{f}$ the net reaction rate of fuel and
 $\unicode[STIX]{x1D6FA}$ the entire computational domain. Although there is no consensus on the best definition of
 $S_{T}$ (Driscoll Reference Driscoll2008), i.e.
 $S_{T}$ can be defined by the local consumption speed or the local displacement speed, we use the global consumption speed (3.1) without the subjective selection of the isocontour threshold.
Damköhler (Reference Damköhler1940) conjectured that turbulence can enhance  $S_{T}$ primarily through increasing the flame surface area under a low turbulence intensity, so the ratio of the flame surface area
 $A_{T}$ in turbulence and its projection in the propagating direction
 $A_{0}$ is generally equal to the ratio
 $S_{T}/S_{L}$. Thus the modelling of
 $A_{T}$ is essential to estimate
 $S_{T}$ under the assumption (see Driscoll Reference Driscoll2008)
 $$\begin{eqnarray}\frac{S_{T}}{S_{L}}=I_{0}\frac{A_{T}}{A_{0}}\approx \frac{A_{T}}{A_{0}},\end{eqnarray}$$
where the stretch factor  $I_{0}$ depends on the effect of differential diffusion and is assumed to be unity from the present combustion DNS results (not shown). Some other DNS studies of turbulent premixed flames in HIT with moderate and high
 $u^{\prime }$ (see Bell, Day & Grcar Reference Bell, Day and Grcar2002; Hawkes & Chen Reference Hawkes and Chen2006; Nivarti & Cant Reference Nivarti and Cant2017; Wang, Magi & Abraham Reference Wang, Magi and Abraham2017) also observe that
 $S_{T}/S_{L}$ is proportional to
 $A_{T}/A_{0}$ with nearly unity
 $I_{0}$, which supports the validity of Damköhler’s hypothesis for the flame propagation in HIT. It is noted that, in some jet flames under very strong turbulence (e.g. Wabel et al. Reference Wabel, Skiba and Driscoll2017), Nivarti et al. (Reference Nivarti, Cant and Hochgreb2019) argued that small-scale turbulence can serve as an effective turbulent diffusivity to enhance
 $S_{T}$, and this additional factor should be incorporated into (3.2).
3.2 Area growth of propagating surfaces
We model the ratio  $A_{T}/A_{0}$ of flame surface areas by the ratio of global propagating surface areas in the DNS of non-reacting HIT. In the evolution of a global propagating surface initially consisting of
 $N_{e}$ surface elements, only
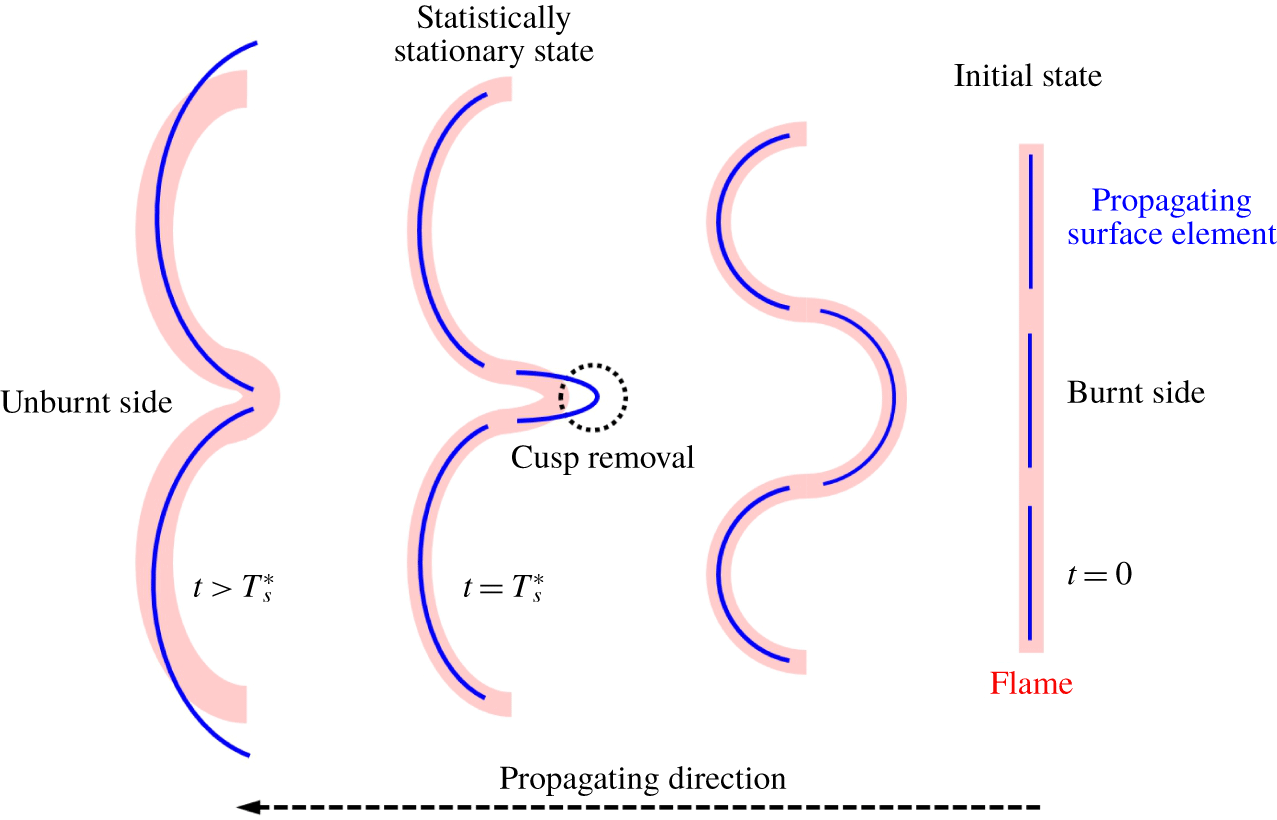
 $N_{s}(t)$ surface elements survive. As sketched in figure 7, the other
 $N_{d}(t)$ surface elements disappear, because they evolve into cusps at a finite time and their surface areas shrink to zero (Girimaji & Pope Reference Girimaji and Pope1992). Since these cusps cannot exist owing to smoothing effects of diffusion and curvature in real flames, these extreme samples are removed in the tracking of propagating elements (see Zheng et al. Reference Zheng, You and Yang2017). This removal of the cusps can be viewed as a mechanism of area reduction, and other flame destruction mechanisms, such as mutual annihilation and quenching, are implicitly involved in further modelling.
A schematic diagram of the evolution of propagating surface elements (thin blue lines) and a flame front (thick red lines).

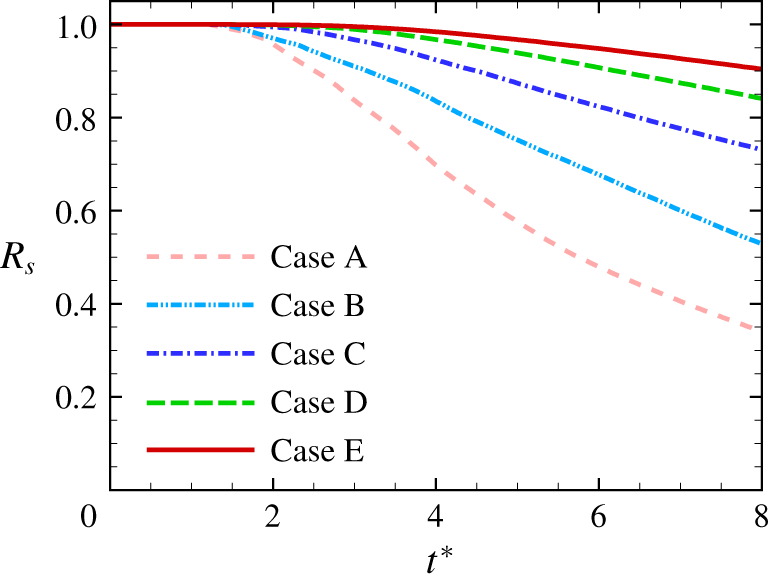
The surviving ratio  $R_{s}\equiv N_{s}(t)/N_{e}$ of surface elements is shown in figure 8. We observe that the cusp generation occurs around
 $t^{\ast }=2$ and the cusps are generated more quickly at smaller turbulence intensity. At smaller
 $u^{\prime }/S_{L}$, the propagation term in (2.4) can dominate (see Zheng et al. Reference Zheng, You and Yang2017), so a surface element with a large negative curvature can more easily develop a singularity in a finite time.
It is noted that all the subsequent quantities with the superscript ‘*’ denote the ones normalized by Kolmogorov length scale  $\unicode[STIX]{x1D702}$, time scale
 $\unicode[STIX]{x1D70F}_{\unicode[STIX]{x1D702}}$ or velocity scale
 $u_{\unicode[STIX]{x1D702}}$. Zheng et al. (Reference Zheng, You and Yang2017) demonstrated that the profiles of ensemble-averaged
 $\unicode[STIX]{x1D705}_{1}^{\ast }$ and
 $\unicode[STIX]{x1D705}_{2}^{\ast }$ of propagating surfaces in terms of
 $S_{d}^{\ast }$ at the statistically stationary state are almost independent of
 $Re$.
Surviving ratios of propagating surface elements in non-reacting DNS cases.

After removing the cusps, the total surface area of the global propagating surface consisting of  $N_{s}\leqslant N_{e}$ surviving surface elements is approximated as
 $$\begin{eqnarray}A(t)\equiv \mathop{\sum }_{N_{s}(t)}\unicode[STIX]{x1D6FF}A(t).\end{eqnarray}$$
Summing up the local quantities of  $N_{s}(t)$ surviving surface elements in (2.6) yields the evolution equation of
 $A(t)$ (Zheng et al. Reference Zheng, You and Yang2017)
 $$\begin{eqnarray}\frac{\text{d}}{\text{d}t}\ln A(t)=\langle K_{t}(t)\rangle _{A}+2\langle S_{d}(t)\unicode[STIX]{x1D705}(t)\rangle _{A},\end{eqnarray}$$
where
 $$\begin{eqnarray}\langle f(t)\rangle _{A}\equiv \frac{\mathop{\sum }_{N_{s}(t)}f(t)\unicode[STIX]{x1D6FF}A(t)}{A(t)}\end{eqnarray}$$
denotes the area-weighted average of a quantity  $f(t)$.
Integrating the normalized (3.4) from the initial tracking time  $t^{\ast }=0$ to a given time
 $t^{\ast }$ yields the surface area of the global propagating surface
 $$\begin{eqnarray}\frac{A(t^{\ast })}{A_{0}}=\exp \left(\int _{0}^{t^{\ast }}\langle K_{t}^{\ast }(s)\rangle _{A}\,\text{d}s\right)\exp \left(2\int _{0}^{t^{\ast }}\langle S_{d}^{\ast }(s)\unicode[STIX]{x1D705}^{\ast }(s)\rangle _{A}\,\text{d}s\right).\end{eqnarray}$$
This implies that the growth of  $A(t)$ of the propagating surfaces is due to the Lagrangian history of statistically positive tangential strain-rate and propagation-curvature terms in the wrinkling process of propagating surfaces in turbulence (Zheng et al. Reference Zheng, You and Yang2017). Subsequently,
 $S_{d}$ is assumed to be a constant laminar burning velocity
 $S_{L}$ as
 $$\begin{eqnarray}\frac{A(t^{\ast })}{A_{0}}=\exp \left(\int _{0}^{t^{\ast }}\langle K_{t}^{\ast }(s)\rangle _{A}+2S_{L}^{\ast }\langle \unicode[STIX]{x1D705}^{\ast }(s)\rangle _{A}\,\text{d}s\right).\end{eqnarray}$$
This assumption is justified and the effect of flame stretch on  $S_{d}$ is discussed in appendix B.
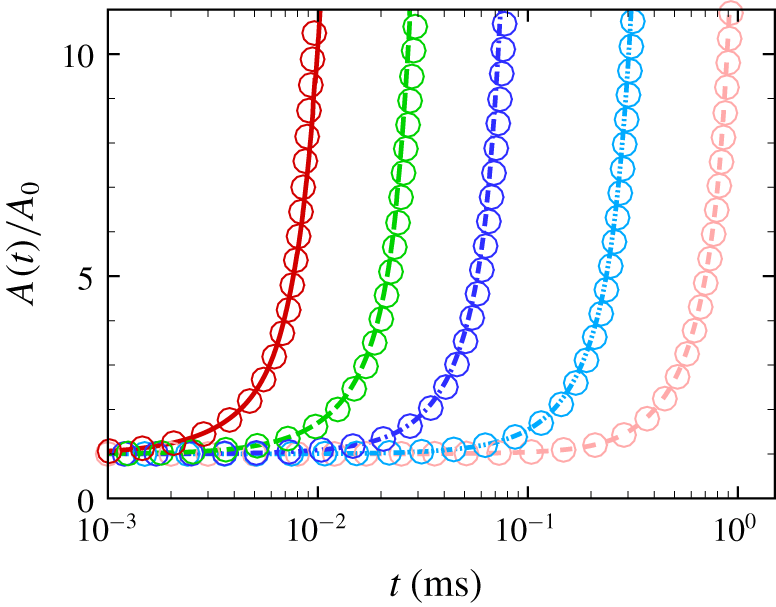
Surface area ratios of propagating surfaces in terms of (a) the physical time and (b) normalized time in non-reacting HIT.

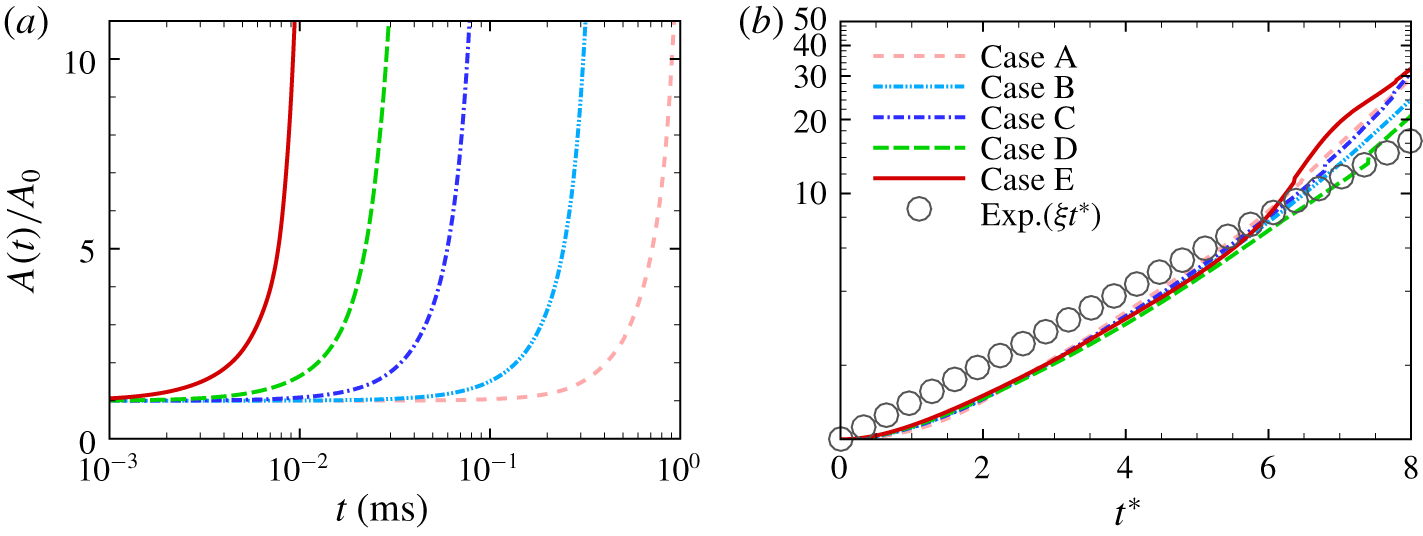
As implied in (3.7),  $A(t)/A_{0}$ grows with
 $t$ in figure 9(a), and its growth rate increases with
 $Re$ for the same
 $S_{L}$, because
 $K_{t}$ scales as
 $K_{t}\sim 1/\unicode[STIX]{x1D70F}_{\unicode[STIX]{x1D702}}\sim Re^{1/2}$. This result is consistent with the observation that
 $A_{T}$ of flames increases with
 $Re$ in the argument of FSD modelling in appendix A. On the other hand, if
 $t$ is normalized by corresponding
 $\unicode[STIX]{x1D70F}_{\unicode[STIX]{x1D702}}$ in each case, the profiles of
 $A(t^{\ast })/A_{0}$ for different
 $Re$ collapse in figure 9(b). Similarly, the surviving ratio for the same
 $S_{L}^{\ast }$ is almost independent of
 $Re$ (Zheng et al. Reference Zheng, You and Yang2017). These indicate that Kolmogorov scales are more appropriate than integral scales for the normalization in scale analyses, and further modelling based on the universal properties of
 $A(t^{\ast })$ naturally involves the effect of
 $Re$ on
 $S_{T}$ in terms of integral quantities.
Growth rates of the surface area of propagating surfaces in non-reacting HIT.

The estimation of  $A(t)/A_{0}$ of propagating surfaces is similar to that for material surfaces in non-reacting HIT. Batchelor (Reference Batchelor1952) proposed that
 $A(t)/A_{0}$ of material surfaces grows exponentially owing to the persistent stretching of turbulent motion, which was validated by DNS (e.g. Girimaji & Pope Reference Girimaji and Pope1990; Goto & Kida Reference Goto and Kida2007; Yang et al. Reference Yang, Pullin and Bermejo-Moreno2010). Considering the self-similar area growth of propagating surfaces at different
 $Re$, we re-express (3.7) in the form of
 $$\begin{eqnarray}\frac{A(t^{\ast })}{A_{0}}=\exp (\unicode[STIX]{x1D709}_{A}t^{\ast }),\end{eqnarray}$$
where  $\unicode[STIX]{x1D709}_{A}(t^{\ast })\equiv \log (A(t^{\ast })/A_{0})/t^{\ast }$ is the area growth rate. A similar exponential growth of the flame surface was assumed by Kerstein (Reference Kerstein1988) and Yakhot (Reference Yakhot1988).
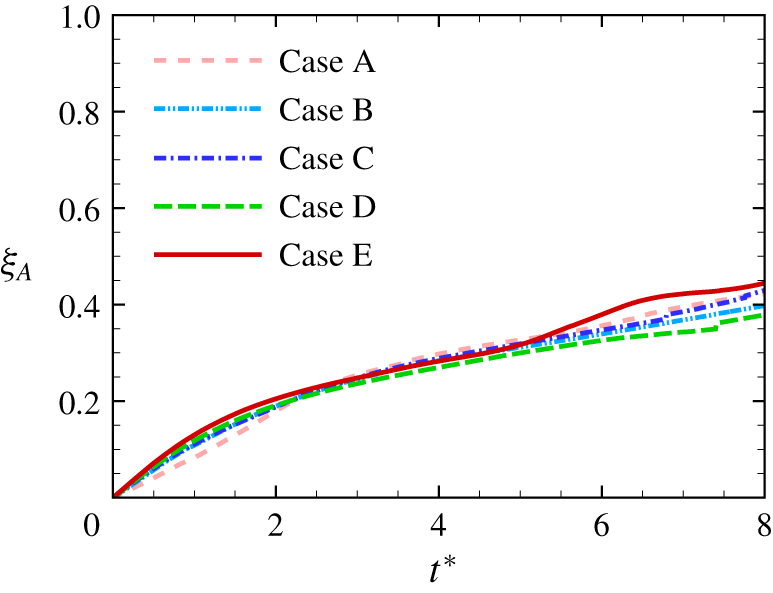
In figure 10, the area growth rates also nearly collapse, consistent with the observation in figure 9(b). For material surfaces in HIT,  $\unicode[STIX]{x1D709}_{A}$ approaches a statistically stationary state as
 $\unicode[STIX]{x1D709}_{A}=0.33\pm 0.04$ after a rapid, monotonic growth in
 $2\sim 3\unicode[STIX]{x1D70F}_{\unicode[STIX]{x1D702}}$ (see Yang et al. Reference Yang, Pullin and Bermejo-Moreno2010). For propagating surfaces, by contrast,
 $\unicode[STIX]{x1D709}_{A}$ does not reach the statistically stationary state, so an additional approximation is introduced to model
 $$\begin{eqnarray}\unicode[STIX]{x1D709}_{A}(t^{\ast })=\unicode[STIX]{x1D709}\end{eqnarray}$$
by a constant  $\unicode[STIX]{x1D709}$, which is addressed in § 3.5 in detail.
3.3 Introduction of the truncation time
A global propagating surface in turbulence should have  $A(t)\rightarrow \infty$ as
 $t\rightarrow \infty$ in (3.8) owing to the persistent stretching and the lack of surface shortening mechanisms. On the other hand, the shortening mechanism in real turbulent flames may occur when adjacent flamelets consume the intervening reactant, thereby annihilating both surface elements. Thus the flame area
 $A_{T}$ should be finite, which can be considered as a stationary random variable with competing flame stretching and shortening mechanisms (Marble & Broadwell Reference Marble and Broadwell1977).
To resolve this contradiction, we postulate that the surface area of turbulent flames can be estimated by
 $$\begin{eqnarray}A_{T}=A(T_{s}^{\ast })\end{eqnarray}$$
at a truncation time  $T_{s}^{\ast }$ when the statistical geometry of the propagating surfaces just reaches a statistically stationary state (Zheng et al. Reference Zheng, You and Yang2017). As sketched in figure 7, this state resembles the statistical equilibrium state in combustion between the flame area growth due to turbulent straining and the area consumption due to flame self-propagation. After this state, the nominal area of independent propagating surfaces with infinitesimal thickness can still grow (see figure 9), but the area of real flames statistically converges to a finite value. In § 3.6, we will demonstrate that the ansatz of (3.10), together with modelled
 $T_{s}^{\ast }$, serves as the basic analytical structure leading to a physically reasonable functional form of
 $S_{T}$ with finite
 $A_{T}$, so the flame shortening mechanisms can be implicitly incorporated into the truncation time. Applying (3.8) and (3.9) to (3.10), we have the model of
 $A_{T}$ in terms of
 $T_{s}^{\ast }$ as
 $$\begin{eqnarray}\frac{A_{T}}{A_{0}}=\exp \left(\unicode[STIX]{x1D709}T_{s}^{\ast }\right).\end{eqnarray}$$
Before modelling  $T_{s}^{\ast }$, we first use the characteristic curvature
 $$\begin{eqnarray}C^{\ast }\equiv \sqrt{{\unicode[STIX]{x1D705}_{1}^{\ast }}^{2}+{\unicode[STIX]{x1D705}_{2}^{\ast }}^{2}}\end{eqnarray}$$
to characterize the statistical stationary state of propagating surfaces. We find that the temporal evolution of the ensemble-averaged  $C^{\ast }$ is statistically more robust than those of
 $K_{t}^{\ast }$ and
 $\unicode[STIX]{x1D705}^{\ast }$ in (3.6). The latter two are found to be very sensitive to specific realizations in DNS.
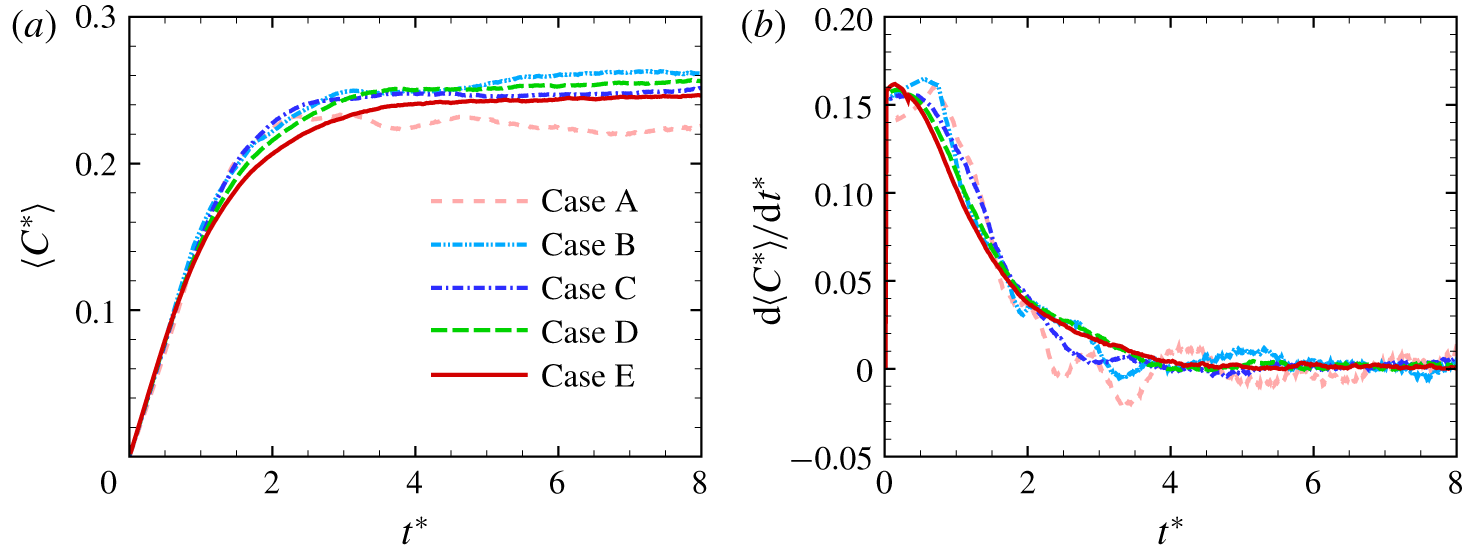
The DNS of propagating surfaces demonstrates that  $\langle C^{\ast }\rangle$ can reach a statistically stationary state after a short time in figure 11(a), where
 $\langle \cdot \rangle$ denotes the ensemble average over all the surviving surface elements, and this result is supported by the theoretical analysis in appendix C. The temporal growth rate
 $\text{d}\langle C^{\ast }\rangle /\text{d}t^{\ast }$ of
 $\langle C^{\ast }\rangle$ is also computed and shown in figure 11(b). After a rapid growth at very small times, the growth rate decays and finally approaches a statistical stationary state. We observe that the growth rates almost collapse in cases C, D and E at moderate
 $Re$, which implies that the time
 $T_{s}^{\ast }$ to reach the statistically stationary state of
 $\langle C^{\ast }\rangle$ approaches a finite value as
 $u^{\prime }/S_{L}\rightarrow \infty$. Furthermore, the temporal evolution of probability density functions (PDFs) of
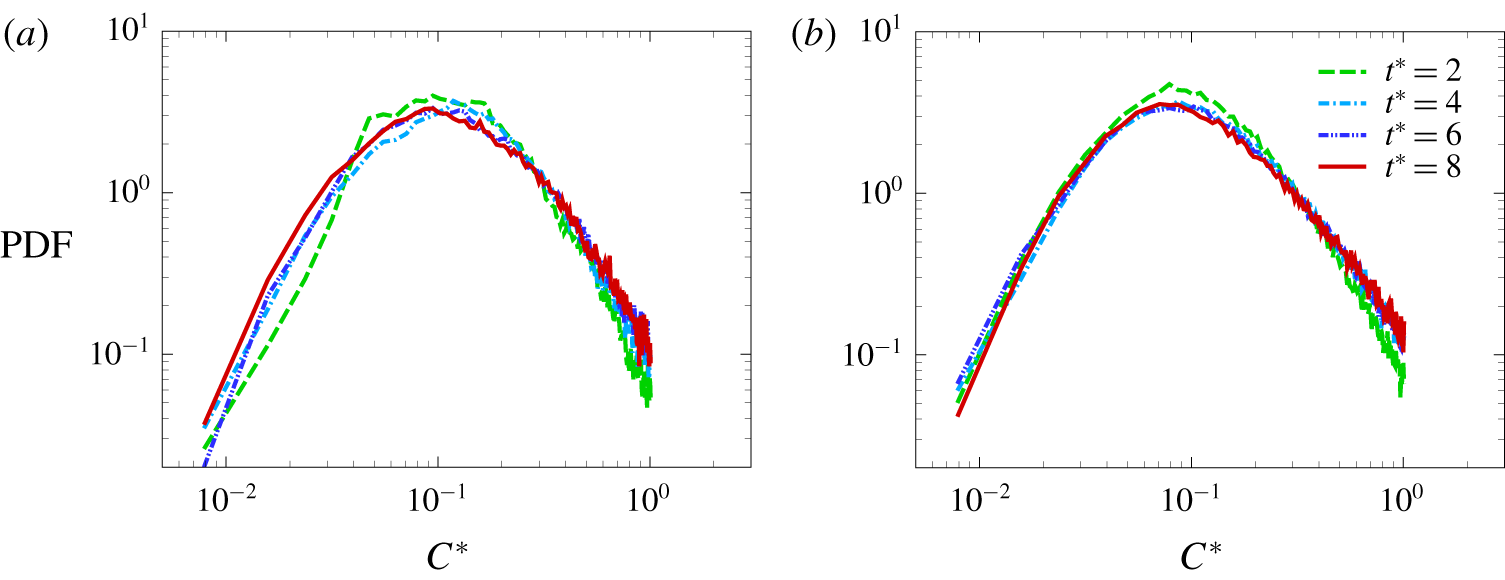
 $C^{\ast }$ in figure 12 indicates that the PDFs at different times almost collapse after reaching the statistically stationary state around
 $t^{\ast }>4$.
The temporal evolution of (a) the ensemble-averaged characteristic curvature and (b) its temporal growth rate of propagating surface elements in non-reacting HIT.

The temporal evolution of PDFs of the normalized characteristic curvature of propagating surfaces in non-reacting DNS: (a) case B and (b) case D.

We denote the truncation time
 $$\begin{eqnarray}T_{\infty }^{\ast }=\lim _{u^{\prime }/S_{L}\rightarrow \infty }T_{s}^{\ast }\end{eqnarray}$$
for  $u^{\prime }/S_{L}\rightarrow \infty$ or material surfaces, which is useful in the modelling of
 $T_{s}^{\ast }$ in § 3.4. We approximate
 $$\begin{eqnarray}T_{\infty }^{\ast }=\underset{t^{\ast }}{\arg \min }\left\{\left|\frac{\text{d}\langle C^{\ast }\rangle (t^{\ast })}{\text{d}t^{\ast }}\right|<\unicode[STIX]{x1D700}_{T}\right\},\end{eqnarray}$$
by  $T_{s}^{\ast }$ from the DNS of propagating surfaces in case E with large
 $u^{\prime }/S_{L}$, where
 $\unicode[STIX]{x1D700}_{T}=0.1\,\%$ is a small threshold. We determine
 $T_{\infty }^{\ast }=5.5$ using (3.14) and it appears to be a universal constant, because the normalized time
 $t^{\ast }$ when
 $\langle C^{\ast }\rangle$ of the material surfaces reaches the stationary state (Girimaji & Pope Reference Girimaji and Pope1990; Girimaji Reference Girimaji1991) can be almost independent of large
 $Re$ owing to the self-similar statistical geometry.
3.4 Modelling of the truncation time
The determination of the truncation time scale  $T_{s}^{\ast }$ in (3.11) is crucial for the modelling of
 $A_{T}/A_{0}$ using Lagrangian statistics of propagating surfaces, which is similar to the critical role of characteristic time scales in statistical turbulence models (see He, Jin & Yang Reference He, Jin and Yang2017). Based on discussions in § 3.3,
 $T_{s}^{\ast }$ is determined when averaged geometric quantities of propagating surfaces reach the statistically stationary state. This state is an analogy to the statistically stationary
 $A_{T}/A_{0}$ of turbulent premixed flames in combustion DNS.
We observe that  $T_{s}^{\ast }$ varies with
 $u^{\prime }/S_{L}$ from the temporal evolution of
 $\langle C^{\ast }\rangle$ in figure 11, so we assume
 $$\begin{eqnarray}T_{s}^{\ast }=F\left(\frac{1}{S_{L}^{\ast }}\right)=F\left(Re^{-1/4}\frac{u^{\prime }}{S_{L}}\right).\end{eqnarray}$$
Next, it is essential to determine the form of function  $F$. Inspired by the modelling approach for the width of a thermal wake in turbulent dispersion (Taylor Reference Taylor1921) and the pressure–rate-of-strain tensor in Reynolds stress models (Launder, Reece & Rodi Reference Launder, Reece and Rodi1975; Pope Reference Pope2000), we first determine
 $F$ at some limiting values of
 $u^{\prime }/S_{L}$ at finite
 $Re$.
As  $u^{\prime }/S_{L}\rightarrow \infty$, propagating surfaces can be considered as material surfaces. According to the discussion in § 3.3, there exists a universal truncation time
 $T_{\infty }^{\ast }$ (3.13) when
 $\langle C^{\ast }\rangle$ reaches the statistically stationary state. If
 $F$ is a smooth function, (3.13) implies that
 $$\begin{eqnarray}\lim _{u^{\prime }/S_{L}\rightarrow \infty }\frac{\text{d}T_{s}^{\ast }}{\text{d}(1/S_{L}^{\ast })}=0.\end{eqnarray}$$
As  $u^{\prime }/S_{L}\rightarrow 0$, we consider a laminar premixed flame with
 $u^{\prime }=0$ and finite
 $S_{L}$. Since the initial planar propagating surface cannot deform, the truncation time is
 $$\begin{eqnarray}\lim _{u^{\prime }/S_{L}\rightarrow 0}T_{s}^{\ast }=0.\end{eqnarray}$$
In weak turbulence with very small  $u^{\prime }/S_{L}$, the dependence of
 $S_{T}$ on
 $u^{\prime }$ can be described by a general power law (e.g. Peters Reference Peters1999; Creta & Matalon Reference Creta and Matalon2011; Lipatnikov Reference Lipatnikov2012)
 $$\begin{eqnarray}\frac{S_{T}}{S_{L}}=1+{\mathcal{C}}\left(\frac{u^{\prime }}{S_{L}}\right)^{\unicode[STIX]{x1D701}},\end{eqnarray}$$
where  ${\mathcal{C}}$ is independent of
 $u^{\prime }$ but may depend on the unburnt mixture composition (Lipatnikov & Chomiak Reference Lipatnikov and Chomiak2002), and
 $\unicode[STIX]{x1D701}$ is an empirical constant.
The first-order Taylor expansion of the modelled area ratio (3.11) with (3.2) for very small  $T_{s}^{\ast }$ and
 $u^{\prime }/S_{L}$ is
 $$\begin{eqnarray}\frac{S_{T}}{S_{L}}=1+\unicode[STIX]{x1D709}T_{s}^{\ast }.\end{eqnarray}$$
This should be consistent with (3.18) at a laminar state with  $Re=1$, so we have
 $$\begin{eqnarray}\lim _{u^{\prime }/S_{L}\rightarrow 0}\frac{\text{d}^{n}T_{s}^{\ast }}{\text{d}(1/S_{L}^{\ast })^{n}}=\frac{{\mathcal{C}}}{\unicode[STIX]{x1D709}}\mathop{\prod }_{m=0}^{n-1}(\unicode[STIX]{x1D701}-m)\left(\frac{u^{\prime }}{S_{L}}\right)^{\unicode[STIX]{x1D701}-n}\end{eqnarray}$$
with an integer  $1\leqslant n\leqslant \unicode[STIX]{x1D701}$. Here, we specify
 $\unicode[STIX]{x1D701}=1$ as the simplest linear model
 $$\begin{eqnarray}S_{T}=S_{L}+{\mathcal{C}}u^{\prime }\end{eqnarray}$$
in weak turbulence, which is generally applicable to various fuels. Then (3.20) is simplified as
 $$\begin{eqnarray}\lim _{u^{\prime }/S_{L}\rightarrow 0}\frac{\text{d}T_{s}^{\ast }}{\text{d}(1/S_{L}^{\ast })}=\frac{{\mathcal{C}}}{\unicode[STIX]{x1D709}}.\end{eqnarray}$$
In order to determine  ${\mathcal{C}}$, we only need a very few sample data points
 $$\begin{eqnarray}G=\{(x_{i},y_{i})=(u^{\prime }/S_{L},S_{T}/S_{L})\mid i\in \{0,1,\ldots ,N_{G}\}\}\end{eqnarray}$$
from existing DNS or experimental measurement of propagating flames in weak turbulence with  $u^{\prime }/S_{L}<\unicode[STIX]{x1D716}_{C}$, where the small threshold value is set to
 $\unicode[STIX]{x1D716}_{C}=2$ and the data point of
 $(x_{0},y_{0})=(0,1)$ at laminar conditions is specified. Then, a least-squared fit is utilized to estimate
 ${\mathcal{C}}$ from
 $G$ as
 $$\begin{eqnarray}{\mathcal{C}}=\frac{\unicode[STIX]{x1D6F4}x_{i}y_{i}-\unicode[STIX]{x1D6F4}x_{i}\unicode[STIX]{x1D6F4}y_{i}/N_{G}}{\unicode[STIX]{x1D6F4}x_{i}^{2}-(\unicode[STIX]{x1D6F4}x_{i})^{2}/N_{G}}.\end{eqnarray}$$
This simple linear fit appears to be more robust than the high-order fit with  $\unicode[STIX]{x1D701}>1$ in (3.18) from very sparse sample data points with finite uncertainties.
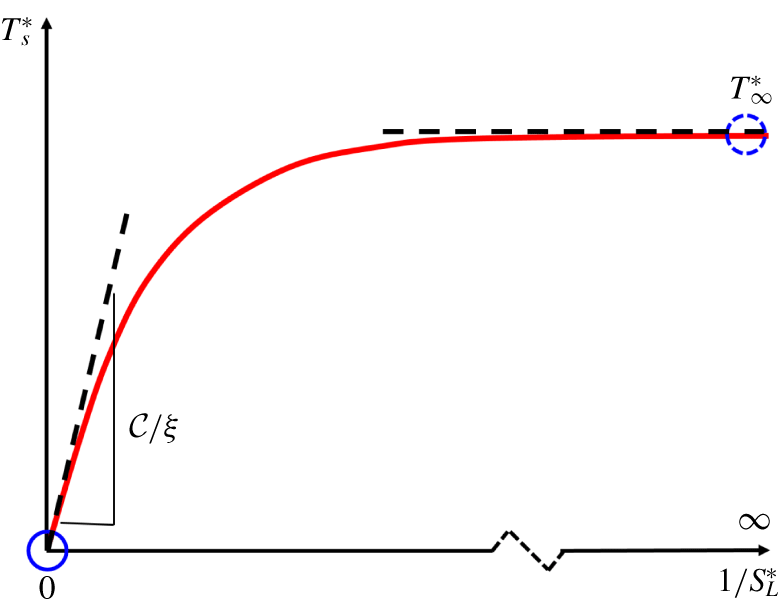
Considering the function  $F$ at all the limiting values above (also sketched in figure 13), we propose a model for the truncation time as
 $$\begin{eqnarray}T_{s}^{\ast }=T_{\infty }^{\ast }\left[1-\exp \left(-\frac{{\mathcal{C}}}{\unicode[STIX]{x1D709}T_{\infty }^{\ast }S_{L}^{\ast }}\right)\right],\end{eqnarray}$$
which satisfies (3.13), (3.16), (3.17) and (3.22), and is a monotonically increasing function in terms of  $1/S_{L}^{\ast }$. It is noted that substituting the first-order Taylor expansion of (3.25) in terms of very small
 $1/S_{L}^{\ast }$ into (3.19) with
 $Re=1$ recovers the linear model (3.21).


3.5 Modelling of the area growth rate
In the modelling of  $A_{T}/A_{0}$ in (3.11), the constant
 $\unicode[STIX]{x1D709}$ needs to be determined by a function of given turbulence or flame parameters. Although
 $\unicode[STIX]{x1D709}_{A}$ grows with time in figure 10, we approximate
 $\unicode[STIX]{x1D709}_{A}$ as a constant effective growth rate
 $$\begin{eqnarray}\unicode[STIX]{x1D709}=\unicode[STIX]{x1D709}_{A}(t^{\ast }=T_{\infty }^{\ast })\end{eqnarray}$$
at the universal truncation time  $T_{\infty }^{\ast }$.
Since the growth of  $A(t^{\ast })/A_{0}$ is independent of
 $Re$, as demonstrated in figure 9(b),
 $\unicode[STIX]{x1D709}$ at large
 $Re$ should be the same for a given mixture composition. For example, we estimate
 $\unicode[STIX]{x1D709}=0.35$ by (3.26) from case E of the DNS of propagating surfaces. In figure 9(b), the comparison of
 $A(t^{\ast })/A_{0}$ from DNS and the model (3.8) with
 $\unicode[STIX]{x1D709}=0.35$ indicates that (3.8) with (3.26) can provide a good approximation for the growth of
 $A(t^{\ast })/A_{0}$.
Furthermore,  $\unicode[STIX]{x1D709}$ may vary with
 $S_{L}^{\ast }$ for the same
 $Re$, so it is necessary to model this possible dependence of
 $\unicode[STIX]{x1D709}$ on different mixture compositions or fuels. By comparing (3.11) and (3.6), we obtain
 $$\begin{eqnarray}\unicode[STIX]{x1D709}T_{s}^{\ast }=\int _{0}^{T_{s}^{\ast }}\langle K_{t}^{\ast }\rangle _{A}+2S_{L}^{\ast }\langle \unicode[STIX]{x1D705}^{\ast }\rangle _{A}\,\text{d}s.\end{eqnarray}$$
Applying the mean value theorem for integrals to (3.27) yields
 $$\begin{eqnarray}\unicode[STIX]{x1D709}={\textstyle \frac{1}{2}}\langle K_{t}^{\ast }(t^{\prime })\rangle _{A}+S_{L}^{\ast }\langle \unicode[STIX]{x1D705}^{\ast }(t^{\prime })\rangle _{A},\quad t^{\prime }\in (0,T_{s}^{\ast }),\end{eqnarray}$$
which indicates an explicit dependence of  $\unicode[STIX]{x1D709}$ on the laminar flame speed.
Considering the independence of  $\unicode[STIX]{x1D709}$ for large
 $Re$, we use DNS case E of propagating surfaces with varying
 $S_{L}$ to fit (3.28). We find that
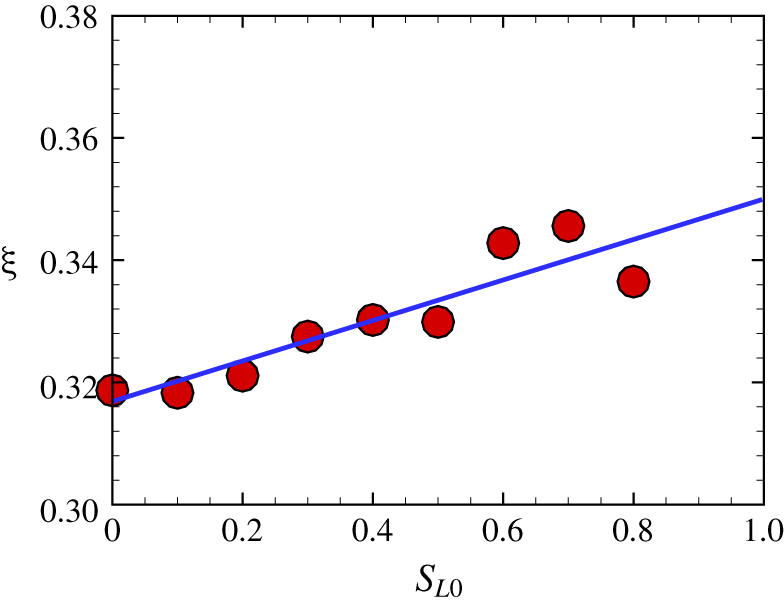
 $\unicode[STIX]{x1D709}=0.33\pm 0.02$ has a weak dependence on
 $S_{L}$ for a range of moderate
 $S_{L}$ in figure 14, where the selection of
 $S_{L}=0\sim 0.8~\text{m}~\text{s}^{-1}$ covers all the
 $S_{L}$ in the combustion DNS series discussed in § 4.1. Since the dependence appears to be linear, we propose an empirical model
 $$\begin{eqnarray}\unicode[STIX]{x1D709}={\mathcal{A}}+{\mathcal{B}}S_{L0}.\end{eqnarray}$$
Here, model coefficients  ${\mathcal{A}}=0.317$ and
 ${\mathcal{B}}=0.033$ are determined by the least-squared fit, and they represent the tangential strain-rate and propagation-curvature effects in (3.28), respectively;
 $S_{L0}=S_{L}/S_{L,ref}$ is a dimensionless laminar flame speed and is normalized by a reference value
 $S_{L,ref}=1~\text{m}~\text{s}^{-1}$.
Modelled area growth rates of propagating surfaces with  $S_{L}=0\sim 0.8~\text{m}~\text{s}^{-1}$ in non-reacting HIT. Circles: results obtained by (3.26) from the tracking of propagating surfaces in case E; solid line: the linear fit (3.29) with
 ${\mathcal{A}}=0.317$ and
 ${\mathcal{B}}=0.033$.

We remark that the model (3.29) can be valid for various fuels with moderate  $S_{L}$, but it may break down for very large
 $S_{L}$. In principle,
 $\unicode[STIX]{x1D709}$ of initial planar propagating surfaces is vanishing as
 $S_{L}/u^{\prime }\rightarrow \infty$, so we speculate that
 $\unicode[STIX]{x1D709}$ may decrease at very large
 $S_{L}$.
3.6 Predictive model of the turbulent burning velocity
Substituting models (3.25) for  $T_{s}^{\ast }$ and (3.29) for
 $\unicode[STIX]{x1D709}$ into (3.11) and using (3.2), we obtain
 $$\begin{eqnarray}\frac{S_{T}}{S_{L}}=\exp \left\{T_{\infty }^{\ast }\left({\mathcal{A}}+{\mathcal{B}}S_{L0}\right)\left[1-\exp \left(-\frac{{\mathcal{C}}Re^{-1/4}}{\left({\mathcal{A}}+{\mathcal{B}}S_{L0}\right)T_{\infty }^{\ast }}\frac{u^{\prime }}{S_{L}}\right)\right]\!\right\}.\end{eqnarray}$$
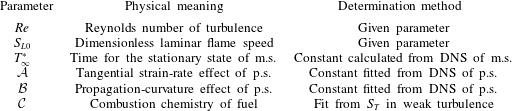
The physical meaning and determination method of the model parameters in (3.30) are summarized in table 3. They are either given turbulence/flame parameters or universal constants pre-determined by Lagrangian statistics of propagating surfaces, except for  ${\mathcal{C}}$ determined by (3.24) from one or a few available data points of
 $S_{T}$ of premixed flames in weak turbulence.
Summary of the model parameters in the proposed model (3.30), where m.s. and p.s. denote material and propagating surfaces in non-reacting HIT, respectively.

The model (3.30) can predict most of the basic trends of  $S_{T}$ summarized in Lipatnikov & Chomiak (Reference Lipatnikov and Chomiak2002). As
 $u^{\prime }/S_{L}\rightarrow 0$ with
 $Re=1$, (3.30) is reduced to the linear model (3.21), so the modelled
 $S_{T}$ increases with
 $u^{\prime }$ and
 ${\mathcal{C}}$ for small
 $u^{\prime }/S_{L}$. The form of (3.30) implies the ‘bending’ of
 $S_{T}/S_{L}$ at moderate
 $u^{\prime }/S_{L}$. As
 $u^{\prime }/S_{L}\rightarrow \infty$ with finite
 $Re$, this model converges to a finite value
 $$\begin{eqnarray}\frac{S_{T}}{S_{L}}=\exp \left[T_{\infty }^{\ast }\left({\mathcal{A}}+{\mathcal{B}}S_{L0}\right)\right].\end{eqnarray}$$
This implies that the modelled  $S_{T}$ depends weakly on
 $u^{\prime }$ and increases with the laminar flame speed at large
 $u^{\prime }/S_{L}$, but it cannot predict the global quenching of flames characterized by a sharp drop of
 $S_{T}/S_{L}$ at very large
 $u^{\prime }/S_{L}$ (e.g. Karpov & Severin Reference Karpov and Severin1978, Reference Karpov and Severin1980; Driscoll Reference Driscoll2008; Lipatnikov Reference Lipatnikov2012). In particular, (3.31) suggests that the assumption in (3.10) with modelled
 $T_{s}^{\ast }$ in (3.25) recovers the finite flame area in high-
 $Re$ turbulence by implicitly accounting for surface annihilation of real flames.
Substituting all the model constants  ${\mathcal{A}}=0.317,{\mathcal{B}}=0.033$ and
 $T_{\infty }^{\ast }=5.5$ calculated from Lagrangian statistics of propagating or material surfaces in non-reacting HIT, we finally obtain a predictive model for the turbulent burning velocity in terms of
 $u^{\prime }/S_{L}$ as
 $$\begin{eqnarray}\frac{S_{T}}{S_{L}}=\exp \left\{\left(1.742+0.182S_{L0}\right)\left[1-\exp \left(-\frac{{\mathcal{C}}Re^{-1/4}}{1.742+0.182S_{L0}}\frac{u^{\prime }}{S_{L}}\right)\right]\right\}.\end{eqnarray}$$
This model is validated in § 4.1 by three DNS data sets of various fuels.
Compared with existing models of  $S_{T}$, the features of the present one are summarized as follows. (i) The Lagrangian history of flame wrinkling is represented by the Lagrangian statistics of propagating surfaces in non-reacting HIT, and is utilized to construct the model. In other words, the model (3.30) not only depends on local values of
 $u^{\prime }$, flow integral property
 $Re$ and flame properties
 $S_{L}$ and
 ${\mathcal{C}}$, but also on the Lagrangian-based parameters
 $T_{\infty }^{\ast }$,
 ${\mathcal{A}}$ and
 ${\mathcal{B}}$. (ii) The
 $Re$-independent profile of
 $A(t^{\ast })$ in terms of the quantities normalized by Kolmogorov scales is used in the modelling procedure, which introduces the universal statistics of propagating surfaces in small-scale turbulence and naturally involves the effect of
 $Re$ on
 $S_{T}$ in terms of integral scales. (iii) All the model parameters are derived via scale analysis and asymptotic analysis, and their values are determined by DNS of propagating surfaces in non-reacting HIT and existing data of
 $S_{T}$ in weak turbulence.
4 Model assessment
4.1 A posteriori test
We assess the model (3.32) of  $S_{T}$ by comparing the model prediction and the results from the present combustion DNS and another two DNS series in the literature (see Lee & Huh Reference Lee and Huh2012; Nivarti & Cant Reference Nivarti and Cant2017) with the same flame configuration in figure 1 but with different fuels and
 $S_{L}$.
The three DNS series of turbulent premixed flames are briefly reviewed below. (i) The present DNS:  $\text{H}_{2}$/air flame with detailed chemistry. (ii) DNS of Nivarti & Cant (Reference Nivarti and Cant2017): CH
 $_{4}$/air flame with the chemistry described using a single-step Arrhenius expression. (iii) DNS (Group T) of Lee & Huh (Reference Lee and Huh2010): the premixed mixture is modelled by a reaction progress variable, and the chemistry is computed by the single-step Arrhenius expression. As shown in figure 2, these three DNS series cover a range of
 $Re$,
 $Ka$ and premixed combustion regimes. All the model parameters in (3.32) are summarized in table 4, where
 ${\mathcal{C}}$ for each case is calculated from one or two corresponding DNS data points of
 $S_{T}$ at
 $u^{\prime }/S_{L}<2$ by (3.24).
Summary of the model parameters in three DNS series with various fuels.

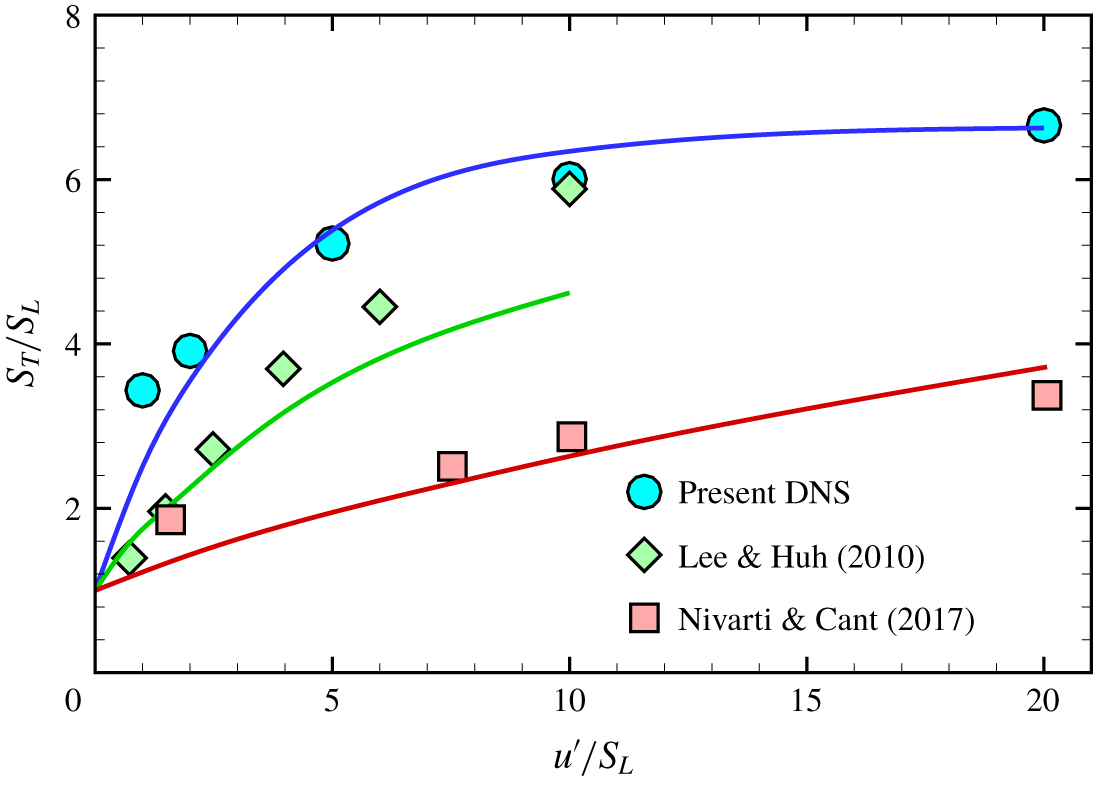
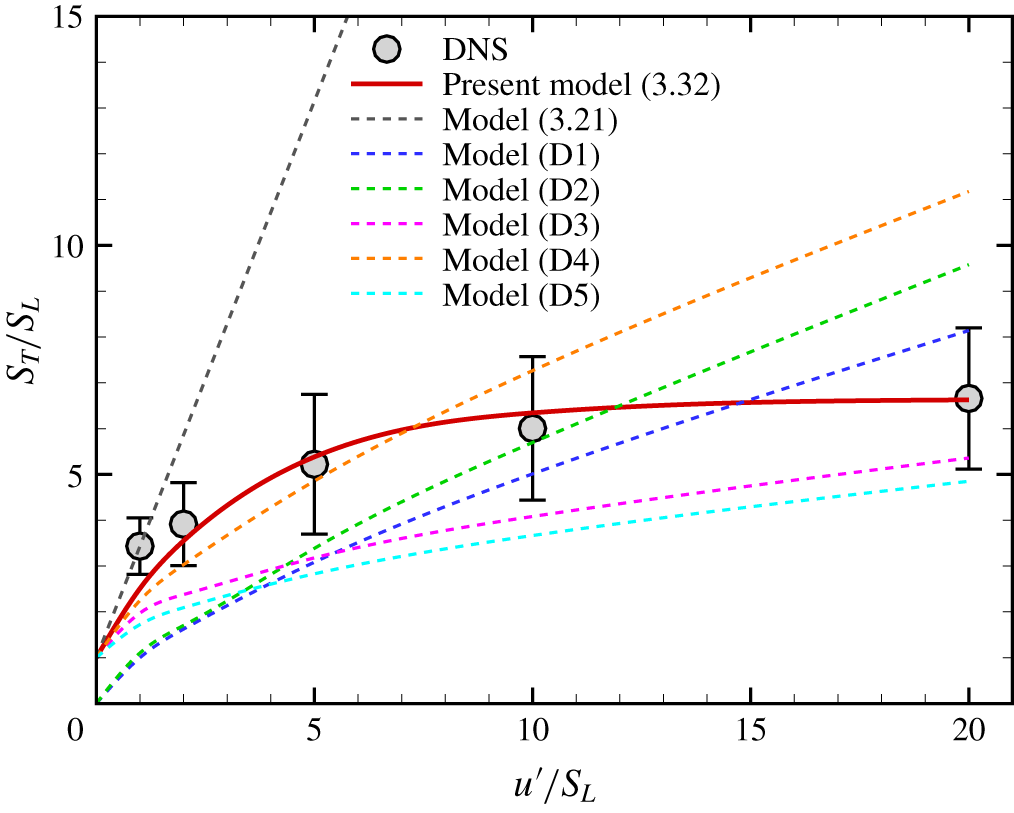
The model (3.32) is validated by combustion DNS of various fuels in figure 15. In general, the model predictions (solid lines) from (3.32) agree well with the DNS results (symbols) and capture the bending of the profile of  $S_{T}/S_{L}$ in terms of
 $u^{\prime }/S_{L}$. The overall good agreement ranges over
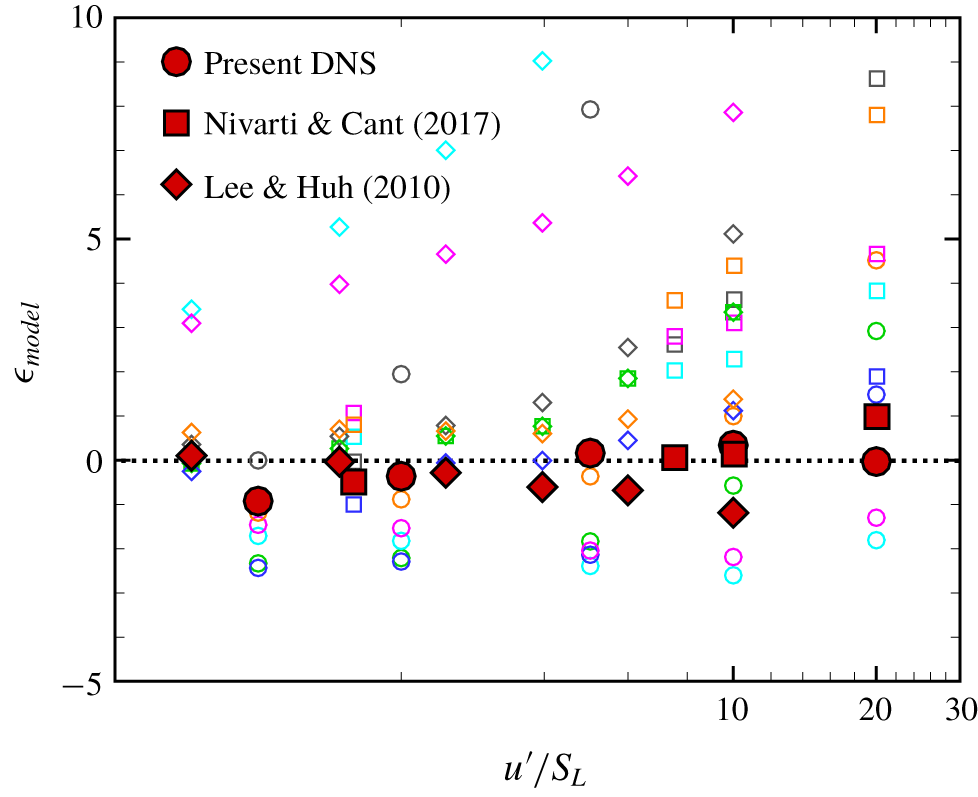
 $0<u^{\prime }/S_{L}\leqslant 20$ and various fuels, indicating the generality of our proposed model. In appendix D, the present model is also compared with other models of
 $S_{T}$ in the three DNS series, and the present one gives the overall best performance. The discrepancies at very large
 $u^{\prime }/S_{L}$ for DNS series of Nivarti & Cant (Reference Nivarti and Cant2017) and Lee & Huh (Reference Lee and Huh2010) are perhaps due to the breakdown of flame fronts close to the broken reaction zone. Moreover, uncertainties of the model constants in (3.30) can result in the discrepancies, which are elaborated below.
Comparison of  $S_{T}$ calculated from the combustion DNS (symbols) and the proposed model (3.32) (solid lines).

First, the value of  ${\mathcal{C}}$ is fuel dependent and relies on available data points of
 $S_{T}$ under weak turbulence. In principle, the linear scaling (3.21) is recovered at
 $u^{\prime }/S_{L}=0$ with
 $Re\sim O(1)$. On the other hand, if only the data points of
 $S_{T}/S_{L}$ with finite
 $u^{\prime }/S_{L}$ and
 $Re>O(1)$ are available,
 ${\mathcal{C}}$ fitted from (3.24) can cause the discrepancy from (3.21) near
 $u^{\prime }/S_{L}=0$ in figure 15.
Furthermore, if there are no available data of  $S_{T}/S_{L}$ for fitting
 ${\mathcal{C}}$, we suggest that the value of
 ${\mathcal{C}}$ can be simply set to
 ${\mathcal{C}}_{0}=2.0$ for hydrogen fuels and
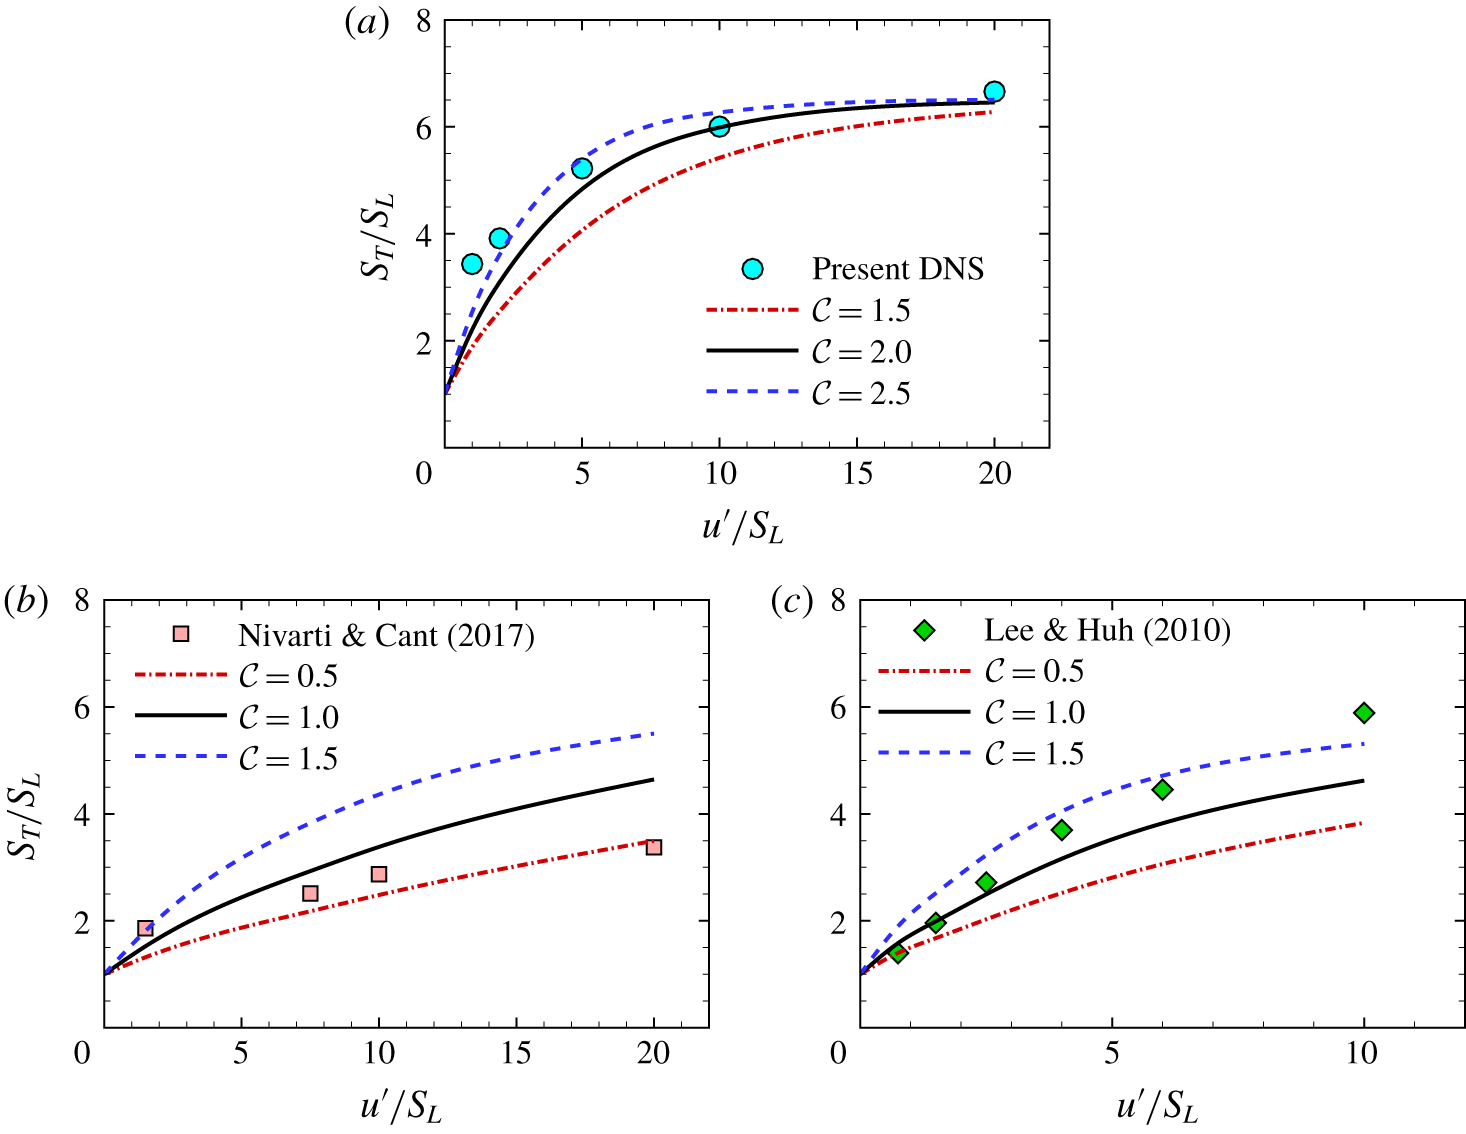
 ${\mathcal{C}}_{0}=1.0$ for other fuels based on the chemical activity of the fuels. We observe the good agreement between the DNS result and the model prediction of (3.32) with the empirical constant
 ${\mathcal{C}}={\mathcal{C}}_{0}$ instead of fitting
 ${\mathcal{C}}$ from data, and illustrate the sensitivity of the model prediction to
 ${\mathcal{C}}$ by varying
 ${\mathcal{C}}={\mathcal{C}}_{0}\pm 0.5$ in figure 16. In general,
 $S_{T}/S_{L}$ predicted from (3.32) increases with
 ${\mathcal{C}}$.
Model predictions of  $S_{T}$ with the model constant
 ${\mathcal{C}}={\mathcal{C}}_{0}$ or
 ${\mathcal{C}}={\mathcal{C}}_{0}\pm 0.5$.

Second, the model constants  ${\mathcal{A}}$,
 ${\mathcal{B}}$ and
 $T_{\infty }^{\ast }$ appear to be universal, but the determination of their values may involve some uncertainties owing to numerical schemes, forcing methods and finite-
 $Re$ effects in the DNS of non-reacting HIT and fitting methods to determine the constants, which can slightly affect the model prediction of
 $S_{T}$.
Although the present  $S_{T}$ model still has some uncertainties and discrepancies owing to the physical assumptions in model development and the lack of rigorous methods for determining
 ${\mathcal{C}}$, generally controlled by combustion chemistry, it is able to predict the relatively accurate bending effect for flames in HIT at large
 $u^{\prime }/S_{L}$ in figures 15 and 16, which is superior to existing
 $S_{T}$ models (see detailed comparisons in appendix D). In particular, the propagating surface used in the model was introduced only for the flamelet regime (see Girimaji & Pope Reference Girimaji and Pope1992), but the present modelling approach appears to extend the concept of propagating surfaces to the thin-reaction-zone regime. The truncation of the area growth by
 $T_{s}^{\ast }$ and the cusp removal of propagating surfaces result in a finite
 $A(T_{s}^{\ast })$, which can model the statistically stationary
 $A_{T}$ under competing mechanisms between the flame area growth and consumption.
4.2 A priori test
In order to further validate the key modelling assumption in (3.10), we assess the contributions to the growth of  $A_{T}$ on the right-hand side of (3.6) by comparing
 $\langle K_{t}^{\ast }(T_{s}^{\ast })\rangle _{A}$ and
 $\langle \unicode[STIX]{x1D705}^{\ast }(T_{s}^{\ast })\rangle _{A}$ of propagating surfaces at the modelled truncation time (3.25) in non-reacting HIT with
 $\langle K_{t}^{\ast }\rangle _{A}$ and
 $\langle \unicode[STIX]{x1D705}^{\ast }\rangle _{A}$ of the isosurface
 $c={\hat{c}}$ at the statistically stationary state in the present combustion DNS. The PDFs of
 $(K_{t}^{\ast })_{A}$ and
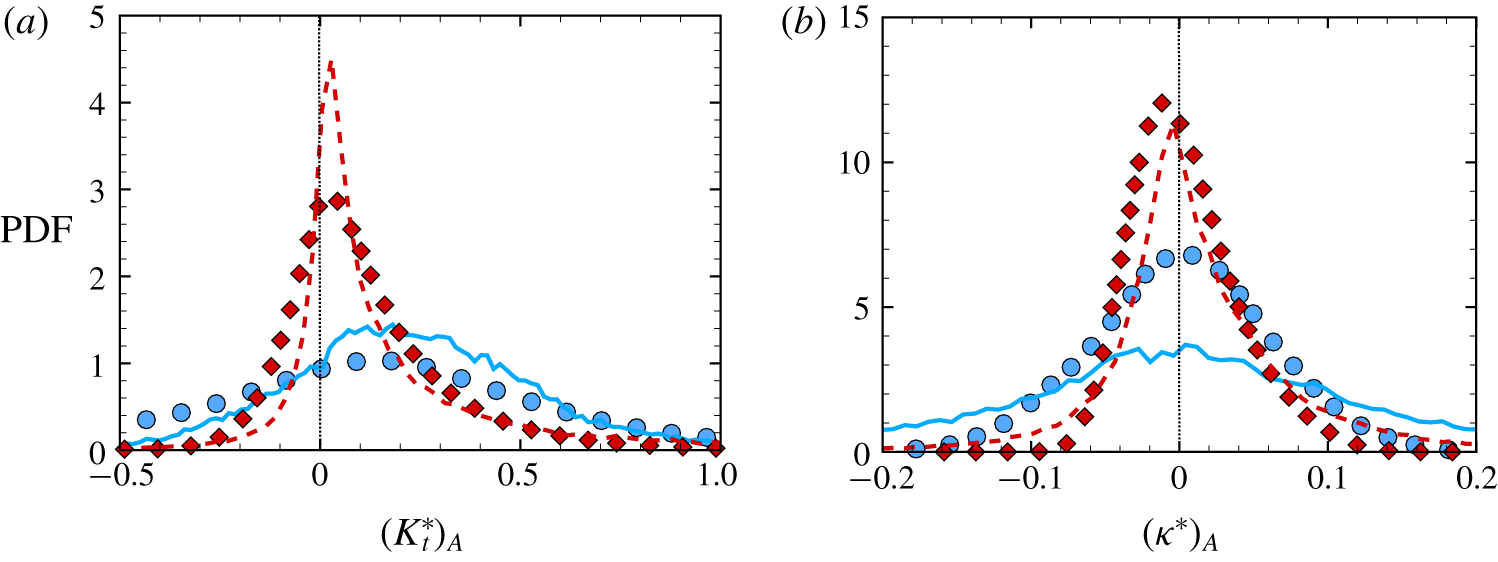
 $(\unicode[STIX]{x1D705}^{\ast })_{A}$ from propagating surfaces and flames in two typical cases B and D are plotted in figure 17. Here, based on (3.5) and the FSD described in appendix A,
 $(f)_{A}=f\unicode[STIX]{x1D6FF}A/(A/N_{s})$ and
 $(f)_{A}=f\unicode[STIX]{x1D6F4}^{\prime }/\unicode[STIX]{x1D6F4}$ denote area-weighted quantities for propagating surfaces and flames, respectively, and
 $\langle f\rangle _{A}$ is equal to the integration of the product of
 $(f)_{A}$ and its PDF in the sample space. Moreover,
 $K_{t}$ and
 $\unicode[STIX]{x1D705}$ in combustion DNS are calculated by (A 2) and (A 3).
PDFs of (a) the normalized area-weighted tangential strain rate and (b) the mean curvature from flames and propagating surfaces in DNS cases B and D. Circles: flame in case B; diamonds: flame in case D; solid lines: propagating surface in case B; dashed lines: propagating surface in case D.

Figure 17(a) indicates that all the cases exhibit positive  $\langle K_{t}^{\ast }\rangle _{A}$, which is consistent with the positive contribution of turbulent straining to the area growth of material surfaces (Girimaji & Pope Reference Girimaji and Pope1990). Similar PDFs of
 $(K_{t}^{\ast })_{A}$ in propagating surfaces and flames imply that the straining process experienced by propagating surfaces in non-reacting HIT resembles that of flames in turbulent combustion.
Figure 17(b) shows that the PDF of  $(\unicode[STIX]{x1D705}^{\ast })_{A}$ of the propagating surfaces is qualitatively similar to that of flames, but the former distribution is generally broader than the latter one. This observation implies that nearly singular propagating surfaces with very large curvatures can be smoothed in real flames owing to diffusion and curvature effects. Furthermore,
 $\langle \unicode[STIX]{x1D705}^{\ast }\rangle _{A}$ of flames is close to zero, which agrees with the former finding (e.g. Trouvé & Poinsot Reference Trouvé and Poinsot1994; Chakraborty & Cant Reference Chakraborty and Cant2005; Nivarti & Cant Reference Nivarti and Cant2017) that the curvature effect can consume the flame area. On the other hand,
 $\langle \unicode[STIX]{x1D705}^{\ast }\rangle _{A}$ of the propagating surfaces is slightly positive and of the order of
 $O(0.01)$. The cellular structures of propagating surfaces in figure 6 with positive
 $\langle \unicode[STIX]{x1D705}^{\ast }\rangle _{A}$ (Zheng et al. Reference Zheng, You and Yang2017) are only observed in turbulent premixed flames at low
 $Ka$ in figure 3 (see Matalon Reference Matalon2009), whereas they break down at high
 $Ka$. This structural difference causes the discrepancy between PDFs of
 $(\unicode[STIX]{x1D705}^{\ast })_{A}$ for propagating surfaces and flames in case D.
5 Conclusions
We propose a predictive model of  $S_{T}$ in premixed combustion in HIT based on the Lagrangian statistics of propagating surface elements in non-reacting stationary HIT. An ensemble of propagating surface elements initially constitute a plane in the non-reacting HIT to mimic the propagation of a planar premixed flame front. The effects of molecular transport and reaction on each surface element is modelled via a constant displacement speed
 $S_{d}=S_{L}$.
The model development involves several assumptions and modelling steps. First,  $S_{T}/S_{L}$ is approximated by the ratio
 $A_{T}/A_{0}$ of flame surface areas from Damköhler’s assumption (3.2). Then,
 $A_{T}/A_{0}$ is approximated by the area ratio
 $A(t^{\ast })/A_{0}$ of global propagating surfaces at the truncation time
 $t^{\ast }=T_{s}^{\ast }$, which signals that the characteristic curvature of initially planar propagating surfaces has reached the statistically stationary state in non-reacting HIT. This state resembles the statistical equilibrium state in combustion between the flame area growth due to turbulent straining and the area consumption due to flame self-propagation. In addition, we demonstrate that the temporal growth of
 $A(t^{\ast })/A_{0}$ can be approximated by an exponential function (3.11) with a constant growth rate which is modelled by a linear function (3.29) of the dimensionless
 $S_{L}$. Accounting for
 $T_{s}^{\ast }$ at limiting conditions of very weak and strong turbulence, we propose the model (3.25) of
 $T_{s}^{\ast }$ by theoretical analysis and tracking of propagating surfaces. Finally, we obtain the predictive model (3.32) of
 $S_{T}$, an explicit expression in terms of
 $u^{\prime }/S_{L}$ and several model parameters. The model parameters include universal constants
 $T_{\infty }^{\ast }$,
 ${\mathcal{A}}$ and
 ${\mathcal{B}}$ calculated from Lagrangian statistics of propagating surfaces in non-reacting HIT, and a fuel-dependent
 ${\mathcal{C}}$ pre-determined by (3.24) from one or a few available combustion DNS or experimental data points of
 $S_{T}$ in weak turbulence.
Being different from other models for  $S_{T}$, the present one incorporates the Lagrangian information of propagating surfaces characterizing the enhancement of the area growth of flames in turbulence and the universal statistics of propagating surfaces in small-scale turbulence involving the effect of
 $Re$. Furthermore, the effect of fuel chemistry on
 $S_{T}$ is also considered by the model parameter
 ${\mathcal{C}}$.
The proposed model (3.32) is validated by an a posteriori test against three DNS series of turbulent premixed flames in HIT, including the present combustion DNS and two in the literature, which have the same flame configuration but different fuels and  $S_{L}$. The model predictions of
 $S_{T}$ generally agree well with DNS results under a broad range of turbulent intensities and premixed combustion regimes. The expression (3.32) of the model implies that it can capture the basic trends of
 $S_{T}$ in terms of
 $u^{\prime }$, i.e. the linear growth in weak turbulence and the bending effect in strong turbulence. Furthermore, the model validity is supported by an a priori test. We calculate PDFs of tangential strain-rate and propagation-curvature terms, which are two major contributions to the surface area growth, and find that the PDFs of each term in flames and propagating surfaces qualitatively agree.
On the other hand, the assumptions in the proposed model and the uncertainties in model constants cause some limitations in the model formulation and discrepancies in the model predictions, which can be improved in future work. (i) Under very strong turbulence (e.g. Aspden et al. Reference Aspden, Day and Bell2011; Wabel et al. Reference Wabel, Skiba and Driscoll2017), the flame can be in the broken reaction zone in which no distinct flame surface exists, so the model assumption (3.2) may be invalid. (ii) The model is developed based on the propagation of a planar flame in HIT, so it may need to be adapted for different flame configurations or geometries (Driscoll Reference Driscoll2008). (iii) The dependence of  $S_{T}$ on pressure (see Lu & Yang Reference Lu and Yang2019), gas expansion and differential diffusion (see Lipatnikov Reference Lipatnikov2012) is not considered in the present model.
Acknowledgements
Y.Y. thanks Z. Ren, Z. Chen, Z. Lu, N. Peng and S. Xiong for helpful comments. We gratefully acknowledge Caltech, the University of Colorado at Boulder and Stanford University for licensing the NGA code used in this work. This work has been supported in part by the National Natural Science Foundation of China (grants no. 91541204, 91841302, and 11925201).
Declaration of interests
The authors report no conflict of interest.
Supplementary material
Supplementary material is available at https://doi.org/10.1017/jfm.2019.1081.
Appendix A. Modelling of the FSD
In the modelling approach of FSD, the generalized local FSD  $|\unicode[STIX]{x1D735}c|$ (Veynante & Vervisch Reference Veynante and Vervisch2002) is employed to calculate the local surface-to-volume ratio
 $\unicode[STIX]{x1D6F4}^{\prime }\equiv |\unicode[STIX]{x1D735}c|$. The generalized FSD
 $\unicode[STIX]{x1D6F4}\equiv \langle \unicode[STIX]{x1D6F4}^{\prime }\rangle _{c={\hat{c}}}$ denotes the surface-averaged
 $\unicode[STIX]{x1D6F4}^{\prime }$ along the isosurface of
 $c={\hat{c}}$, i.e. the flame surface-to-volume ratio in
 $\unicode[STIX]{x1D6FA}$.
The evolution equation of  $\unicode[STIX]{x1D6F4}$ (see Pope Reference Pope1988; Trouvé & Poinsot Reference Trouvé and Poinsot1994) is
 $$\begin{eqnarray}\frac{\unicode[STIX]{x2202}\unicode[STIX]{x1D6F4}}{\unicode[STIX]{x2202}t}+\unicode[STIX]{x1D735}\boldsymbol{\cdot }\left(\langle \boldsymbol{u}+S_{d}\boldsymbol{n}\rangle _{A}\unicode[STIX]{x1D6F4}\right)=\langle K\rangle _{A}\unicode[STIX]{x1D6F4},\end{eqnarray}$$
where  $\boldsymbol{n}=-\unicode[STIX]{x1D735}c/|\unicode[STIX]{x1D735}c|$ denotes the flame normal, and
 $\langle f\rangle _{A}\equiv \langle f\unicode[STIX]{x1D6F4}^{\prime }\rangle /\unicode[STIX]{x1D6F4}$ denotes the area-weighted average of a function
 $f$ over the isosurface of
 $c={\hat{c}}$. On the right-hand side of (A 1), the local flame stretch rate
 $K=K_{t}+2S_{d}\unicode[STIX]{x1D705}$ involves the tangential strain-rate term
 $$\begin{eqnarray}K_{t}=\unicode[STIX]{x1D735}\boldsymbol{u}-\boldsymbol{n}\boldsymbol{n}\boldsymbol{ : }\unicode[STIX]{x1D735}\boldsymbol{u}\end{eqnarray}$$
and the propagation-curvature term  $2S_{d}\unicode[STIX]{x1D705}$ with
 $$\begin{eqnarray}\unicode[STIX]{x1D705}=\frac{\unicode[STIX]{x1D735}\boldsymbol{\cdot }\boldsymbol{n}}{2}.\end{eqnarray}$$
These expressions in Eulerian coordinates are consistent with the Lagrangian formulation in (2.6). The turbulent flame area can be obtained by integrating the local FSD as
 $$\begin{eqnarray}A_{T}=\int _{\unicode[STIX]{x1D6FA}}\unicode[STIX]{x1D6F4}^{\prime }\unicode[STIX]{x1D6FF}(c-{\hat{c}})\,\text{d}V.\end{eqnarray}$$
Since the turbulent burning velocity can be modelled by (3.2) with (A 4),  $S_{T}$ is generally increased with
 $u^{\prime }/S_{L}$ due to the increasing integration of the FSD throughout the flame brush (Nivarti & Cant Reference Nivarti and Cant2017), but the growth of
 $S_{T}$ can slow down or
 $S_{T}$ can even decrease for large
 $u^{\prime }/S_{L}$ if the clear flame front is destroyed in very strong turbulence, as shown in case E in figure 3.
Appendix B. Effects of non-constant  $S_{d}$ on the area growth of propagating surfaces

In the DNS of propagating surfaces in non-reacting HIT, the constant displacement speed  $S_{d}=S_{L}$ can be modified by including the effects of flame stretch. From the asymptotic theory, the first-order correction term for small curvature and strain rate is added as (Peters Reference Peters2000; Matalon Reference Matalon2009)
 $$\begin{eqnarray}S_{d}=S_{L}-{\mathcal{L}}K=S_{L}(1-MaKaK^{\ast }),\end{eqnarray}$$
where the Markstein number  $Ma={\mathcal{L}}/\unicode[STIX]{x1D6FF}_{L}$ denotes the ratio of the Markstein length
 ${\mathcal{L}}$ to the laminar flame thickness
 $\unicode[STIX]{x1D6FF}_{L}$ and measures the sensitivity of the flame speed to the local flame stretch. For the
 $\text{H}_{2}$/air mixture with the equivalence ratio
 $\unicode[STIX]{x1D719}=0.6$ in the present combustion DNS, we obtain
 $Ma=-0.18$ (see Davis & Searby Reference Davis and Searby2002).
To investigate the effects of non-constant  $S_{d}$, (B 1) is applied to (2.2) in the tracking of propagating surfaces in non-reacting HIT. The PDFs of
 $S_{d}$ of propagating surfaces are evaluated at the truncation time and are compared with the combustion DNS data. Here, the displacement speed of the flame front, i.e. the isosurface of
 $c={\hat{c}}$, is calculated by (Pope Reference Pope1988)
 $$\begin{eqnarray}S_{d}=\frac{\dot{\unicode[STIX]{x1D714}}_{c}+\unicode[STIX]{x1D735}\boldsymbol{\cdot }\left(\unicode[STIX]{x1D70C}D_{c}\unicode[STIX]{x1D735}c\right)}{\unicode[STIX]{x1D70C}|\unicode[STIX]{x1D735}c|},\end{eqnarray}$$
where  $\dot{\unicode[STIX]{x1D714}}_{c}$ and
 $D_{c}$ denote the reaction rate and the diffusivity of the progress variable in combustion DNS, respectively.
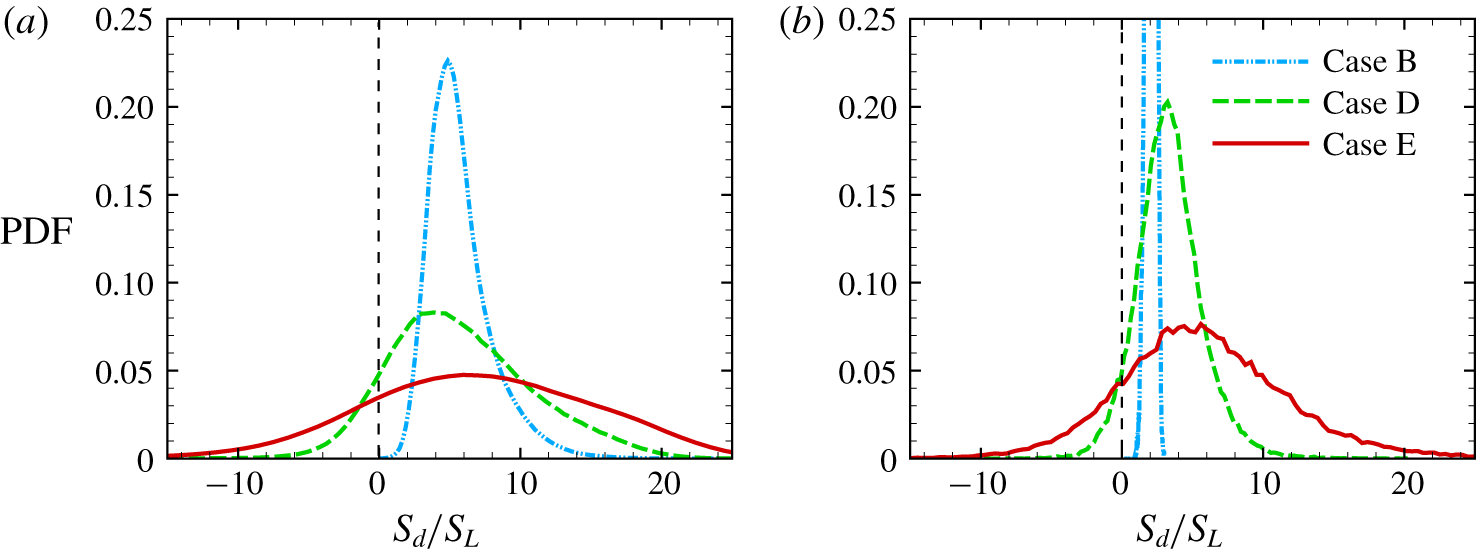
In case B with small  $u^{\prime }$, we observe that
 $S_{d}$ is always positive from both combustion DNS and propagating surfaces. In cases D and E with larger
 $u^{\prime }$, the variance of
 $S_{d}$ increases due to the increased turbulent fluctuations experienced by the reaction layer, and the probability of negative
 $S_{d}$ becomes higher, consistent with previous DNS results (Nivarti & Cant Reference Nivarti and Cant2017). The PDFs of
 $S_{d}$ from combustion DNS and propagating surfaces are qualitatively similar, which partly validates the model (B 1).
PDFs of the displacement speed for (a) flames in combustion DNS and (b) propagating surfaces in non-reacting DNS in cases B, D and E.

The evolutions of  $A(t)/A_{0}$ of the propagating surfaces with constant and non-constant
 $S_{d}$ are compared in figure 19. We find that the surface area ratios are almost identical, so the effect of non-constant
 $S_{d}$ of (B 1) on the prediction of
 $A_{T}/A_{0}$ using propagating surfaces appears to be negligible and we only use constant
 $S_{d}=S_{L}$ in the model development.
The comparison of surface area ratios of propagating surfaces with constant  $S_{d}$ (symbols) and non-constant
 $S_{d}$ (lines) in cases A–E (from right to left).

Appendix C. Characteristic curvature of propagating surfaces
The governing equation of  $C^{\ast }$ can be derived from (2.4) as (see Girimaji & Pope Reference Girimaji and Pope1992)
 $$\begin{eqnarray}\frac{\text{d}C^{\ast }}{\text{d}t^{\ast }}=u_{3,\unicode[STIX]{x1D6FC}\unicode[STIX]{x1D6FD}}^{\ast }g_{\unicode[STIX]{x1D6FC}\unicode[STIX]{x1D6FD}}-(K_{t}^{\ast }+2s_{\unicode[STIX]{x1D6FC}\unicode[STIX]{x1D6FD}}^{\ast }g_{\unicode[STIX]{x1D6FD}\unicode[STIX]{x1D6FE}}g_{\unicode[STIX]{x1D6FE}\unicode[STIX]{x1D6FC}})C^{\ast }+S_{d}^{\ast }g_{\unicode[STIX]{x1D6FC}\unicode[STIX]{x1D6FD}}g_{\unicode[STIX]{x1D6FD}\unicode[STIX]{x1D6FE}}g_{\unicode[STIX]{x1D6FE}\unicode[STIX]{x1D6FC}}{C^{\ast }}^{2},\end{eqnarray}$$
where  $g_{\unicode[STIX]{x1D6FC}\unicode[STIX]{x1D6FD}}=h_{\unicode[STIX]{x1D6FC}\unicode[STIX]{x1D6FD}}/C^{\ast }$ is the normalized curvature tensor of unit norm. Taking the ensemble average over
 $N_{s}(t)$ surviving surface elements in (C 1) yields
 $$\begin{eqnarray}\frac{\text{d}\langle C^{\ast }\rangle }{\text{d}t^{\ast }}=b_{1}+b_{2}\langle C^{\ast }\rangle +b_{3}\langle C^{\ast }\rangle ^{2},\end{eqnarray}$$
where  $b_{1}$,
 $b_{2}$ and
 $b_{3}$ denote the bending, straining and propagation terms, respectively. The bending term initiates curvature on an initially planar surface, then straining and propagation effects take over. The propagation term can cause a cylindrical surface with a finite initial curvature to develop a singularity. Since
 $b_{1}$,
 $b_{2}$ and
 $b_{3}$ are functions of a statistically stationary Eulerian velocity
 $\boldsymbol{u}$ and a tensor
 $g_{\unicode[STIX]{x1D6FC}\unicode[STIX]{x1D6FD}}$ of unit norm, they can be expected to be stationary random variables (Girimaji & Pope Reference Girimaji and Pope1992).
We qualitatively analyse the exact solution to (C 2) by assuming that  $b_{1},b_{2}$ and
 $b_{3}$ are constants. Since in general the turbulent straining motion produces positive mean strain rate and increases the curvature of surfaces, statistically, the stretching coefficient
 $b_{2}$ is negative from (C 1). The surface elements are initially planar, so the initial condition for (C 2) is
 $\langle C^{\ast }(0)\rangle =0$.
For material surface elements with  $b_{3}=0$, we have
 $$\begin{eqnarray}\langle C^{\ast }(t^{\ast })\rangle =\frac{b_{1}}{b_{2}}(\exp (b_{2}t^{\ast })-1),\end{eqnarray}$$
with  $\lim _{t^{\ast }\rightarrow \infty }\langle C^{\ast }(t^{\ast })\rangle =b_{1}/|b_{2}|$. For propagating surfaces, we discuss solutions based on the discriminant
 $b_{2}^{2}-4b_{1}b_{3}$. If
 $b_{2}^{2}-4b_{1}b_{3}=0$, then we have
 $$\begin{eqnarray}\langle C^{\ast }(t^{\ast })\rangle =\frac{b_{2}^{2}t^{\ast }}{2b_{3}(2-b_{2}t^{\ast })},\end{eqnarray}$$
with  $\lim _{t^{\ast }\rightarrow \infty }\langle C^{\ast }(t^{\ast })\rangle =|b_{2}|/(2b_{3})$; if
 $b_{2}^{2}-4b_{1}b_{3}\equiv {\unicode[STIX]{x1D6E5}_{I}}^{2}>0$, then we have
 $$\begin{eqnarray}\langle C^{\ast }(t^{\ast })\rangle =2b_{1}\frac{\exp (\unicode[STIX]{x1D6E5}_{I}t^{\ast })-1}{b_{2}+\unicode[STIX]{x1D6E5}_{I}-(b_{2}-\unicode[STIX]{x1D6E5}_{I})\exp (\unicode[STIX]{x1D6E5}_{I}t^{\ast })},\end{eqnarray}$$
with  $\lim _{t^{\ast }\rightarrow \infty }\langle C^{\ast }(t^{\ast })\rangle =2b_{1}/(\unicode[STIX]{x1D6E5}_{I}-b_{2})$; if
 $4b_{1}b_{3}-b_{2}^{2}\equiv {\unicode[STIX]{x1D6E5}_{II}}^{2}>0$, then we have
 $$\begin{eqnarray}\langle C^{\ast }(t^{\ast })\rangle =\frac{-b_{2}+\unicode[STIX]{x1D6E5}_{II}\tan \left[{\displaystyle \frac{\unicode[STIX]{x1D6E5}_{II}}{2}}t^{\ast }-\arctan \left({\displaystyle \frac{b_{2}}{\unicode[STIX]{x1D6E5}_{II}}}\right)\right]}{b_{3}},\end{eqnarray}$$
where  $\langle C^{\ast }(t^{\ast })\rangle$ is periodic in time but always finite.
This qualitative analysis implies that the solution to (C 2) is finite as  $t^{\ast }\rightarrow \infty$, which supports the occurrence of the stationary state of
 $\langle C^{\ast }\rangle$ shown in figure 11.
Appendix D. Comparison of model predictions of $S_{T}$

We compare the model predictions of  $S_{T}$ among the present model and some existing models listed below.
(i) Linear model (3.21) with
${\mathcal{C}}$ listed in table 4.(ii) Model suggested by Klimov (Reference Klimov1983):
(D 1)$$\begin{eqnarray}S_{T}=C_{K}{u^{\prime }}^{0.7}S_{L}^{0.3}\quad \text{with}\;C_{K}=1.\end{eqnarray}$$(iii) Model suggested by Zimont & Mesheriakov (Reference Zimont and Mesheriakov1988):
(D 2)$$\begin{eqnarray}S_{T}=C_{Z}u^{\prime }Da^{1/4}\quad \text{with}\;C_{Z}=1.\end{eqnarray}$$(iv) Model suggested by Bradley (Reference Bradley1992):
(D 3)$$\begin{eqnarray}\frac{S_{T}}{S_{L}}=1+0.95Le^{-1}\left(\frac{u^{\prime }}{S_{L}}\frac{l_{t}}{\unicode[STIX]{x1D6FF}_{L}}\right)^{1/2},\quad \text{with}\;Le=1.\end{eqnarray}$$(v) Model suggested by Kawanabe et al. (Reference Kawanabe, Shioji, Tsunooka and Ali1998):
(D 4)$$\begin{eqnarray}\frac{S_{T}}{S_{L}}=1+1.25\left(\frac{u^{\prime }}{S_{L}}\right)^{0.7}.\end{eqnarray}$$(vi) Model suggested by Peters (Reference Peters1999):
(D 5)$$\begin{eqnarray}\frac{S_{T}}{S_{L}}=1+\frac{0.39}{2}\frac{l_{t}}{\unicode[STIX]{x1D6FF}_{L}}(\sqrt{1+20.5/Da}-1).\end{eqnarray}$$


Most of these models involve arbitrarily adjustable or empirical constants, and these model constants are tuned to give the best prediction of  $S_{T}$ for the present combustion DNS. The comparison is provided in figure 20.
Comparison of  $S_{T}$ calculated from the present combustion DNS, the present model and various existing models. The error bar denotes the standard deviation of
 $S_{T}/S_{L}$ in the DNS.

We observe that the linear model is only valid for very small  $u^{\prime }$. All the other existing models can predict the trend of bending at moderate
 $u^{\prime }$, but they have significant discrepancies from the DNS result, either over- or under-predictions, because these models may only be valid for certain flame/turbulence parameters and flame geometry/boundary conditions. Additionally, most of the existing models imply that
 $S_{T}/S_{L}\rightarrow \infty$ as
 $u^{\prime }/S_{L}\rightarrow \infty$, which fails to capture the increasing bending of
 $S_{T}/S_{L}$ owing to frequent local extinctions at very high
 $Re$.
We remark that the variation of instantaneous  $S_{T}$ is large in the present combustion DNS from the error bars in figure 20, although the mean
 $S_{T}$ from the present DNS has been averaged over 20 large-eddy turnover times. Previous DNS studies of turbulent premixed flames (e.g. Aspden et al. Reference Aspden, Day and Bell2011; Savard & Blanquart Reference Savard and Blanquart2015) also observed a notable uncertainty of
 $S_{T}$ owing to the unstable flame and the finite size of the computational domain. Thus, small discrepancies between the model prediction and DNS result should be acceptable owing to the uncertainties in the DNS result.
To further compare model performances in all the three DNS series, we define the model discrepancy as
 $$\begin{eqnarray}\unicode[STIX]{x1D716}_{model}=\frac{S_{T}^{model}-S_{T}^{DNS}}{S_{L}},\end{eqnarray}$$
where  $S_{T}^{model}$ and
 $S_{T}^{DNS}$ are obtained from models and DNS, respectively. In figure 21, the present model provides consistently good predictions for a wide range of
 $u^{\prime }$ and various fuels, whereas other model predictions are very scattered with notable model discrepancies.
Comparison of the discrepancies from various model predictions of  $S_{T}$ in three DNS series. Symbols denote different DNS series. Circles: the present DNS, diamonds: Nivarti & Cant (Reference Nivarti and Cant2017), squares: Lee & Huh (Reference Lee and Huh2010). Colours denote different models. Red: the present model (3.32), grey: model (3.21), blue: model (D 1), green: model (D 2), magenta: model (D 3), orange: model (D 4), light blue: model (D 5). The dotted line denotes
 $\unicode[STIX]{x1D716}_{model}=0$.