Introduction
It is now official: “the UK housing market is broken”.Footnote 1 Among the G7 countries, the UK has had the largest rise in house prices relative to average disposable income since 1970, and particularly pronounced since 1997. The consequent housing affordability problem is revealed by a rise in ‘concealed households’, or family units without their own home. It is estimated, based on the Labour Force Survey, that the number of concealed households in the UK rose by 50 per cent in the past decade, from 1.6 million in 1996, to 2.5 million households in 2016. In London, the number of concealed households rose by over 80 per cent in the same period, from 400,000 to 720,000 households.Footnote 2 Dramatic falls have occurred in the rates of owner-occupation, particularly for younger households. The IFS estimates that 65 per cent of those aged 25–34 years, and with incomes in the middle quintile for their age, owned their own homes in 1995–6; and that figure fell to just 27 per cent by 2015–16. The result is increased pressure in the rental sector. Indeed, the record low level in voids reported by the Association of Residential Letting Agents since 2010 suggests severe excess demand in the private rental sector. By contrast, comparable vacancy data for the rental market in the US suggest a ‘normal’ vacancy rate that is three times as large as in the UK. These housing pressures have had huge consequences for both tenants and the public purse. The Housing Benefit bill rose in real terms between 1997–8 and 2011–12 by 67 per cent in London, by 61 per cent in the rest of the South East, and by 51 per cent in Great Britain as a whole. Since then, severe cuts in the generosity of Housing Benefit (HB), as documented by the Resolution Foundation Intergenerational Commission (2018b),Footnote 3 have reduced the expense to the taxpayer but at the cost of increased financial stress for many tenants.
Structural failures of public policy towards housing have resulted in the above symptoms of the ‘broken housing market’. One of the wider consequences is the rise in inequality between the different generations in the UK, described in the final report of the Resolution Foundation Intergenerational Commission (2018c). Local house prices now tend to reflect more heavily the access to public goods such as good transport, education and a healthy environment. Therefore, the more restricted access to housing has caused an increase in social exclusion for those without wealthy parents. There are consequences too for the macroeconomy, of lower productivity and growth, and the greater vulnerability of the UK's many debt-laden households and of the financial system as a whole.
Comparisons of the UK's housing market with those of other countries shows that the UK's experience is far from inevitable, but is the self-inflicted consequence of several policy failings. The Anglo-German comparison has been of long-standing interest, see Muellbauer (1992), and the contrast is a particularly stark one. For instance, the ratio of German house prices to average disposable household income was on a declining trend between 1970 and 2010; even after the recent boom, this ratio is close to its levels in the mid-1990s, and well below its 1980 levels. What was true in 1992, remains true, and sets the agenda for this paper: “Factors which account for the different behaviour of Anglo and German housing markets are economic growth, demography, inflation, real interest rates, structural differences in the provision of mortgage credit, the financial liberalisation which occurred in Britain, and the differences in tax regimes, in the provision and regulation of rented housing and in the system of land use planning. A comparative analysis of these factors “helps to explain substantial parts of the differences in macro-economic behaviour between Britain and Germany” (Muellbauer, 1992).
This paper explains and exploits the differences between the institutions, policies and outcomes in Anglo-German housing markets to draw policy lessons for resuscitating the UK housing market. The factors driving house prices in these two housing markets are explained in Section 2. Section 3 highlights the institutional differences in housing, especially in credit extension, rental markets and planning regulation. The consequent link between financial stability, household debt and balance sheets in the two countries is contrasted in Section 4. Section 5 considers the impact of the different housing markets on monetary policy transmission, economic performance and inequality. Section 6 emphasises the role of ‘path dependence’ in how culture and political and social history have shaped housing and related institutions, and this can hamper institutional change. Section 7 proposes a reform agenda.
2. What drives real house prices in the UK and Germany?
The supply – the stock of housing – is assumed to be given in the short run. Then housing prices are determined by the inverted demand curve, that is, by the stock of housing and by the factors driving the demand for housing. Let the log of housing demand, h, be given by:

where hp is the real housing price, y is real income and z represents other demand shifters. The own-price elasticity of demand is –α, and the income elasticity is β. Solving for the housing price, hp, yields:

Note that forecast simulations of housing prices for this simple model would require a residential investment equation and assumptions for future income, interest rates and credit availability. An advantage of the inverted demand function approach (i.e. expressing price as a function of quantity and the other factors shifting demand) is that it is well grounded theoretically, unlike many ad hoc approaches. In addition, we have strong priors regarding the values of the key long-run elasticities, corresponding to the ‘central estimates’ set out in Reference MeenMeen (2001). For example, many estimates of the income elasticity of demand suggest that β is in the region of 1, in which case the income and housing-stock terms in the above equation simplify to a single term: the log of income per house, i.e. (ln y – ln h). Then the elasticity of housing prices with respect to income, given the stock of housing, is 1/α; this is typically substantially above 1 since the own-price elasticity, α, is below 1. The elasticity of house prices with respect to the stock of housing is −1/α.Footnote 4
The demand shifters included in the vector z cover a range of drivers including the mortgage interest rate, credit conditions, demography, income growth expectations and ‘user cost’. The ‘user cost’ takes into account that durable goods deteriorate, but may appreciate in price and incur an interest cost of financing as well as tax.
The above is a stylised steady state account. In practice, one needs to allow a dynamic adjustment process of house prices around the medium-run solution given by equation (2). Furthermore, it neglects the spatial heterogeneity examined in Reference Cameron, Muellbauer and MurphyCameron et al. (2006), one implication of which is that where housing is built matters for average prices. Spatial mismatch then tends to make the aggregate house price index higher than otherwise.
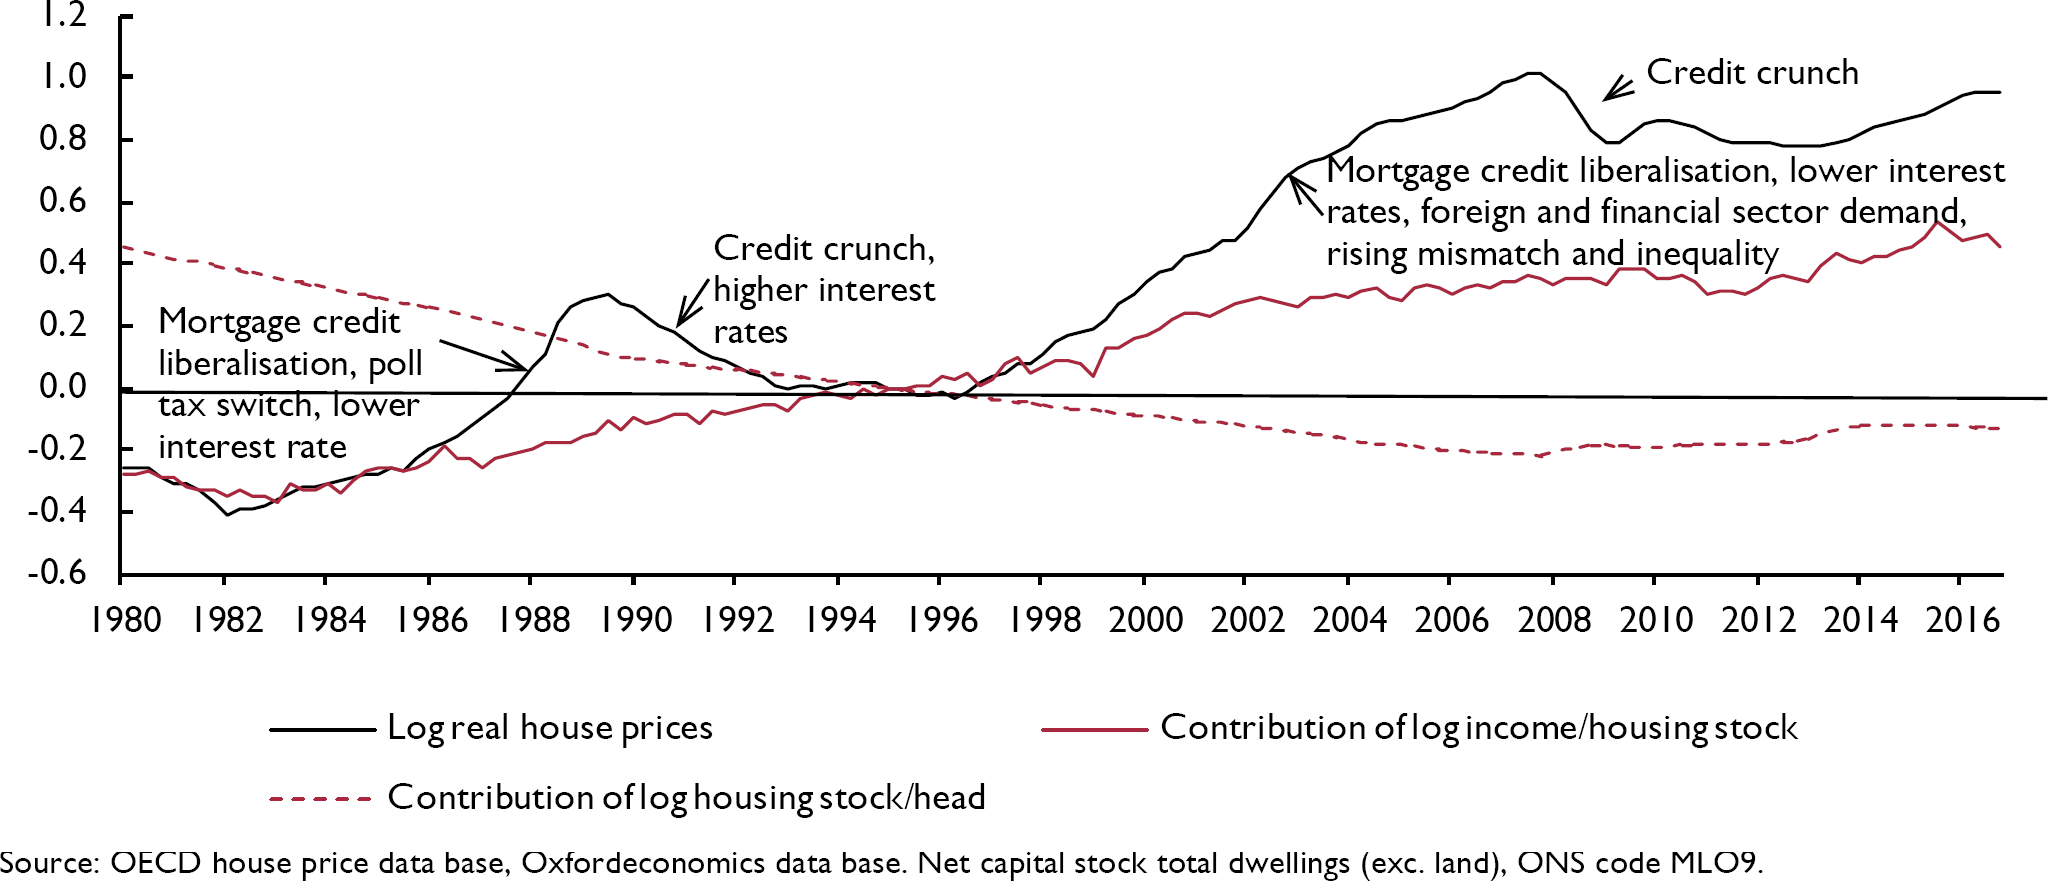
Figure 1 summarises the main drivers of real UK house prices. The black line is the log of the real house price index. The continuous red line measures the contribution of the key demand-supply imbalance, ‘income per house’, which combines real household income and population relative to the housing stock.Footnote 5 The housing stock is not a count of heterogeneous units but is the constant price measure of the net capital stock for all dwellings from the national accounts. It therefore includes improvements in dwellings as well as new residential construction. The figure shows that since 1980, around two thirds of the rise in the UK real house price index is accounted for by the failure of residential investment to keep up with income and population growth. Measuring since 1997 when New Labour came to power, close to half of the rise in house prices can be attributed to inadequate residential investment. The dashed red line measures the effect of the per capita housing stock on the real price index; since 2008, residential investment has not even kept pace with population. The difference between the red and dashed red lines reflects the impact of higher real per capita income on real house prices and indicates that before 2008 income growth was more important than population growth for housing demand.
Key drivers of UK real house prices

As the notations on the figure make plain, other factors were important also. These included two phases of liberalisation in mortgage credit: one in the 1980s, see Reference Fernandez-Corugedo and MuellbauerFernandez-Corugedo and Muellbauer (2006);Footnote 6 and one after 1997, including the easing of credit conditions for buy-to-let investors and increased use of securitisation and short-term money market finance by mortgage lenders in the 2000s. A colossal policy blunder in the 1980s was the abolition of the local property tax ‘Domestic Rates’, at the height of the house price and credit boom, and their replacement by the Poll Tax in 1990.Footnote 7 A final policy twist was the announcement by Chancellor Nigel Lawson, in March 1988, that tax relief on mortgage interest, previously available to each of the borrowers in a shared purchase, would be restricted to one per property from August 1988. This led to a brief frenzy of demand and a further price spike as buyers piled in trying to beat the deadline. Sharp rises in interest rates followed to deal with the overheated economy.
Interest rates provide another factor affecting real house prices and these fell for parts of the period. Demand by foreign investors, especially of trophy homes in London, increased in the 2000s. Spatial mismatch has almost certainly become more intense, with a tendency for the level of planning permissions to be low in high demand locations. It seems plausible that the increase in income inequality in the 1980s, especially in the upper part of the distribution, also contributed to the rise in real house prices.
The figure also indicates some temporary reversals. For example, higher interest rates from 1989 were followed by a credit crunch, and another credit crunch precipitated by the global financial crisis from 2008 has been only partly relaxed.Footnote 8
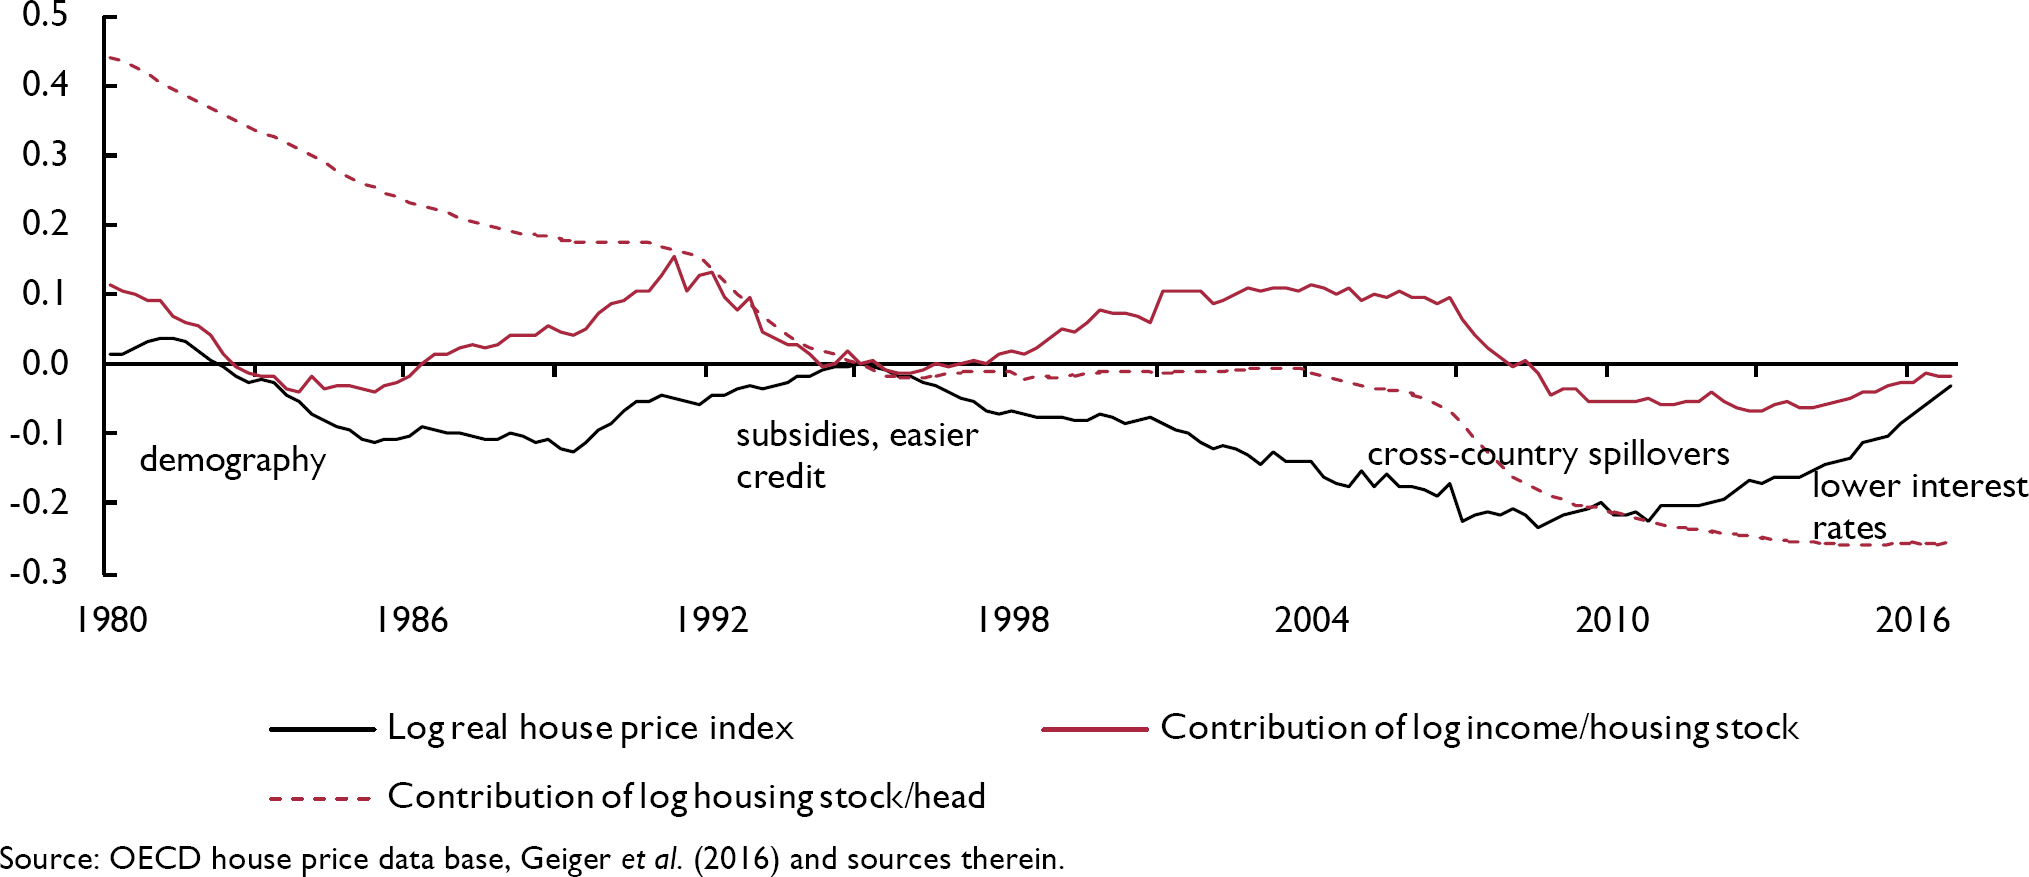
The contrasts with Germany, illustrated in figure 2, are striking. The German graph assumes a value of 1.3 for 1/α, estimated in Reference Geiger, Muellbauer and RupprechtGeiger et al. (2016), lower than the value of 1.8 assumed for the UK.Footnote 9 Around two thirds of the fall in real German house prices from 1980 to 2010 (the black line) is due to the fall in income per house (the red line). In other words, German residential investment more than matched income and population growth – the obverse of the UK situation.
Key drivers of real house prices in Germany

There were other factors in Germany. One is demography, since a falling birth rate, reflected in the decline in the child/adult ratio, particularly in the 1980s, weakened housing demand. The absence of mortgage market liberalisation in the 1980s meant there was no bad loans hangover in the early 1990s, unlike in the UK. Although after unification in 1990, mortgage credit became more easily available, the shifts were far smaller than in the UK.Footnote 10 The real estate building boom ended around 1996, as real estate problems in the former East Germany became visible. Bad loans built up and house price falls in other locations increased reluctance to lend well into the 2000s, which helps explain some of the weakness of house prices before 2009.Footnote 11
German financial regulation has always been stringent and lending practices are conservative. Loan-to-value ratios are still capped at about 80 per cent, even with a second mortgage, and income tests remain stringent. With mainly fixed-rate mortgages, home equity withdrawal through mortgage refinancing is scarcely seen. This fact, together with cultural and other institutional factors, such as differences in the pension system, helps explain the deep differences in household behaviour and household balance sheets, which are discussed in Section 4.
3. Institutional differences in land supply, tenure and taxation
The contrast in levels of residential investment between Germany and the UK since 1980 was made plain in figures 1 and 2, but the differences extend back even further. Between 1951 and 2014, Germany built twice as many new homes as the UK (IPPR, 2016)). One factor behind the different rates of house-building is differences in the use of planning regulations, both for planning gain and for the realisation of homes which have planning permission. In Germany, the local authorities cap land values at pre-permission prices at the time planning permission is granted, giving public authorities the right to acquire land for infrastructure at a reasonable cost. This process allows the authorities to capture part of the ‘planning gain’ to fund infrastructure. This planning gain can be as large as ten-fold. By contrast, in the UK, it is the landowner who receives the planning gain, which on greenfield land can be as much as 200-fold. The UK has a cumbersome procedure to try to claw back a small part of the planning gain to help fund social housing and infrastructure.Footnote 12 There is also a sharp contrast in the realisation of actual homes being built after permission is granted. For instance, in 2014, Germany permitted the building of 285,000 homes of which 86 per cent were built; in the UK for the same year, 261,000 homes were permitted of which only 48 per cent were built (IPPR, 2016).Footnote 13
An important factor influencing the rate of housebuilding derives from contrasts in the structure and behaviour of the building industry in the two countries. In the UK, developers are mainly land speculators who hope to buy land at lower price than they later sell it on for, sometimes having added bricks, cement and glass. Profits on land banks help drive share prices in the house-builders. There has been increasing concentration in the industryFootnote 14 and there are now fewer than 3000 small- and medium-sized builders, who account for about 25 per cent of building – whereas in 1988 there were 12,000 such companies. Further, monopoly power and expected land price appreciation increase the incentives to hold back land supply, and help explain low build-out rates after planning permission in the UK. In Germany, small and medium-sized builders build 50 per cent of homes. Very large companies (with 250+ employees) only build 22 per cent of homes. A stable market incentivises long-termism, quality, customer service and access to credit. It seems likely that the far lower volatility of German land and house prices allows smaller builders, who can cope less well with volatility, to flourish.
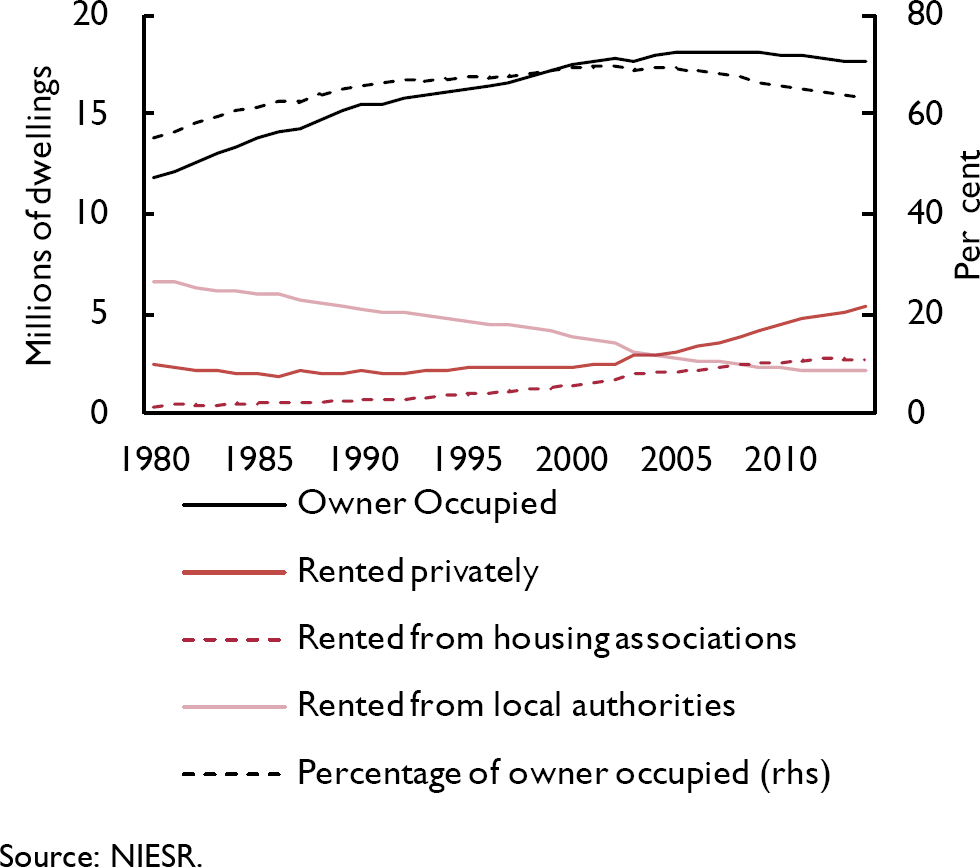
Turning from land supply to tenure, there are also strong and telling contrasts in the rental markets between the two countries. The private rental sector in Germany is over twice as large as the UK's. There has been a slight upward drift among older age groupsFootnote 15 but owner occupation is still below 50 per cent. By contrast, there have been major changes in the size of the rented sector the UK (figure 3). In the UK, owner-occupation was 32 per cent in 1953. By 1961, 42 per cent of tenures were owner-occupied, 34 per cent privately rented and 24 per cent socially rented. Inflation and rent controls were discouraging landlords, even more so in the high inflation 1960s and 70s, and moreover, mortgage interest tax relief favoured owner-occupation. From 1980, the building of social housing fell and following an electoral pledge of Mrs Thatcher to encourage a property-owning democracy, a large-scale sell-off to tenants of the social housing stock began, at discounts of up to 50 per cent. This proved a major reason for the further rise in owner-occupation. The percentage of owner-occupation with a mortgage peaked in the early 1990s and started to decline notably in the 2000s.Footnote 16
Housing tenure in the UK

The age structure is balanced for renters in Germany, but is disproportionately young in the UK. Small-scale landlords dominate ownership in both countries (a bit more so in UK). UK rental contracts are mostly ‘assured short-hold tenancies’ with a security of tenure for a minimum of six months, though more usually twelve months. The average duration of rental contracts is 2.5 years, though less in London. By contrast, the German contracts underpin indefinite tenancies and the average duration of rental contracts is eleven years. This long tenure greatly supports social cohesion and stability. Flexible rent controls in Germany restrict the scale of rent increases during a tenancy. Landlords can set rents for new tenancies. The flexibility is very important for sustaining the sector because, by contrast, fixed rent controls are known to have failed in many countries, including the UK. However, the 2015 Mietpreisbremse brought in local rent ceilings in high pressure areas. Standards of quality and repair and the recourse tenants have against unsatisfactory landlords are relatively high in Germany. And in any event, building regulations in Germany for such things as fire safety and insulation have long been tougher than in the UK. Energy-saving refurbishment of the housing stock supported by subsidies and regulation has been a major policy objective in Germany, see Reference Power and ZulaufPower and Zulauf (2011) on lessons the UK could learn.
Finally, we turn to contrasts in property taxation between the two countries. There are three types of taxes: the transactions tax paid by the purchaser, the capital gains tax paid by the vendor, and regular annual tax payments paid by owner-occupiers (and sometimes renters) based in some way on the value of homes. To summarise, German transactions taxes are somewhat lower than in the UK;Footnote 17 capital gains tax applies for owner-occupiers if the property is sold within ten years, which discourages speculation in contrast to the UK, and local property tax rates are far lower than in the UK. In the UK, the annual property tax changed from Domestic Rates based on 1973 valuations to the Poll Tax under Mrs Thatcher in 1990, which was more or less the same for every property and paid by renters as well as owner occupiers, and was then changed to the Council Tax in 1993, after protests helped bring about the demise of Mrs Thatcher's tenure as Prime Minister. Council Tax is still based on 1991 valuations. The German equivalent is the Grundsteuer, based on 1964 (1936 in the former East Germany) valuations. There are higher rates on second homes. According to the OECD, in 2015 the German local property tax raised just 0.46 per cent of total tax revenue in contrast to 4.8 per cent raised by the UK's Council Tax.
The Council Tax is both highly regressive and inefficient. The highest tax rates are paid on the poorest housing. The most expensive housing pays no more than moderately expensive houses. There is Council Tax Relief for poor families: but this results in poverty trap problems with high effective marginal tax rates discouraging work. There are discounts for second homes and for single people. The result is an inefficient use of space in desirable locations, and it encourages conversion of multi-family dwellings into single luxury mansions, reducing housing supply. The poorest local authorities tend to set highest rates to compensate for their lower tax base and often higher needs.Footnote 18
However poorly designed are UK property taxes, it is hard to argue that they have contributed to relatively high housing prices in the UK compared to Germany when property tax revenue is so much higher in the UK. Differences in the land supply and credit market regimes are much more plausibly the key.
4. The link between financial stability, household debt and balance sheets
The US sub-prime crisis, which triggered the global financial crisis, began with a serious problem of overvaluation of asset prices, especially of housing. The consequence of overvaluation eventually is falling house prices. Falling house prices reduce residential investment and lower consumer spending in countries where housing collateral is an important driver of consumption, such as the US and the UK. Falling house prices increase bad loans and lower the capital of financial firms. This raises risk spreads in credit markets and impairs the ability of banks to extend credit. This feeds back further on residential investment and household spending, increasing unemployment and reducing GDP, which further reduces the demand for housing and the capital of financial firms. Such feedback loops involve non-linearities as well as amplification. For example, a fall in house prices that drives up the incidence of negative equity can, via bad loans, cause a sharper contraction in credit availability than the expansion of credit availability caused by an equivalent rise in house prices. In the upswing of the cycle, though the degree of amplification is less, similar feedback loops operate, though of course in a positive direction.
Extrapolative expectations can be another amplification mechanism. The role of user cost, which measures the interest cost of borrowing relative to expected appreciation, in the demand for durable goods such as housing has long been studied. There is now much evidence that market participants often tend to extrapolate past rates of appreciation in forming expectations of appreciation to come. Then a series of positive shocks, for example in access to credit or in falling interest rates, increasing the rate of appreciation of house prices, later generates a fall in user cost, increasing the demand for housing and feeding back onto house prices. Since lower down-payment ratios enhance the returns from a housing investment financed by a mortgage, this kind of over-shooting in house price dynamics is likely to be greater in countries where low down-payment ratios are prevalent and time varying as loan conditions are eased.Footnote 19 Such amplifying feedbacks also exacerbate downturns of the cycle after prices have started falling.
Negative feedbacks can also be generated during a house price boom, so much depends on their size and on timing. One instance of such a feedback on prices stems from a build-up in debt levels since high debt levels limit spending and access to further credit. A second negative and persistent feedback arises if there are large expansions in housing stocks, which then weigh down on house prices. Examples include Ireland, Spain and parts of the US in 2000–2006, where oversupply remained a problem for several years. A third negative feedback via aggregate demand occurs in economies in which high down-payment ratios are required of mortgage borrowers: then saving rates of would-be home-owners increase when house prices rise relative to income. Such negative feedbacks would be stabilising if they operated quickly enough or were not overwhelmed by the amplifying feedbacks, that can boost the upswing in that phase of the financial cycle.
These considerations are highly relevant to comparing the UK with Germany. The evidence from Reference Aron, Duca, Muellbauer, Murata and MurphyAron et al. (2012) is that the UK and US both have strong, time-varying housing collateral effects on consumption, which amplify the upswing, while Reference Geiger, Muellbauer and RupprechtGeiger et al. (2016) find the opposite for Germany: given high down-payment requirements and a low rate of owner-occupation, in the aggregate, German households tend to save more when house prices rise. The absence of a significant user cost effect in the German house price equation in Reference Geiger, Muellbauer and RupprechtGeiger et al. (2016) is consistent with relatively low degrees of leverage and contrasts with the opposite found for the UK by Reference Muellbauer and MurphyMuellbauer and Murphy (1997). Conservative lending practices in Germany reduce the probability of negative equity and financial stress on households when negative shocks arrive, so dampening the feedbacks that can operate via bad loans and credit spreads. Fixed rate loans in Germany make households less at risk in rising interest rate environments. The high proportion of variable rate mortgages in the UK, though a problem after 1989 when rates rose, did prove helpful in the global financial crisis by making monetary policy particularly powerful in the UK.
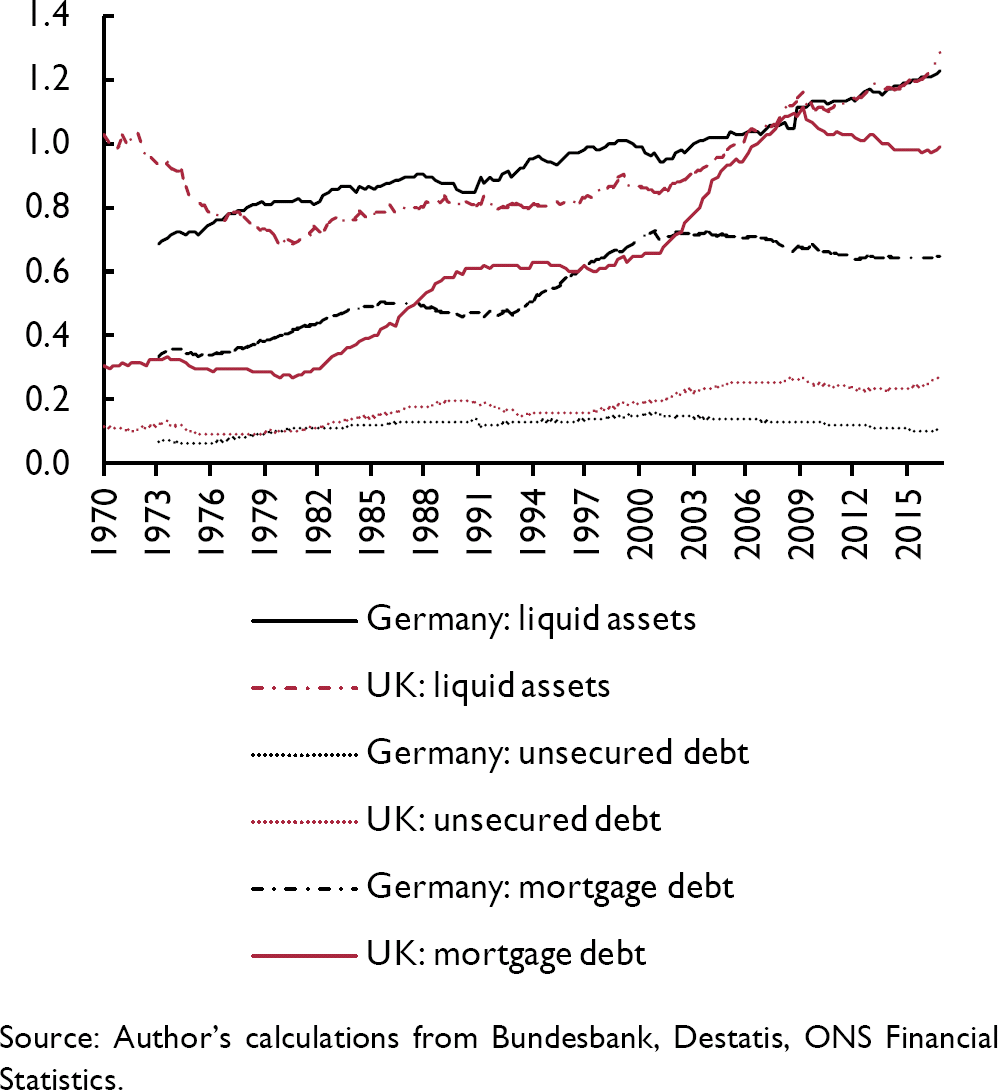
It is instructive to compare the structure of aggregate household balance sheets in the two countries. Figure 4 compares levels of debt and of liquid assets. German households have comparable ratios to income of liquid assets such as bank and saving deposits, but far lower levels of unsecured debt, and, at least in the 2000s, lower levels of mortgage debt. Indeed in the 2000s, the ratio to income of liquid assets minus debt in Germany, which has always been positive, grew even larger. In contrast, in the UK, it turned negative until deleveraging after the financial crisis caused a return to positive levels. This has important consequences for the effect of interest rates on consumption. Indeed, conditional on assets prices and income, evidence from Geiger et al. suggests a small positive effect from higher real interest rates on aggregate consumption.
Ratios to household income of liquid assets and unsecured and secured debt

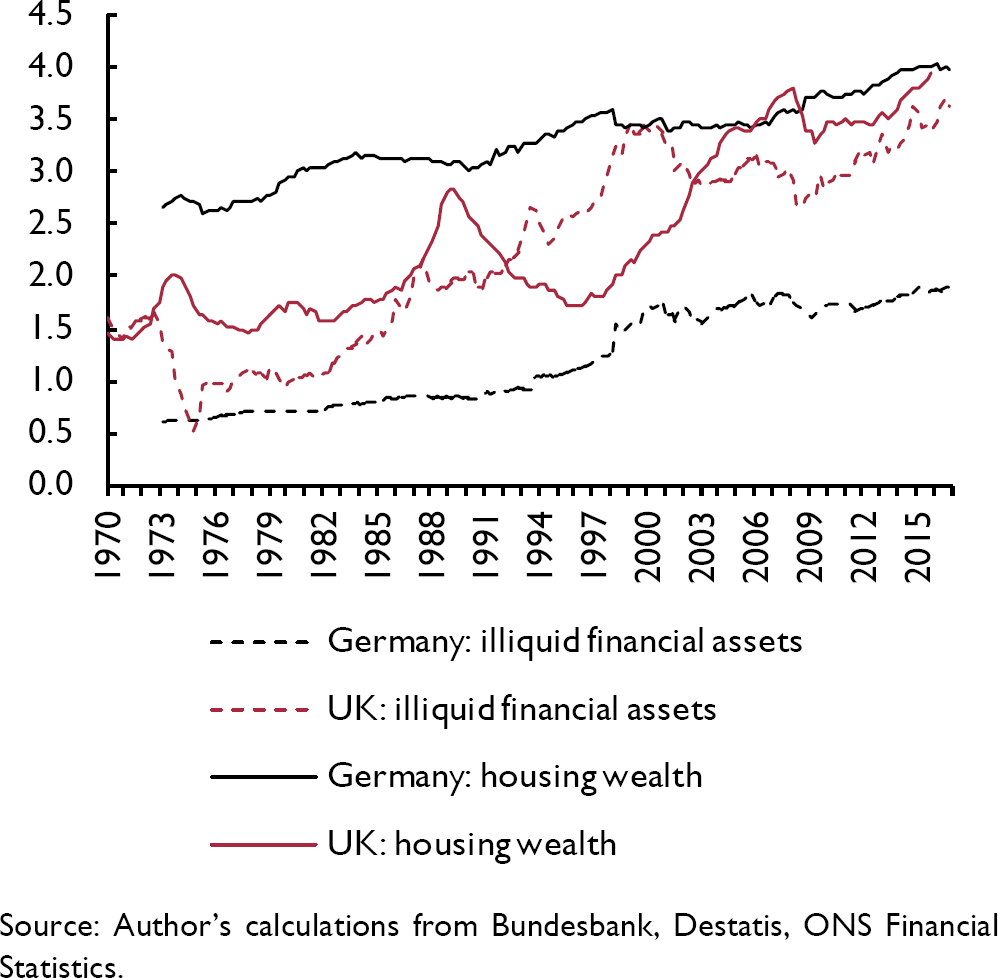
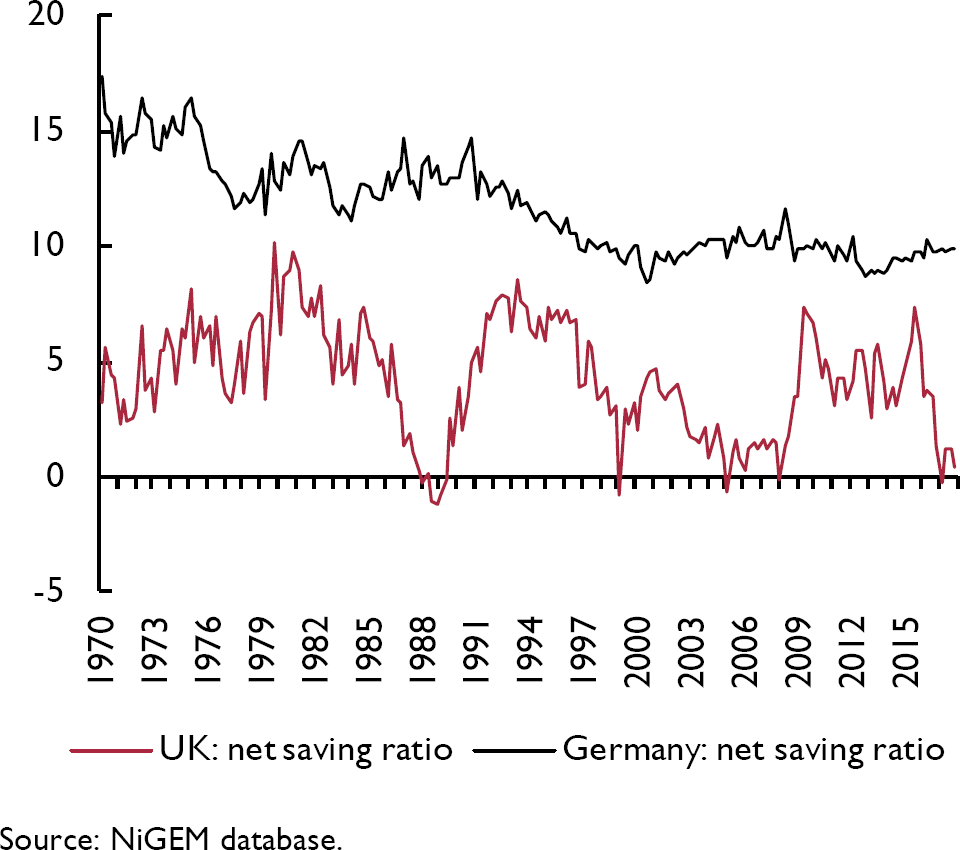
Figure 5 compares ratios to income of illiquid financial assets, including stock market wealth and pensions, and of housing wealth owned by households. With a still largely pay-as-you-go pension system, and far lower levels of stock market participation, German households have roughly half the illiquid financial asset to income ratio of UK households. The relative housing wealth to income ratios are perhaps more surprising: to put it simply, in aggregate, German households own a lot of housing wealth because of residential investment, though much of it is the rental stock owned by household investors. UK households own a lot of housing wealth because house prices are so high – note the rise between 1997 and 2007. Most of it is owner-occupied, though with the buy-to-let boom since 1997, the investor proportion has increased. The sensitivity of UK consumption to asset prices, both of illiquid financial assets and of housing, and to credit supply shocks and variations in interest rates, shows up in far greater cyclical volatility of the household saving ratio, see figure 6. This makes the UK economy particularly vulnerable to higher interest rates. The far lower level of the saving ratio in the UK is also notable, and is reflected in the higher levels of UK debt relative to income seen in figure 4 and the generally lower levels of housing wealth relative to income, seen in figure 5. One might well ask how UK households have managed to accumulate so much gross wealth compared to German households despite the low saving ratio. Part of the answer is that they also have more debt. They have also gained from house price appreciation, as noted above, and from long periods of positive stock market returns, given the UK tendency towards funded pensions and higher stock-market participation than in Germany.
Ratios to household income of illiquid financial assets and housing wealth

Contrasts in the household saving ratio

5. Implications for monetary policy transmission, productivity, growth and competitiveness
In the UK, there is a powerful and rapid transmission of higher interest rates set by the Bank of England to the finances of households, given their mainly floating rate mortgage debt. With higher rates, the cash flows of debtors fall, and as UK household debt levels are high relative to bank and saving deposits, this implies a clear overall negative effect on household spending. Higher interest rates tend to reduce house prices, reducing spending through the channel of home equity withdrawal. Higher interest rates also lower stock market prices and income growth prospects (both exacerbated by a more appreciated Sterling exchange rate), with further negative effects on spending.
In Germany by contrast, since liquid assets substantially exceed household debt, higher interest rates tend to have positive net effect on aggregate consumer spending, given income and asset prices. The stock market wealth effect on spending is smaller than in the UK given lower German participation in the stock market, as reflected in the differences in the ratios to income of illiquid financial assets seen in figure 5. The housing wealth effect on spending when house prices fall, works in reverse, as explained in Section 4. However, it also operates more slowly as there are mainly fixed rate mortgages in Germany. The effects of higher interest rates on spending via the exchange rate and via business investment operate in the conventional direction in both economies. But the overall effects on spending will be considerably weaker than in the UK. Reference Maclennan, Muellbauer and StephensMaclennan et al. (1998) pointed to the problems for monetary union of such differences, a key argument for the UK not adopting the euro.
In both countries there are multiple channels that connect housing market institutions with productivity growth. In the UK, far more than in Germany, the fraction of total bank loans secured on mortgages has risen greatly since 1980. Since much of the extra lending has gone into higher house prices rather than volumes of housing, UK finance has been diverted from more productive uses. Planning restrictions in the UK have also constrained the location of new business investment and its responsiveness to new opportunities, and the regional mobility of domestic labour. Immigrants willing to live in poor housing have, to some extent, helped business to overcome the constraints. But high transactions taxes for house purchases have impeded household choice and hence labour mobility,Footnote 20 and have increased the burdens of commuting.
Productivity growth in the wider economy tends to be enhanced by high levels of investment. There is a two-way relationship between investment and growth. Low levels of UK house-building through supply constraints have contributed to a slower rate of economic growth; and simultaneously the poorer economic growth of the aggregate economy has held back aggregate investment in the UK, outside of housing. This has reduced productivity growth in the UK. A second channel is through poor productivity growth within the housebuilding industry itself. The speculative nature of the industry has promoted high levels of concentration in the industry, which, as noted in section 3, helps explain low build-out rates after planning permission in the UK. It also tends to reduce productivity growth, for the following reasons. The volatility of prices for housing and residential land increases the investment risks for house-builders. The high fraction of land costs in UK house-building means that builders need to take on higher levels of debt, which increases risk. In Germany, working capital, in the form of materials and labour input, is a higher fraction of overall costs and is more easily financed from turnover without high debt levels. Given fairly stable land prices, German builders tend to focus on containing costs, and delivering quality and maintaining reputation. In the UK, much of management time is spent on trying to acquire land cheaply in a time-consuming process involving local authorities and planners, and in debt and risk management by building out slowly. Most of the return from house-building in the UK comes from capital gains on land, as explained in section 3. Productivity in providing a quality housing product is not the major focus of management.
Higher housing costs in the UK make it an expensive place to do business, another factor tending to impede investment – unless a more depreciated exchange rate compensates for this. Germany has gained competitive advantages in the Eurozone from its lower housing costs, which is one factor contributing to the divergences in unit labour costs between the member countries. However, this has contributed to the imbalances between Germany and other Eurozone members.
6. ‘Path dependence’ in the shaping of housing institutions: a thumb-nail sketch
Lessons from Germany for institutional reform in the UK housing market need to be tempered by noting the importance of history and culture in the different countries. Attitudes towards property ownership are shaped partly by the recent history of the returns to housing investment. High returns on housing investment in the UK since 1970 account for much of the British ‘taste’ for home-ownership, while low returns before the recent boom have influenced German tastes towards life-long rental tenure. Years of contrary return developments might be required before these ‘tastes’ gradually change.
Going back almost a century to the aftermath of the First World War, a German phobia of inflation and a thirst for sound finance was strongly influenced by the hyperinflation of 1921–4. With attention to price stability by the postwar Bundesbank, and sound finance by Germany's bank regulators, inflation has remained subdued – even after the oil shocks of the 1970s. The low inflation and flexible nominal rent controls, have allowed Germany to avoid the decimation of landlords suffered by Britain, Italy and Spain, which partly explains the low rates of owner-occupation in these countries. The differences in the respective inflation histories also helps to explain the mainly fixed rate mortgages in Germany versus the prevalence of floating rate mortgages in the UK. Cultural differences have roots that may go back even further. Reference EichelEichel (2015) traces such influences back to the Reformation of 1517; she argues for the profound influence of Lutheranism on Germany in the 19th century. Lutherans are less individualistic than Calvinists; they should work for their community, where work (Beruf) becomes a calling (Berufung). Profit without work is suspect and saving is a moral imperative, which even has a manifestation in language: in German, debt (Schulden) is associated with guilt or fault (Schuld). The Prussian welfare state has Lutheran roots, and an example is in the collective nature of the (PAYGO) German pension system. This has lowered the incentive to invest individually in private pensions and helps explain the lower ratio to income of illiquid financial assets in German household balance sheets (figure 5).
At the risk of over-simplification, Britain's relatively free-trading, individualistic, profit-seeking culture may be rooted in the shaking off of the yoke of the Catholic Church under Henry VIII. Britain's navy for a time ‘ruled the world’, and British merchants (and speculators) made the City of London culturally powerful. The industrial revolution began in Britain and free-trading industrial interests challenged the land-owning aristocracy in the 19th century (for example, in the abolition of the Corn Laws). The elites feared popular pressure to extend the voting franchise, initially restricted to property owners, and saw extension of property ownership as a bulwark to protect against socialist, populist revolution. The favourable tax treatment of owner-occupation by governments in the postwar years can be seen in a similar light. Later, Mrs Thatcher's granting of ‘right-to-buy’ to tenants in council housing and boosting share ownership explicitly also aimed to help create a ‘property-owning democracy’.
7. A reform agenda for the UK housing market
A set of reforms influencing the UK housing market could yield great long-term benefits for the UK. The principal reforms would apply in four areas: to the structure of property taxation; to policies that govern land release, and the planning and the funding of infra-structure and of affordable housing; to the regulation of the rental sector; and indirectly, to the regulation of pensions.
The first reform is to property tax. A radical reform of property taxation makes economic sense and could be more acceptable politically than tinkering at the edges, by adding a few more bands to Council Tax, for example. This is especially so with the need to broaden the tax base to fund the growing expense of the NHS in an ageing population. Since most wealth is held by older people, expanding and reforming property taxation is particularly appropriate. It is important to escape from the mistaken Thatcherite view of Council Tax as a kind of “service charge for local public service provision”. A radical reform could integrate green taxes to help meet the UK's climate obligationsFootnote 21 with a move to Land Value Tax (LVT). The LVT is economically the most rational of taxes, especially with regular revaluations of land.Footnote 22 I have previously argued that business rates should be switched to such a land value basis, by gradually increasing the weight of the land component in the valuation of business assets (Reference MuellbauerMuellbauer, 2005, a reform also supported by the Mirrlees Tax Review, 2011). However, I questioned whether this would be politically feasible for residential housing, because LVT for households could be labelled the ‘garden tax’, and seen to strike at the heart of middle England.
A green dimension for LVT would also have the advantage of destroying the ‘garden tax’ objection. A Green LVT (GLVT) would use three pieces of information: the land value of the entire property (V), the proportion of the area taken up by the building(s) (P), and the energy certification of the building(s) (E). Think of E as the net energy use per square metre, so that E = 0 represents an energy-neutral building. The tax would have two components: a tax on the built-on land: t(E) x V x P, where the tax rate t(E) increases with the energy use per square metre of the building; secondly, a tax on the unoccupied land: t(0) x V x (1–P), since 0 represents energy neutrality. Note that for energy-neutral buildings, the tax rate would be the same as on unbuilt land. An energy-efficient block of flats would typically have a lower property tax rate per flat compared with an energy-inefficient mansion on the same sized plot. This would create incentives for the building industry to build higher density energy-efficient flats, for conversions to follow the direction that uses land and energy most efficiently, and for the installation of home insulation, to meet our global environmental commitments.
As noted in Section 3, the current highly regressive form of Council Tax creates perverse incentives for the conversion of multi-unit residences into single-family luxury homes especially in the most expensive locations, which pay far lower Council Tax relative to property values. This suggests an allowance for say, the first £30k of property value V, for the GLVT. Then (V–30) would replace V in the formulae above. The overall tax then is T = t(0) x (V–30) x (1–P) + t(E) x (V–30) x P. Council Tax
Relief payments would fall enormously under even such a mildly progressive tax structure. Regionally varying allowances, suggested by the Resolution Foundation Intergenerational Commission (2018a), would take some account of regional differences in land prices.
A crucial aspect in reforming property tax is to address the objection that property taxes are tough on cash-poor/asset-rich households. An example often cited is of pensioners living in expensive houses on a low income. All home-owners should have the right to defer property taxes but in exchange for a fraction of the value of their property for each year deferred. This fraction would be defined as the ratio of the annual tax to the value of the property at the time. The current Council Tax discounts for single persons then become redundant, and discounts for second homes would be abolished. I also propose a return to the system of the landlord being responsible for the payment of the tax, as under the old Domestic Rates system, considerably saving on collection costs.
Annual or biannual revaluations of the values on which property taxes are based are necessary for two reasons. They discourage speculation in rising markets and therefore promote financial stability. Secondly, they avoid the sharp discontinuities in taxes that result from the large relative house price changes occurring after long-delayed revaluations.
A problem with which many countries are struggling is the impact of foreign investors on property prices, pushing values beyond the reach of local residents and their children. A solution is to have a modest tax surcharge (say 25 per cent) for all properties owned by those who are not a UK taxpayer or pensioner. Current arrangements for the Annual Tax on Enveloped Dwellings (ATED)Footnote 23 should largely deal with foreign corporate attempts to escape such a surcharge. But it is important that such arrangements should not discourage UK-based pension funds and institutional investors from investing in residential rental housing.Footnote 24
A further advantage from shifting property taxes onto land values and increasing revenue would be that the Stamp Duty on transactions could be reduced in compensation. Stamp Duty currently impedes mobility and efficient location choices.
Moving business rates to the land value basis would help avoid potential tax-shifting distortions. Land is the most immovable asset and so least subject to tax distortions as long as both households and businesses are covered by land value tax. Moving business rates to the land value basis has a number of independent merits too. An important merit, which also applies to LVT-based residential property taxes, is to raise revenue for public sector investments that boost local property values. Indirectly, the general public then shares in the benefits of such investments. Another merit of LVT-based business rates is in the incentive for developers to bring their private land banks into development more rapidly. There is also an incentive to locate business investment in cheaper locations where unemployment rates are often higher. A related benefit, given annual or biannual revaluations, is to relieve financial pressure on businesses. For example, the recent down-turn in land values on High Streets, where business for retailers is currently suffering, would translate into a larger reduction in LVT-based business rates than under the current system. Business taxes should also move in a green direction following similar principles to those suggested above for residential GLVT.
Any radical change in the tax system needs to be phased in slowly to give people time to adapt. Property tax reform probably needs a four-year transition, after details of the new structure are announced. Given a year during which the first set of valuations would be carried out, households would have five years before the full system was functional. Politically this does not fit well with the UK political cycle, unless cross-party consensus on the basic structure was achieved.
Inheritance tax is another aspect of property tax. As part of its review of the taxation of wealth, the Intergenerational Commission also argues for inheritance taxes to be charged on the wealth gains of the beneficiaries rather than on the estate of the deceased. The special advantages for housing for inheritance tax, announced by George Osborne in 2015, could then fall away.Footnote 25
We now turn to policies that govern land release, and the planning and the funding of infrastructure and of affordable housing. To tackle the supply side of the housing market, four fundamental changes are required. The first is to enable a public sector land bank or banks to acquire land at existing planning consents and subsequently to be able to revise these consents. As Thomas Reference AubreyAubrey (2016) has argued, now part of Labour Party policy,Footnote 26 changes to the 1961 Land Compensation Act would be needed to enable such land banks to function. Far more of the uplift in land values when planning permission is given would then accrue to society (rather than to the landowner) and be available to fund infrastructure and affordable housing. The community land auctions proposed by Reference LeunigLeunig (2011) would be likely to result in auction prices of farmland above pure agricultural prices but far below their prices with current permission for housing. Compulsory purchase powers, as used in the New Towns programme of the 1950s and 60s, would need to deal with hold-out owners of small land parcels blocking a large development. To be legally enforceable, all land ownership, including options, should be recorded at the Land Registry.
Second, the government should revise its fiscal rules so that its measure of the ratio of gross debt to GDP is replaced by a net debt measure, which nets off the marketable land assets owned by the government, see Reference MuellbauerMuellbauer (2014). If the government adds to the public sector land bank, this would then, in the short term, not add to net debt/GDP but, in the long term, actually reduce net debt/GDP, as land was revalued with change of use. This would encourage the use of public sector land banks to release a great deal more land for residential development than has been the case since the early 1980s.
Third, as far as local government is concerned, financial incentives are needed to encourage planning consents. These could be in the form of a share in the planning gain from bringing releases from public land banks into development, or a per unit subsidy related to local house price indices for every house built. One application of such a subsidy would be for councils to build up their often under-resourced planning departments, which should speed up planning decisions.
Fourthly, along with many other housing experts, I believe that a far greater public or social sector housebuilding programme is needed to provide affordable homes. The first two reforms above would unlock both land supply and the fiscal capacity to fund such a programme. However, the continued selling off of social housing under right-to-buy legislation, extended in the 2016 Housing and Planning Act, should be abandoned, as it contradicts the need to increase affordable housing supply.
Such a radical reform package would clearly reduce expected rates of return in land holding, which is at the base of investing for capital gains on housing. This would improve incentives for other forms of saving, and more productive investments, whether in human capital, infrastructure or business innovation. In the long run, this should result in a more prosperous economy. Wealth inequality would be reduced as holdings of land are highly concentrated. Inequality of opportunity would be reduced as housing became generally more affordable: property prices reflect access to publicly-provided goods such as good transport and schools, clean air, public parks and other facilities.
At current rates of construction, only around 1 per cent of the stock of housing is added in a year. This suggests that increased supply would only slowly feed into house prices, though some expectational effects are likely. The combination of gradual phasing in of a reformed tax structure and faster supply growth will have a moderately negative impact on house prices, but given Bank of England stress tests, the banking system should easily be able to handle the short-term repercussions on house prices. The repressed demand for housing is considerable and should support prices below the top locations, where prices will clearly fall. The land bank proposal should lower farmland prices in locations where planning permissions or hope of such permissions have led to very high prices. However, with widespread auctions for farmland for potential purchase by public sector land banks, it seems likely that farmland prices will rise more generally, compensating for losses in the hot spots. Reforms are bound to lead to relative price changes and while there will be many gainers, there will be some losers.
Though losers tend to shout more loudly than gainers, and the political and media influence of established wealth must not be underestimated, the generation that has been so disadvantaged by Britain's ‘broken housing market’ is gaining strength: the fraction of voters born after 1979 is ever increasing. Moreover social attitudes are changing. Since 2010, support for building new homes has significantly increased across all demographics according to the 2016 British Social Attitudes Survey, while opinion polls suggest a greater willingness to pay more tax to support the NHS. The political feasibility of reform has clearly improved.
The regulatory framework surrounding the private rented sector is the third area where reform is necessary. To its credit, in July 2018, the government announced a public consultation on a proposal for a three-year compulsory contract for most tenancies to improve tenants' rights against sudden eviction.Footnote 27 The Labour Party manifesto of 2017 proposed three-year tenancies as a standard; and to introduce flexible rent controls to limit annual rent rises, with protection for tenants against sub-standard properties, both features of the German system. These proposals could encourage greater professionalism and a longer-term outlook for the buy-to-let landlord sector in the UK. In 2016, the government increased stamp duty by 3 per cent for private landlords, and in 2017, a phased reduction began in tax relief on interest payments to a standard 20 per cent rate. These changes are likely to reduce the number of landlords, but have contributed to taking some of the heat out of the property market. At least the UK is avoiding the Australian problem where overly generous tax subsidies to wealthy investors have contributed to the high level and volatility of house prices.Footnote 28 Encouraging long-term institutional investment in rental housing, for example by pension funds should be a high policy priority, though there remains the conundrum of how to do so at low fiscal cost given the UK's high residential land prices.Footnote 29
The final policy area for reform is the regulation of pensions. One driver of the British public's enthusiasm for owning property is the perceived low returns, risks and complexity of investing in pension funds. There is widespread concern over mis-selling of pensions and the excessive fees of asset managers, which reduce net returns for pension fund investors. The Financial Conduct Authority (FCA) is promoting greater transparency on fees.Footnote 30 Given large economies of scale in asset management, there is scope for a range of interventions to reduce fees including offering a small range of publicly-regulated, low-fee, ‘vanilla’ pension products, both for auto-enrolled pensions and for general sale. The range might include products that mix defined benefit and defined contribution elements; the government could provide an element of back-stop insurance for the defined benefit component, partly funded by auctioning franchises for ‘vanilla’ products to pension management companies.
Holistic thinking in government about UK policies affecting housing affordability and housing tenure has been woefully absent. Reference WhiteheadWhitehead (2018) notes some of the contradictions and policy switches, for example on tenure. New pension freedoms have increased buy-to-let demand, which was then met by the rise in stamp duty and cuts in tax relief discussed above. While help-to-buy policies did result in some increased supply, they probably also resulted in net increases in house prices. The expansion of right-to-buy has reduced the stock of affordable housing, and it is estimated that 40 per cent of socially-owned homes under previous sales are now privately rented, seeming to defeat the Thatcherite aim of expanding the ‘property-owning democracy’. After coming to power in 1996, New Labour failed to grasp the nettle of tax reform or to expand social housing, and it introduced new planning constraints on building. Its many interventions, for example to help key workers, probably did more to increase demand than to expand supply, so raising prices. The required rethink of policies that affect housing by government and political parties has some way to go. If, as seems likely, Brexit proves to be a fiasco, the resulting political realignment could offer opportunities for fresh thinking. While Germany is institutionally and culturally different from the UK, there are clear lessons to be learned from such international comparisons.