

Political exclusion of historically disadvantaged groups has been conceptualized as a democratic problem that violates the legitimacy of the democratic system and contributes to a negative impact on policy outcomes (i.e., Beaman et al. Reference Beaman, Chattopadhyay, Duflo, Pande and Topalova2009; Krook and O'Brien Reference Krook and O'Brien2010). In order to address this problem, the most common remedy taken by either countries or political parties has been to use affirmative action, such as gender quotas and ethnic quotas that target specific political minorities. Quotas for women now exist in more than 100 countries and political parties (Dahlerup Reference Dahlerup2006; Krook Reference Krook2009; Tremblay Reference Tremblay2008; Tripp and Kang Reference Tripp and Kang2007). Quotas for ethnic, language, or religious minority groups are less common but exist in more than 40 countries (Bird Reference Bird2014; Krook and O'Brien Reference Krook and O'Brien2010; Tan Reference Tan2014).
In recent years, the joint barriers faced by different political minorities have increasingly come into focus in the scholarly literature (Htun Reference Htun2004; Htun and Ossa Reference Htun and Ossa2013; Hughes Reference Hughes2011; Krook and O'Brien Reference Krook and O'Brien2010; Lépinard Reference Lépinard2013; Tan Reference Tan2014; Williams Reference Williams1998). Given the rapid expansion of affirmative action policies that target one specific minority at a time, increasing attention has been paid to how quotas for one minority impact on the political representation of other minorities. In broad strokes, the scholarly literature has taken a step from the question of quota impacts on the representation of women as a group to the question of which women, and indeed which men, are supported or disadvantaged by gender quotas. In this article, we provide a highly contextualized case study of how a quota policy—the zipper system—adopted by Sweden's largest political party, the Social Democratic Party, impacted on intersectional representation in 285 municipal assemblies in 1993–2010. We subdivide both women and men by polyethnic minority status and use both quantitative and qualitative methods to study the impact of gender quota on the intersectional representation of each sex.
Recent work has increasingly used institutional feminist theory to understand the intersectional impact of quotas, putting contextual factors at the center of the interpretations (Krook and Zetterberg Reference Krook and Zetterberg2014). It has been argued that three types of institutions are particularly important for the selection of political candidates: systemic institutions, practical institutions, and norms of representation (normative institutions) (Krook Reference Krook2010). The impact of the quota will depend on other institutions that operate in the same context (see also Helmke and Levitsky Reference Helmke and Levitsky2004). The interaction of quotas with the institutional configuration may produce either a good fit or a conflict across systemic, practical, and normative institutions. Moreover, the quota can shape additional institutions or alter previous ones to affect the outcome.
Following this theoretical work and its recent empirical applications, we formulate three hypotheses that correspond to the mixed predictions generated by the literature and that are conditional on the context of the case. First, we may expect a positive impact on the intersectional representation of both men and women if the quota alters norms on group representation in a way that favors polyethnic minorities (Araoújo and García Reference Araújo, García and Dahlerup2006; Baldez Reference Baldez2006). The implementation of the new form of candidate selection—in this case, the zipper system—can also break down other practical institutions that constitute joint barriers for the representation of both groups, such as a strong reliance on party-internal networks for nominations (Dahlstedt Reference Dahlstedt2004).
Second, we may expect the quota to benefit the intersectional representation of women but impede the intersectional representation of men. This could occur if male party elites want to protect their access to electable positions on the ballot but also balance the party list with minority candidates. The result is a preference for minority women among the new “quota women” as a strategy to reduce the need for minority men (Celis et al. Reference Celis, Erzeel, Mügge and Damstra2014; Hughes Reference Hughes2011; Reiser Reference Reiser2014; Tan Reference Tan2014).
Third, it is hypothesized that the quota will, at best, have a zero impact on the representation of both sexes. This is expected if minorities compete with each other for representation so that formalizing and essentializing one group interest can come at the expense of that of other groups (Reiser Reference Reiser2014). In other words, a gender quota that increases the salience of one minority can weaken the norms of representation for other minorities (Kenny and Mackay Reference Kenny and Mackay2009; Thelen Reference Thelen2004).
We study the case of Sweden's largest political party, the Social Democrats, which adopted a zipper gender quota for all its electoral ballots more than 20 years ago, in 1993. This gives us two decades of data, both quantitative and qualitative, to study any intersectional impact of the gender quota and gain knowledge about the dynamic process whereby identities are recognized in politics. Our data include information on the sex and region of birth for all elected politicians in all of Sweden's 285 municipal assemblies and over seven election periods. This allows us to study how the composition of these party groups relates to the impact of the gender quota (which will be further discussed below). The quantitative analysis is then supplemented with a qualitative analysis of party documents and interviews with key actors to learn more about the contextual mechanisms behind the quantitative findings. Our goal is not only to evaluate if the gender quota impacted on the intersectional representation of men and women, but also to explain why—or indeed why not—those impacts occurred.
A particularly interesting aspect of the Swedish quota is that it is no longer a controversial policy (authors’ own interviews). This means that our study is likely to capture intersectional impacts at advanced stages of quota policies that are not yet observable in other countries where quota policies remain highly controversial (Krook Reference Krook2009). Another contribution derives from the study of subnational data within one country. In most countries, such subnational political assemblies play important roles in the economic and social development of the country and serve as a stepping stone to the national political arena.Footnote 1 The case of having affirmative action policies imposed on local political actors by central level actors is also an understudied but common context that exists in a wide array of countries such as Belgium, India, Italy, Spain, and many others. Finally, party quotas are the most common measure for guaranteeing women's political representation worldwide (Franceschet, Krook, and Piscopo Reference Franceschet, Krook and Piscopo2012; Global Database for Quotas for Women 2014).
Another important contribution that stems directly from our focus on local political assemblies is that we can sidestep some important methodological concerns regarding the endogeneity of quota policies and measurement problems pertaining to ethnic minorities. Across countries, there are large differences in the ways in which minority groups seek recognition and which the relevant minority groups are (see Kymlicka Reference Kymlicka1995, Reference Kymlicka2007; Bird, Saalfeld, and Wüst Reference Bird, Saalfeld and Wüst2011). For our Swedish case we can, however, define the relevant minority group as polyethnic minorities of immigrant origin, following Kymlicka (Reference Kymlicka1995), a measure that is well aligned with the political realities, debates, and views on representation in media and research.Footnote 2
The endogeneity concern for quota policies arises in cross-country studies since there is a myriad of contextual factors that make it difficult to establish a causal impact of a quota policy on political representation. For example, a cross-country study such as that of Hughes (Reference Hughes2011) cannot distinguish if a specific combination of quota types impacts on minority representation or if minority representation (or any observed and unobserved factor that is correlated with that representation) impacts on the adoption of a certain mix of quotas. When we use data from local assemblies within one country and examine a zipper quota that is assigned to these assemblies by the national party board, we sidestep this concern. Because the quota was adopted by the party in response to the threat of a feminist party at the national level, it is exogeneously imposed on the 285 local party branches. The fact that there existed dramatic differences in female representation across these branches delivers a “dose” of additional female representation (a “quota impact”) to each municipal party group from the zippered lists. Indeed, the average share of elected women across all 285 assemblies was 36.5% prior to the quota and with a standard deviation of 10 percentage points.
This article is organized as follows. We start with a brief review of background information about polyethnic minorities in Sweden, local political institutions, and the Social Democratic Party's gender quota—the zipper system. Then, we derive hypotheses about the intersectional impacts of this quota on men's and women's political representation. Our quantitative analysis describes our data, quantitative measurements, and methodology and presents the results of this analysis. Then we present the method and results of our qualitative analysis where we attempt to open the black box of party politics by studying a wide variety of documents and records from Party Congresses as well as interviews with key actors in the party organization. Our final section concludes the paper with a discussion of the joint quantitative and qualitative results.
SWEDISH POLITICS AND INSTITUTIONS
National Minorities and Immigration in Sweden
Sweden has one group of indigenous people, the Sámi. This group numbers around 20,000–35,000 out of Sweden's population of 9.5 million. It is concentrated in Northern Sweden and has an elected political assembly called Sámetinget. There are four national minorities besides the Sámi. The largest one is the Sweden Finns, numbering approximately 450,000 individuals if both the first and the second generation are counted, followed by the Romani (50,000 individuals), the Tornedalians (50,000 individuals), and Jewish people (20,000). With the exception of the Tornedalians, these groups are based on the postwar immigration of mainly blue-collar workers from less economically developed regions in Europe. Estimating the number of people in the national minority groups is difficult since Sweden does not collect data on ethnicity. This reflects deep-rooted concerns from the misuse of such records in continental Europe during World War II. As in other countries, such as France and Belgium, where there are similar concerns with regard to measuring ethnicity, a person is hence considered to be Swedish without any other distinction if he or she has obtained Swedish citizenship (c.f. Lépinard Reference Lépinard2013).
As in many other Western European countries, the composition of those immigrating to Sweden has shifted toward refugee and family reunification migrants in the recent decades. Notable countries in this inflow have been Chile, Iran, Poland, former Yugoslavia, Iraq, and Somalia. At the beginning of the 1990s, people born abroad made up about 10% of the Swedish population. This fraction remained roughly constant throughout the 1990s and then gradually increased over the 2000s to today's 14%. If children of foreign-born parents are included, the fraction is today close to one-fifth of the population.
Group-Based Representation for Gender and Ethnic Minorities
In Sweden, as in most comparable countries, the recognition of gender as a structuring principle in politics preceded the recognition of ethnicity (Borchorst et al. Reference Borchorst, Freidenvall, Kantola, Reisel, Teigen, Kriszan, Skeije and Squires2012). Women currently make up 45% of the members of Swedish Parliament and 43% of the members of the municipal councils. Despite the prevalence of gender, ethnicity has become salient in understandings of diversity. In fact, Sweden was one of the first countries to extend local and provincial voting rights to immigrants with resident status in 1976, arguing that it would increase social and political inclusion among foreign-born residents (SOU 1975, 15). Swedish political parties are also paying increasing attention to the descriptive representation of ethnic minorities in political parties (Dahlstedt Reference Dahlstedt2004; Soininen Reference Soininen, Bird, Saalfeld and Wüst2011; SOU 2006). Demands for a descriptive representation in Sweden were initially directed toward the integration of women. In recent years, calls for more diverse decision-making institutions have been heard, for instance from ethnic minorities, various age groups such as young people and senior citizens, LGBT groups, etc.
Political and Economic Power of Municipal Assemblies
Sweden has 290 municipalities, each of which has an elected assembly that ranges in size between 31 and 101 members, depending on the municipal population. These assemblies have substantial political power, both via direct taxation and control over public spending. Taken together, they control more than one-fourth of Swedish GDP and employ one-fourth of the entire labor force. Municipalities are also guaranteed the right of local self-government by the Swedish Instrument of Government, which stipulates that local authorities themselves determine their own affairs. Furthermore, under the 1991 Local Government Act 2.1, the local authorities are themselves responsible for matters of public interests relating to the municipal council and its inhabitants, which are not the exclusive responsibility of the state or some other body. In addition to these responsibilities, there is nothing to prevent the state from entrusting the municipalities with specific tasks under an act of law or issuing directives therein concerning how these matters shall be dealt with.
Social Democrats: Party Organization and the Gender Quota
The Social Democratic Party was funded in 1889 and has been the largest party in Swedish parliament since the 1930s. As implied by the party name, it has a left-wing ideology and is based in the workers’ movement. At the municipal level, members are organized in clubs, and together the clubs make up the party's municipal organization. The main political work is carried out in the clubs, and they also nominate candidates for positions on the party list for the municipal council election. These nominations are aggregated and evaluated by a selection committee that molds the nominations into a preliminary party list, taking into account party guidelines regarding quotas, etc. The preliminary list is then fixed at a members’ meeting.
The main organizing principles for candidate selection within the Social Democratic Party are geography, class, gender, and age.Footnote 3 This is reflected in the structure of the clubs that nominate candidates. Party members usually belong to both a geographically based club (a neighborhood club) and one or, in some cases, several identity-based clubs. Depending on its size, each municipality has several trade-union-based clubs, one or several women's clubs, and one or several youth clubs. The unions, the women's branch, and the youth league also have national federations within the party. Less common clubs are religious clubs, student clubs, and clubs based on ethnicity. In large cities there is usually one or several clubs based on specific nationalities as well as “multicultural” clubs that organize individuals from all ethnic backgrounds.
Most Swedish parties have adopted voluntary guidelines to raise their share of female decision makers at local, regional, and national levels of government (Freidenvall Reference Freidenvall2006). Within the Social Democratic Party, the question of women's representation was carried forth by the party's national women's federation (Kvinnoförbundet/S-kvinnor), an organ formed in 1920 when 120 women's clubs joined forces. The federation fought long and hard for gender quotas, starting with a demand already in 1928 and ending with the adoption of the zipper system placement mandate in 1993 (Freidenvall Reference Freidenvall2005). The 65-year period in between was marked by gradual steps. In the late-1980s, the party adopted a recommendation for women constituting 40% of the party lists, and in 1990 a stricter recommendation for “equal representation of the sexes” was put in place.
Despite the 1990 recommendation of gender parity on party lists, the share of female parliamentarians fell from 38% to 33% in the general election of 1991. In the vivid debate that followed, a feminist network—the Support Stockings—threatened to start a new political party unless women's representation was improved. Many Social Democratic women threatened to join this party unless zippered lists were introduced. In that way, the threat of the feminist party offered the opportunity for the women's federation to finally break the gridlock within the party and put in place the requirement to alternate male and female names on all party lists (Freidenvall, Dahlerup, and Skeije Reference Freidenvall, Dahlerup, Skeije and Dahlerup2006).Footnote 4 Today, this quota enjoys wide acceptance and is not questioned within the party (authors’ interviews).
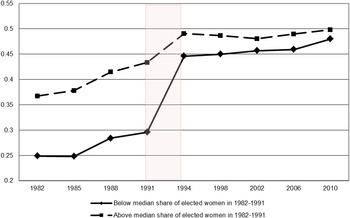
Figure 1 illustrates the efficiency of the 1993 zipper quota by plotting the development of the share of women in the Social Democratic party delegations in the municipal councils, divided by the median fraction of women in the prequota period (1982 to 1991). The figure shows that in the approximately 140 municipalities that started out with a share of women below the median, the share of women increased from an average of below one-third to almost one-half.Footnote 5
Average share of elected women in Social Democratic municipal party groups over time and by median quota impact.

GENDER QUOTAS AND MINORITY REPRESENTATION: A FEMINIST INSTITUTIONALIST VIEW
Institutions are “the rules of the game in a society,” and they are commonly defined as formal and informal rules and procedures that structure social interaction by constraining and enabling actors’ behavior (North Reference North1990, 3). A further delineation of formal and informal institutions is given by Helmke and Levitsky (Reference Helmke and Levitsky2004). Formal institutions are defined as “rules and procedures that are created, communicated, and enforced through channels that are widely accepted as official,” while informal institutions are “socially shared rules, usually unwritten, that are created, communicated, and enforced outside of officially sanctioned channels” (Helmke and Levitsky Reference Helmke and Levitsky2004, 727). Importantly, informal institutions should be distinguished from informal organizations (and formal institutions from formal organizations). Moreover, rather than being actors that behave in a certain way, an institution is a rule that regulates and affects the behavior and beliefs of those actors (Peters Reference Peters2012, 19–20).
A feminist view of institutions, feminist institutionalism further develops the notion of institutions, claiming that institutions are also intrinsically gendered (Chappell and Waylen Reference Chappell and Waylen2013; Krook and Mackay Reference Krook and Mackay2011; Mackay and Chappell Reference Mackay, Kenny and Chappell2010). In very broad terms, feminist institutionalism recognizes that gendered power relations are shaped by a dynamic process that involves many different and moving parts (Krook and Mackay Reference Krook and Mackay2011). Rather than thinking of patriarchy as a system of universal oppression, gender relations are viewed as the outcome of a continuous interplay between moving parts of different types, the institutions. In this article, we study gender relations from an intersectional perspective, meaning that we expand the gender dichotomy to a “matrix of domination” between the categories of gender and ethnicity (i.e., Collins Reference Collins2000; Crenshaw Reference Crenshaw, Fineman and Mykitiuk1994).
The new institutionalist literature has emphasized that different institutions interact to shape the results of altering or adding one specific institution (Helmke and Levitsky Reference Helmke and Levitsky2004; Krook Reference Krook2010). Krook (Reference Krook2010) provides a theoretical framework that is well tailored to study the impact of gender quotas on outcomes of political representation. Institutions are divided into three levels: systemic rules (for example, proportional representation or the existence of a multiparty system), practical intuitions for candidate selection (for example, requiring party membership, ticket balancing, or the use of secret ballots), and norms on equality and representation.Footnote 6 As one of these institutions is changed, the impact of this change is expected to be mediated through the other institutions operating within the same context. Indeed, in order to assess the impact of quotas, one must focus on the institutional configuration, the particular set of interactions between systemic, practical, and normative institutions, which may result in either a good fit or conflict (Krook Reference Krook2009).
Hypothesis for the Intersectional Consequences of Gender Quotas
In Krook's framework, the introduction of a gender quota provision can be interpreted as the introduction of a new practical institution for candidate selection. In the case of the zipper system, this is clearly the case, as the new rule requires parties to alternate male and female names on the party ballot. To understand the effects of such a quota provision on the possibilities of different groups to access political office, we need to consider other institutions that exist in any specific context. In the case of intersectional representation, we should realize that systemic, practical, and normative institutions interact and can be combined in ways that either facilitate or hinder improvements in representation. This reasoning is similar to that of Helmke and Levitsky (Reference Helmke and Levitsky2004), who point out that the existing formal and informal institutions can produce outcomes that are either convergent or divergent from the expected impact of a new formal institution.Footnote 7
The existing literature on the impact of gender quotas on intersectional representation has generated both mixed theoretical predications and mixed empirical findings. Interestingly, the literature also offers predictions that differ regarding the impact of gender quotas on the intersectional representation of women and men.
Positive intersectional effects for both women and men can be expected if gender quotas alter either the practical institutions or the norms of representation in ways that favor minority candidates. On the normative side, the party's internal discourse on identity recognition as a basis for representation could be altered. In other words, a gender quota provision that forces parties to recognize that gender is a characteristic that matters for representation can become an enabling condition for the salience and subsequent inclusion of other groups (Araoùjo and Garcia Reference Araújo, García and Dahlerup2006; Baldez Reference Baldez2006). This process is clearly illustrated in the Swedish case where the National Federation of the Social Democratic women referred to the categories of class and geography in its argumentation for the zipper system, which is the quota studied in this paper, a quota provision that made gender the core organizing principle for the party's candidate lists (Freidenvall Reference Freidenvall2006).
The arguments above closely mirror those made by Meier with regard to the contagion of gender quotas across different arenas. For example, she argues that
there is a clear sequence in the various measures that have been adopted over time. What initially started as voluntary party regulation, spilled over into gender quotas established by law, not only for parties but also for other decision-making bodies. Over time, the measures adopted were more far-reaching, in gender balance, in sanctions imposed, or in both. This is a contagion effect. Once a norm has been established with respect to gender equality, it is difficult to set a completely different one, even in another sector (2013, 462).
In the same manner it could become difficult to argue against increased minority representation once a norm has been established with regards to gender.
There are various practical institutions that can function as joint barriers to both women and minorities and may be broken down as quotas are introduced for one specific group. In interviews with foreign-born local politicians in Sweden, Dahlstedt (Reference Dahlstedt2004) noted that the mechanisms of exclusion described by these politicians were highly similar to the mechanisms described in earlier studies in the case of women's representation. The foreign-born politicians cited party culture and the “rules of the game” that dictated the internal party life as major limiting factors on their chances in politics. Although these rules were often framed as unbiased by the party elites, they tended to create a biased recruitment. In particular, the practice of relying on party-internal networks for nominations and political advancements was seen as a major impediment to representation. Alterations of these practices by the adoption of a gender quota could hence also be expected to aid minority representatives of both genders.
The research outlined above gives us our first hypothesis:
H1:
Gender quotas improve intersectional representation of both men and women by raising the share of minority women among the elected women and the share of ethnic minority men among the elected men.
A second strand of literature suggests that gender quotas may have a positive impact on the intersectional representation of one gender and a negative impact on the intersectional representation of the other. Positive effects for the representation of minority women have been expected to stem from the quota's interactions with the existence of male elites within parties and the practice of ticket balancing. By selecting “quota women” from minority groups, male elites can preserve their political dominance if minority women are (at least seen as) easier to negotiate with or exclude from real political influence (Fraga et al. Reference Fraga, Lopez, Martinez-Ebers and Ramírez2006; Hawkesworth Reference Hawkesworth2003).
Besides minority women's perceived political weakness, parties in PR systems are also known to follow the practice of ticket balancing in composing their party lists. Under this practice, the party elites, which heavily influence the process of list composition, have incentives to fill the female quota with women who are also minorities (Hughes Reference Hughes2011; Tan Reference Tan2014). In the words of Reiser (Reference Reiser2014, 64), “it can be assumed that those who belong to more than one sought-after group are more likely to be selected as a candidate than those who fulfill only one or no quota.” Celis et al. (Reference Celis, Erzeel, Mügge and Damstra2014) argue that ethnic minority women received a “complementarity bonus” as party elites in both Belgium and the Netherlands struggled to form ethnically representative candidate lists while still complying with gender quotas. Likewise, in her study of candidate selection in Norway, Bråten (Reference Bråten2013) finds that minority women are prioritized over minority men based on an understanding that they are more adaptable to the progressive Norwegian gender equality model.
Contrary to minority women, the socioeconomic composition of the party elite or the practice of ticket balancing cannot be expected to support the representation of minority men. It is even possible that a gender quota may produce a negative effect for this group. With a smaller number of seats that can be occupied by male candidates combined with the fact that ethnic majority men have more power over list composition, the exclusion of minority men would safeguard more seats for majority men as the quota is implemented. Given this reasoning, we form our second hypothesis:
H2:
Gender quotas improve the intersectional representation of women by raising the share of minority women among the elected women, while they have a negative, or null, effect on the intersectional representation of men.
Finally, there is theoretical and empirical research that suggests null or negative impacts of gender quotas on the intersectional representation of both sexes. In the case of women's representation, scholars have cautioned that gender quotas may only favor highly educated and upper-class women from the dominant racial, ethnic, or religious groups (Crenshaw Reference Crenshaw, Fineman and Mykitiuk1994; Mansbridge Reference Mansbridge2005; Strolovitch Reference Strolovitch2007; Weldon Reference Weldon2011). This could occur because the exclusive focus on one dimension of exclusion strengthens dominant subgroups over marginalized ones (Strolovitch Reference Strolovitch2007). If the quota strengthens the norm of representation for women, and those women are thought of as the majority group, this cannot be expected to help the minority women to gain ground. For instance, a recent evaluation of the Norwegian Gender Equality Politics has shown that middle-class women are prioritized at the expense of working-class women and ethnic minority women (NOU 2012:15).Footnote 8 Another important insight as to why negative effects could occur is that political contexts often contain multiple political minorities that compete with each other for recognition and political representation (Borchert and Reiser Reference Borchert and Reiser2010; Kymlicka Reference Kymlicka1995; Mansbridge Reference Mansbridge1999). Organizations that represent marginalized groups, such as women's organizations, have been shown to be substantially less active in advocating for the issues that affect disadvantaged subgroups within that minority (Strolovitch Reference Strolovitch2007). The women's branch of a party may fight hard for a gender quota but be less active in expanding that quota to also cover subgroups of women. Women's organizations may also prioritize other intersectional divisors, such as class, over polytechnic immigrant representation, as thoroughly explained in the case of France by Lépinard (Reference Lépinard2013).
Other work puts more emphasis on the power relation between groups. Cross-country comparisons of quotas for women and for ethnic minorities have shown that gender quotas tend to favor ethnic majority women (who dominate the women's associations within parties) while minority quotas support ethnic minority men (who dominate parties’ ethnic fractions) (Darcy, Clark, and Welch Reference Darcy, Clark and Welch1994; Krook and O'Brien Reference Krook and O'Brien2010). Hughes (Reference Hughes2011) documents that unless tandem quotas exist for both women and minorities (each), improvements in minority female representation are unlikely to occur when only a gender quota is introduced.
A specific reason why party-based gender quotas will not help minority women is that there could be path dependency in parties’ recruitment practices. The implementation of a new practice regarding the share of women on the ballot may not upset the composition of the parties’ selection committees or the practice of using personal networks to find suitable candidates. As these other institutions remain intact, recruiters are likely to locate women for quota seats that belong to their own networks and that predominately cover majority groups.
Finally, a discussion of the impact of a gender quota should not disregard the fact that parties often have several coexisting strategies of affirmative action where some are more formalized than other. Reiser (Reference Reiser2014) notes that the nomination procedures of political parties often incorporate several cross-cutting affirmative action strategies for different political and/or socioeconomic traits. In the German case, Reiser highlights the importance of formalization as parties have generally prioritized gender quotas over so-called “newcomer quotas” for the simple reason that gender quotas are formally adopted in party statutes while newcomer quotas are not. In the case of intersectional representation, a situation where a gender quota receives formal recognition while a claim on minority representation remains less formalized can imply that gender undercuts the salience of minority status in the list-building process. Theoretically, we should recognize that institutions contain asymmetrical power relations between groups so that institutional change that increases the power of one group may reduce the power of another (see Kenny and Mackay Reference Kenny and Mackay2009; Thelen Reference Thelen2004).
The research outlined above gives our third hypothesis:
H3:
A gender quota provision will at best have a null effect on the intersectional representation for both women and men, and it may even have negative effects for both genders.
QUANTITATIVE ANALYSIS
In this section, we will test the three hypotheses by graphical and regression analyses. Our data come from electoral ballots from six waves of elections, 1991–2010, in 285 Swedish municipalities. Because these ballots include the personal identification number of each politician, each individual can be linked to a host of background variables from the registers of Statistics Sweden. This means that we have access to background information such as sex and region of birth of each politician as well as the region of birth of each politician's parents. We match this data with electoral data at the municipal level and other key municipal characteristics such as the share of the municipal population born in various regions around the world.
Measures of Polyethnic Minorities and Intersectional Representation
As noted by Philips (1995) and Bloemraad (Reference Bloemraad2013), it is a challenge to classify and categorize ethnic minorities. We depart from register information about each politician's region of birth (see Table A1 in the Appendix). In our baseline analysis, we apply the simplest possible definition of polyethnic minority status, a binary indicator that takes the value of one if the politician was born abroad. In the Appendix, we also run an analysis where we expand this definition to include “second generation” immigrants (i.e., individuals with at least one foreign-born parent). By going one generation back, the indicator captures both the brunt of Sweden's national minorities and the more recent waves of immigration. Running the analysis for this wider definition hence serves as a relevant robustness test.
We define intersectional representation in two alternative ways—and for men and women separately. The first measure is the share of elected minority women among all elected women, and the share of elected minority men among the elected men. The second measure, which follows the suggestion of Bloemraad (Reference Bloemraad2013), is the fraction of minority politicians of each sex in the party group divided by the fraction of minority persons of each sex in the population.Footnote 9 We call this second measure relative intersectional representation.
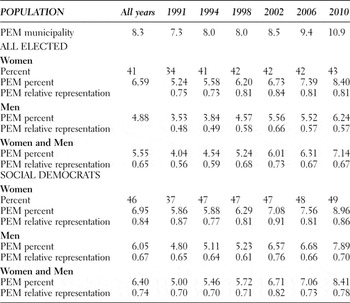
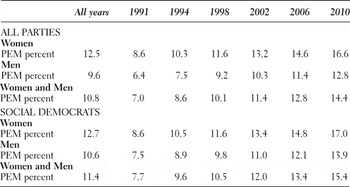
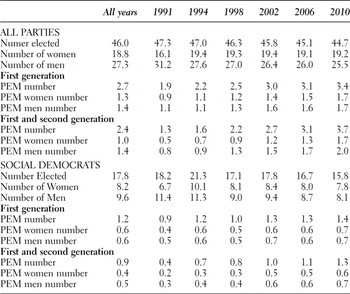
In Table 1, we provide descriptive statistics for our two dependent variables. To show the overall representation of polyethnic minorities, we also show aggregate descriptive statistics for men and women combined. Furthermore, we provide descriptive statistics for the share of polyethnic minorities in the municipal population and the average share of women in the municipal party groups. We report this data for the municipal assemblies as a whole in the upper pane of the table, and for the Social Democratic Party in the lower pane. The shaded columns indicate the prequota (1991) and postquota (1994) elections. A corresponding table of summary statistics, but which includes second-generation immigrants, can be found in the Appendix (Table A2). We also show (Table A3) the descriptive statistics using the average number of representatives from each relevant group rather than the shares from each group.
Summary statistics of the shares of polyethnic minority (PEM) representatives among all elected politicians and all elected social democrats, 1991–2010

The descriptive statistics for our measures of intersectional representation show several noteworthy facts. The fractions of both polyethnic minority women and men are higher in the Social Democrats (7.0% and 6.1%) than in the councils as a whole (6.6% and 5.6%). We also note higher shares of minority representatives among the women than among the men, regardless of election period, measure, or group definition. Finally, it is apparent that the intersectional representation of both sexes has improved over time.
The remaining descriptive statistics in Table 1 show increases over time in both the share of female politicians (from 34% in 1991 to 43% in 2010) and, again, in the share of polyethnic minorities of both sexes (from 4% to 7%). For all years, we also see that the Social Democratic party groups have a higher fraction of both these groups than the assembly average. In the Social Democratic groups, the share of women increased from 37% to 49% over time, and the share of polyethnic minorities of both genders increased from 5.0% to 8.4%. The large increase in the share of minority representatives in the party groups occurred in tandem with the rising share of polyethnic minorities in the municipal populations, although the increase in the population was smaller, as indicated by the development of our measures of relative intersectional representation.
Graphical Analysis
To test how the gender quota impacted on intersectional representation, we compare municipalities based on the impact of the quota. Because the Social Democratic party groups varied greatly in the share of women prior to the quota, but all party groups needed to zipper their lists, some groups saw a drastic impact of the quota, and some did not. We examine how intersectional representation changed in the Social Democratic party groups depending on the size of this quota impact.
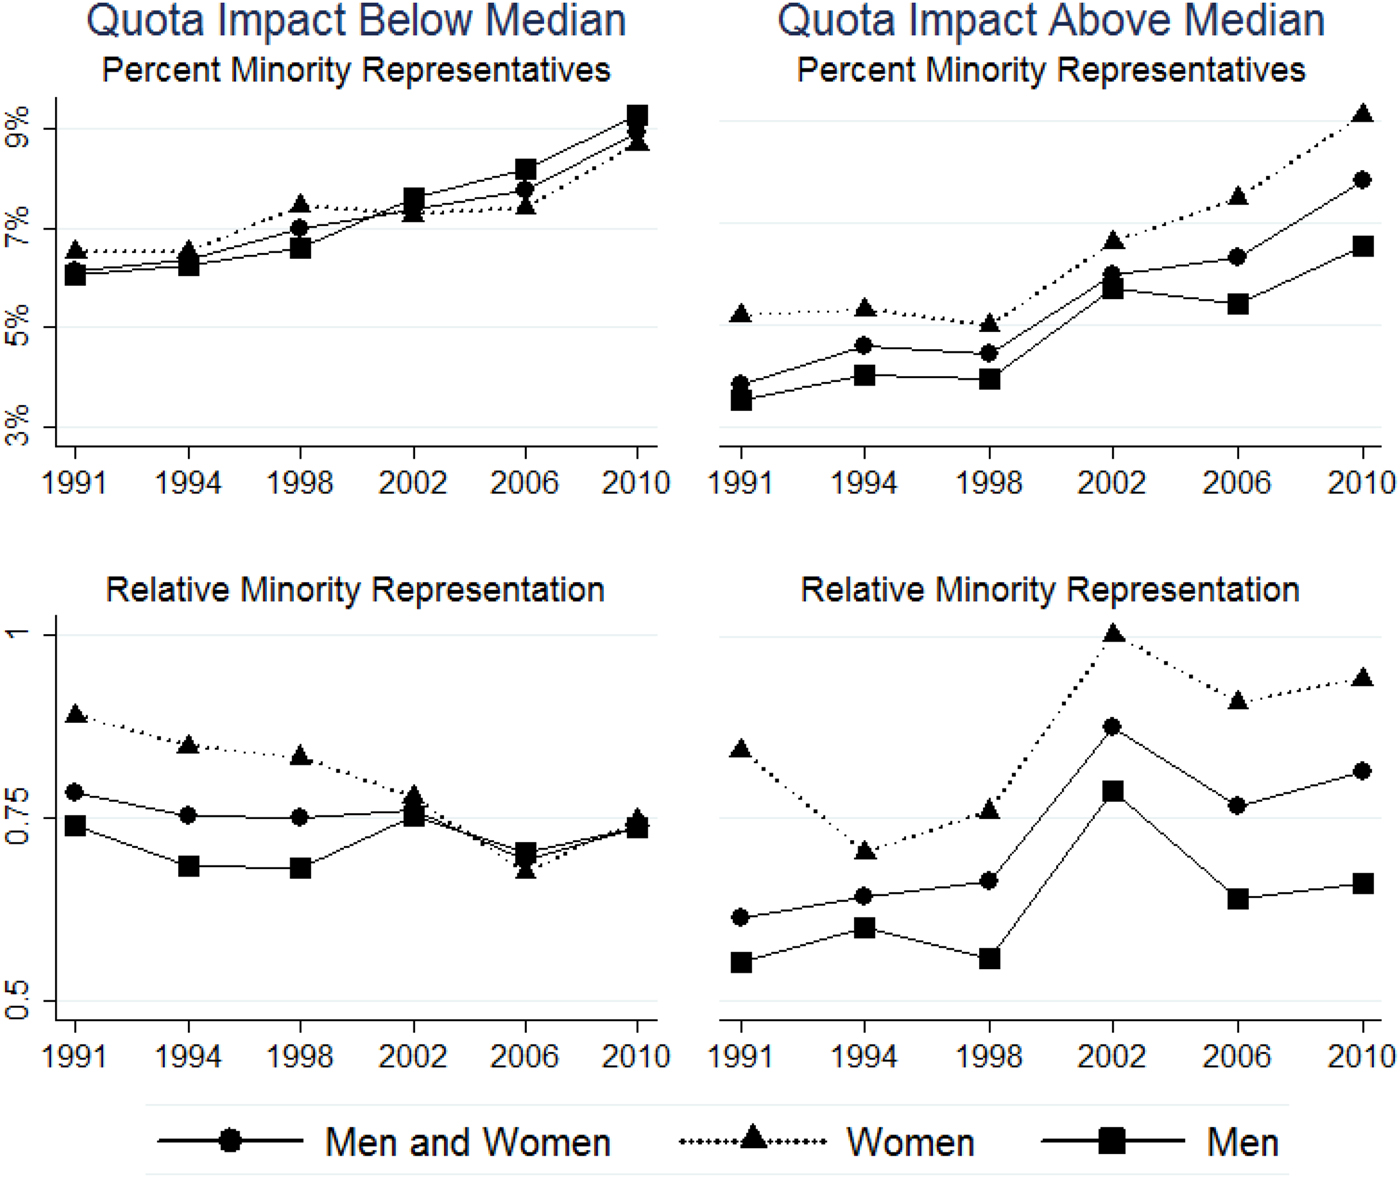
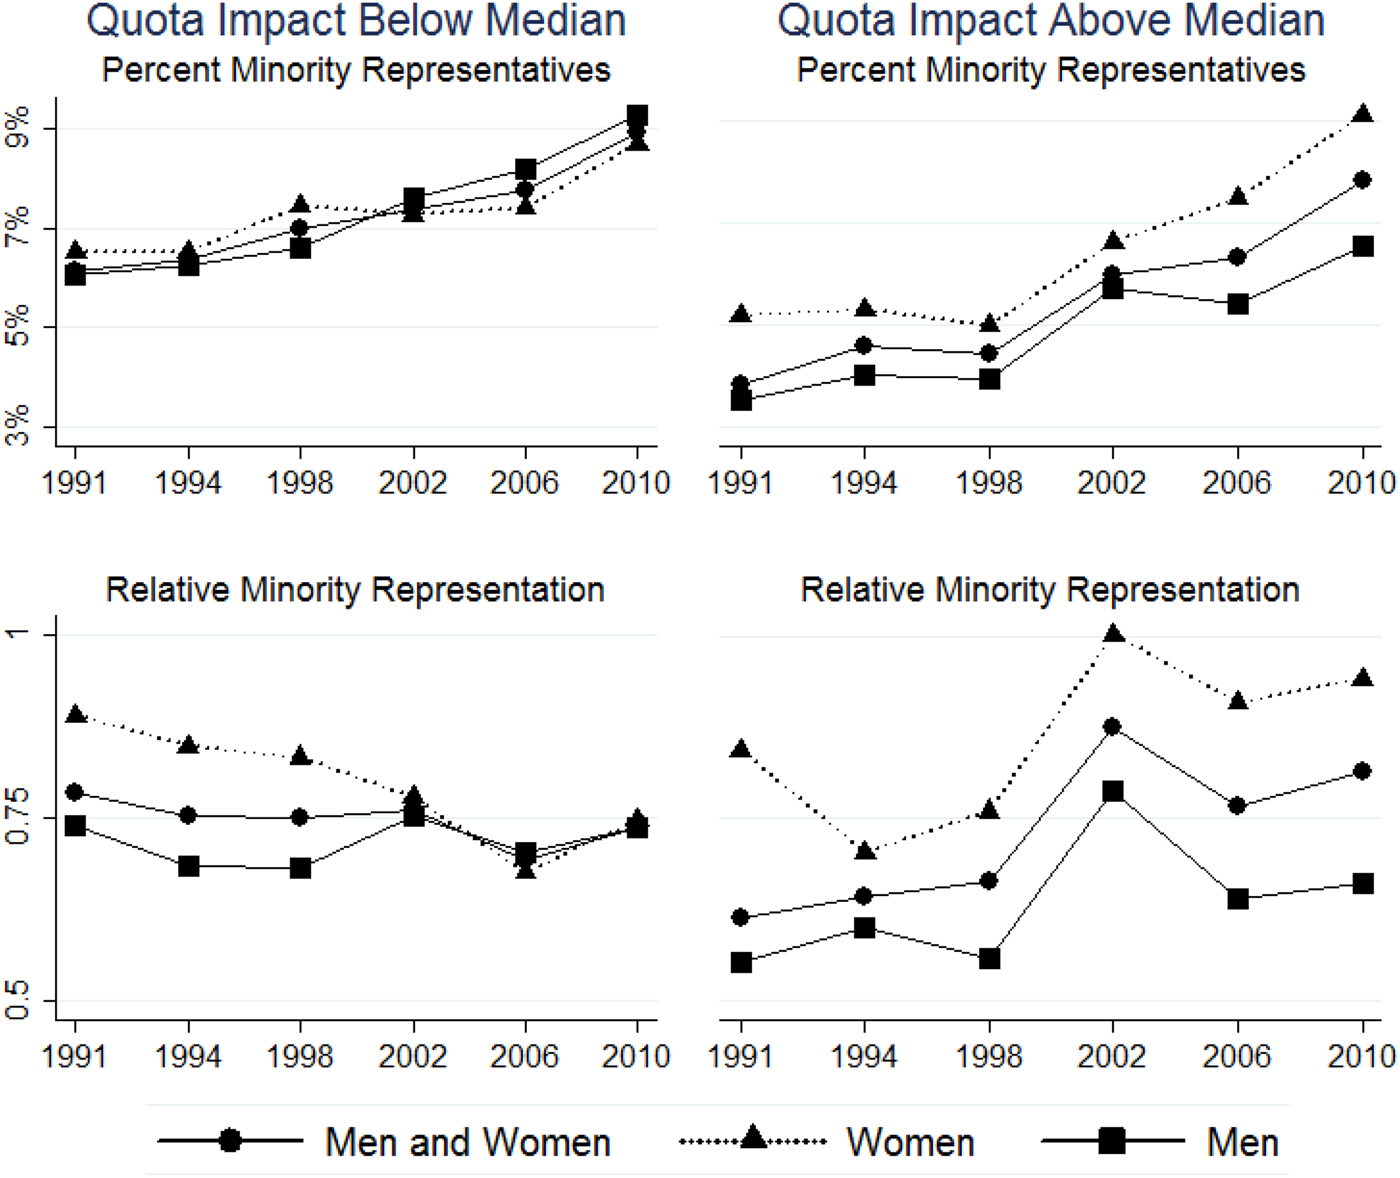
Figure 2 shows the graphical analysis that looks at both the short-term and the long-term development of intersectional representation in two groups of municipalities, those with a quota impact below the median (left-hand side) and those with a quota impact above the median (right-hand side). The uppermost graphs show the development of the fraction of polyethnic minority women among the elected women and the fraction of ethnic minority men among the elected men. The lower graphs show the development of our measure of relative minority representation.
Shares of ethnic minority individuals (men and women) as a share of the elected Social Democratic party groups in municipalities with an above-median quota impact (left-hand side) and a below-median quota impact (right-hand side).
To examine our hypotheses, we need to compare the trends in intersectional representation in the left- and the right-hand side figures. We are particularly interested in comparing the change in these trend lines when the quota was introduced in 1994.
The two pairs of graphs together paint a picture of the development of intersectional representation in the Social Democratic Party. In the top graphs, we can see upward sloping trends, which show that the share of minority representatives has increased steadily over time among both men and women. To link this to the quota, we need to compare the beginning of the trend lines in the two graphs. If the quota increased or decreased the share of minority men (among the group of men) and the share of minority women (among the group of women), this would be seen by different time trends in the right-hand figure as compared to the left-hand figure. The figures clearly dismiss the existence of such a difference; there are no trend breaks in the share of minority women among the women at the time that the quota was introduced. Nor is there a trend break in the share of minority men among the men in high-impact municipalities compared to low-impact municipalities.
Even though we do not see evidence of an immediate impact, we should consider the long-term trends and how they differ across the two figures. In this case, it appears that the intersectional representation of both men and women in the above-median quota impact municipalities “catches up” with the below-median quota impact municipalities over time. A particularly large jump in the series can be seen in the 2002 election, and in 2010 the levels of representation are quite similar. As this positive and differential change took place eight years after the gender quota provision was introduced, it is, however, not clear if can be directly (or indirectly) linked to the quota.
The lower figure takes into account the fact that the share of minorities in the municipal populations may differ between high- and low-quota impact regions. This pair of figures also shows a similar development across the high and low quota impact municipalities. In both groups of municipalities, we can see that the relative representation of minority women drops somewhat in 1994. This reduction is only slightly larger in the municipalities with a high quota impact, which indicates that the drop in representation was not related to the quota impact. For minority men, the trends are divergent across the two groups, but the difference is quite small in absolute values.
In sum, the graphical analysis rejects H1, that the gender quota improved the intersectional representation of both men and women, as well as H2, that the quota was positive in the case of women but not in the case of men. We find support for H3, that the quota had at best a null effect on the intersectional representation of women or men. The graphical analysis does not show any negative impacts; nonetheless, we do not see any positive ones. Hence, we find that the quota supported minority women to a similar degree as it helped majority women and that minority men were not overrepresented among the men that had to leave their seats when the quota was introduced.
Regression Analysis
Our regression analysis follows the same principle as the graphical analysis and is based on the following specification:
 $${\Delta_{1994 - 1991}} EM_{m} = {\beta_0} + {\beta_1} {\Delta_{1994 - 1991}}{W_m} + {\epsilon_m},$$
where our coefficient of interest, β 1, will capture the impact of a change in the share of women in the municipal party group when the gender quota was introduced, 1994–1991 (i.e., the quota impact), on the intersectional representation in that party group. In two separate regressions, the quota impact is defined both as a continuous measure and as a dummy variable taking the value of 1 if the quota impact was above the median and otherwise 0.
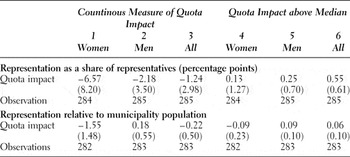
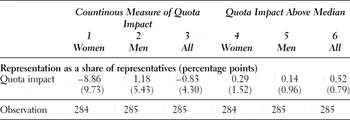
The results are presented in Table 2 where columns 1 through 3 show the results for a continuous definition of the quota impact, and the results for the binary independent variable appear in columns 4 through 6. The results for the fraction of minority representatives among each sex are presented in the upper pane, and the relative intersectional representation measure is used as the dependent variable in the lower pane.
Impact of the gender quota on the representation of elected ethnic minority politicians in Social Democratic municipal party groups, 1991–1994

Notes: ***p < 0.01, **p < 0.05, *p < 0.1. Robust standard errors reported in parentheses.
The results are easily summarized as they confirm the graphical analysis. No estimates for the intersectional representation of minority women or the intersectional representation of minority men are close to being statistically significant. Furthermore, most estimates are small in size and change signs depending on how we measure the quota impact. This puts the support for our third hypothesis of a null effect on a firm statistical footing. Our results for the wider definition of polyethnic minority status, which includes second-generation immigrants, are shown in Table A4 and do not depart from the pattern in Table 2.
Overall, our results provide strong support for the third hypothesis of a null effect of the quota minority representation, at least in the short run. To explain why there is no such immediate effect but a potential long-run effect, we will now turn to our qualitative analysis.
QUALITATIVE ANALYSIS
Having established the lack of a quantitative impact of the gender quota on intersectional representation for both sexes, we use qualitative material to gain a further understanding of the institutions that may have mediated this result. We conduct a qualitative text analysis using archived materials from all Social Democratic Party Congresses in 1990–2009. These data include motions, the party board's replies to motions, speeches, and background material used by the congress. Through this material we identified key actors within the party organization who, historically and currently, were closely involved with questions of minority and gender representation. In addition to the text analysis, ten interviews were conducted with key actors. Interviews with these experts took about 1–1.5 hours each and were conducted by the authors between May and August 2013.Footnote 10 Five broad questions were used to identify the party's strategies for minority representation; potential ways in which the gender quota facilitated or impeded existing or future efforts of that kind; and similarities, differences, and the interplay between the discussions of the two forms of identity representation within the party and over time (translated questions are available in the Appendix).
Our analysis of formal documents and interviews tracks the party's internal discussion about minority representation over time. The objective is to identify and assess any relevant institutions that shape the impact of the zipper gender quota on the intersectional representation of men and women. We start by outlining the findings from the document study and then discuss this evidence, conjoint with the interview results in our discussion of qualitative results.
Prequota Congress in 1990
Historically, and for obvious reasons, class has been a key social category within the Social Democratic Party with gender increasingly so since the 1970s. While gender has been the focus of consistent efforts of discussion initiated by the women's movement, the political representation of minority groups has not been a topical issue until the last ten years or so. The secondary nature of this socioeconomic division was highlighted in the opening remarks of the 1990 party congress. It was noted that all groups in society should be able to participate in politics on equal terms, and the categories of class and gender were highlighted. Polyethnic minorities were not mentioned in the oral presentation, but the written congress program material noted that the political representation of “immigrants” should increase within all parts of the party organization. Tools to reach these goals were outlined as skill development and support for local party clubs based on language. Expanded social networks were pointed out as a strategy to reach the goal.
Two language clubs, both Finnish, submitted motions to the congress and requested permission to form a national association for the 60 Finnish-speaking Social Democratic Party clubs in the country (Motions 127 and 128, 1990). This would have created a party organ similar to the National Federation of Social Democratic Women, had the congress not supported the party executive's suggestion to turn down the proposal. In its rejection, the party executive argued that the integration of the Finnish speaking minority into the main body of the party was more desirable than a separate organization at the national level.
The accounts from this congress highlight the fractionalized nature of the agency of polyethnic minorities within the party as well as the attitudes of the executive toward the efforts to improve the representation of this group. Some minorities had formed clubs based on language and aimed for national agency based on this division. The party viewed these divisions with skepticism and, clearly, as being different from the norms about the representation of women or young people, both of whom already had existing national associations.
Quota Introduction, 1993 Congress
At the 1993 congress, several motions pushed for gender quotas, in large part motivated (as noted above) by the threat of a new feminist party that would likely attract both politicians and voters from the Social Democrats. The party board also presented a report named All of the Salary—Half of the Power (1993), where it was argued that equality for women in terms of political representation was one of three key areas requiring urgent political attention. The motivation for the policy area in part rested on a feminist analysis of the difference in access to power. It also emphasized that women had specific collective interests and identities that motivated representation in their own right. When the quota was passed, it was a major victory for the national women's federations, which was by far the main agent advocating change in this direction.
The efforts to strengthen the representation of minorities were marginal and clearly separated from the discussion of gender. One motion suggested that every local Social Democratic Party association should appoint a spokesperson for immigrants in the municipality and improve the education of immigrant party members (Motion 45, 1993). However, the party executive rejected this initiative based on the argument that it is up to the local party organization to decide on its own activities and regulations. The contrast to the handling of the gender quota is striking but quite in line with the party's previous treatment of the two socioeconomic divisors.
Post-Quota Congresses, 1997 and 2001
At the 1997 congress, the Social Democratic Trade Union Association and the Metal Workers’ Association, called for additional quotas to make political assemblies “more representative” of the population (Motion 51, 1997). In its response to (and rejection of) the motion, the party board called for municipalities to broaden the representation and specifically mentioned immigrants.
At the 2001 party congress, one further step was taken. Ibrahim Baylan, a representative from the party district of Västerbotten and himself of minority background, suggested “that the party reflects the diversity of the electorate” (Congress minutes, part II, p. 11). The proposal was supported by the party executive, and the party congress decided on the following party recommendation:
We in the Social Democratic Party want to recognize and take advantage of [the] diversity [of the population]. This [point of departure] is to be applied within our own organization and among our elected officials. The zipper system is now taken for granted. We want all parts of the party and all decision-making assemblies to have an equal representation of women and men, and to reflect the population's diversity and age structure.
After this recommendation had been made, a notice was sent to all municipalities that it should be adhered to in the nomination procedures for the upcoming election. Earlier research has noted that this was also the case in practice. For example, the Stockholm County Social Democratic Party agreed in 2002 on a set of Principles for List Composition, according to which minority background was one of several key points of departure (Freidenvall Reference Freidenvall2006). In this particular local organization, it was decided that the electoral ballot for the parliamentary election consists of three candidates with minority backgrounds in the top 20 positions, thus reflecting the proportion of minorities in the constituency. The Kronoberg County Social Democratic Party, as another example, decided in its Prioritized Guidelines for List Composition that the electoral ballot for the parliamentary election in 2002 should include 10% of the minority candidates to reflect the population in that locality (Freidenvall Reference Freidenvall2006). The importance of social representation was one of several motives for these new practices that were stressed by both party organizations.
Recent Developments, 2005–2009
The question of polyethnic political representation within the party has not moved to the center stage in recent years. At the party congress in 2005, the discussion on political representation focused on the recruitment of more party members from minorities.Footnote 11 In the following year, when the party adopted a strategy for member recruitment, the document largely disregarded this priority, however. The new guidelines only noted in passing that more party organizations should be established in residential areas with a high degree of minority groups in order to recruit new party members. At the congress of 2009, minorities were—again—only dealt with as a membership issue, and the conclusions merely stated that a better reception of new minority members was key for making the party membership more inclusive and representative of the population. The account of these developments makes it clear that the ethnic minority representation is nowhere near the imposition of a quota.
Discussion of Qualitative Results
Our quantitative analysis has shown that the introduction of a new practical institution for candidate selection, the zipper gender quota, had no immediate impact on the intersectional representation of women or men. The review of our document study will now be combined with the findings from our ten interviews to provide a further understanding of this lack of positive—or negative—impacts.
Feminist institutional theory leads us to believe that the effects of changing one institution should be mediated through the interaction with preexisting systemic and practical institutions relating to candidate selection, as well as norms for group representation. We also expect that the institutional change of interest (the quota policy) could interact with these other institutions to produce the final outcome.
Starting at the systemic levels, electoral rules were relatively stable throughout the period of study, involving a multiparty proportional representation (PR) system with high district magnitudes and closed party lists, factors that are usually noted for being amenable to the representation of new groups.
At the level of the practical institutions, we find that party practices were less favorable to improved intersectional representation. The women's federation that pushed for the gender quota was not (and still is not) an organization that works intensively with minority representation. Moreover, we do not see any spillover from the gender quota to the introduction of new practical institutions for minority representation. At least until 2001, the Social Democratic Party was not open to the introduction of new strategies to increase the number of immigrants on the party lists. Our document study shows that the issue of polyethnic minority representation was treated mainly as a membership issue. A motion to introduce a new strategy for immigrant representation at the local level was even turned down by the party board at the same congress that adopted the zipper quota. Moreover, as the zipper quota was introduced, there was no mention of polyethnic minorities in the discussion of this measure.
A turning point in the practical institutions came at the 2001 congress when diversity became a recommended criterion in candidate selection. Arguably, the quota policy may have shifted norms on representation to, in turn, introduce this new practical institution, which could explain the convergence in intersectional representation across party groups in 2002 that we uncovered in the graphical analysis. Our interviews gave diverging views on this issue. Some claimed that the discussion on women's political representation that took place in association with the quota set the foundation for the subsequent recommendations. They noted that once the middle-aged white man had been questioned, and largely rejected, as the universal political representative, there was more openness to the argument about representation based on minority status. In other words, the new norm for representation of women had an impact on the norm for the representation of minorities. However, other interviewees said that they did not perceive there to be any such link between the two. Interviewees also questioned the efficiency of the new guidelines, stating that even if the party board had issued recommendations related to the representation of minorities, these had not been followed by actual changes in the local nomination processes.
At a more general level, our qualitative evidence points strongly toward differing norms of representation for women and for polyethnic minorities as a key explanation for the null effect of the quota. The culture surrounding the discussion of women and the culture surrounding the discussion of polyethnic minorities in politics, respectively, are described as very different from each other. Gender has been an admissible criterion for discussions of political representation for a long period of time. The interviewees were all in agreement that “zipping” today had become an overarching principle not only for creating party lists, but also for many other areas of work in the organization. Respondents described it as a “divine principle,” and several people reflected that there was a gut feeling of “something being wrong” if, for example, the speaking time in debates was not divided equally between men and women. This shows that zipping in terms of gender is a practical institution that has become widely accepted and more widespread within the organization over the years. In contrast, respondents were reluctant to make normative statements about whether or not similar measures should be introduced for minorities, neither on party lists nor anywhere else. The highlighting of immigrant status was viewed as problematic. By categorizing and classifying groups, there was an apparent risk of essentialism, exaggerating differences and ascribing a label with a negative connotation. By registering candidates’ region of birth, there was an apparent and great danger that the party would be seen as xenophobic. One interviewee described “branding” with an ethnic label as an impossible practice.
Thus, although all respondents claimed that improving the representation of polyethnic minorities was an important task for the party and that these groups were recognized as a basis for representation in the internal party discourse, instituting polyethnic quotas was seen as highly controversial. In particular, it was seen as highly undesirable to create “registers” of items such as politicians’ region of birth or their parents’ region of birth. Instead, general guidelines about “diversity,” skill training, and member recruitment aiming at improving the representativeness of the “party as a whole” were seen as the only possible way to proceed.
Our qualitative findings also suggest that the consequences of the gender quota for intersectional representation were mediated by constraints that do not necessarily fall inside the standard definition of institutions.Footnote 12 We argue that there are (at least) two important types of constraints that researchers should consider in their studies of intersectional representation, which we term organizational and practical constraints.
We think of organizational constraints as the formal and informal ways in which identity politics is organized within political parties. Women's branches usually constitute key nomination organs as well as critical actors in formulating and advocating strategies for improved representation, such as quotas (see, for example, Krook Reference Krook2009). As previously emphasized by Celis et al. (Reference Celis, Erzeel, Mügge and Damstra2014), the role of intraparty organization of gender on the one hand and minorities on the other can mediate the impact of affirmative action strategies.
The organization of identity politics directly shapes the ability of a group to mobilize for a joint interest. Our data strongly suggest that the existence of formal organizations, or at least strong informal organizations, for both women and minorities, is necessary for a strong and positive intersectional impact of a quota that targets only one group. In our interviews with party officials, most respondents talked at length about the difference in the organization of women and polyethnic minorities’ interests within the party. The women's federation was described as a feminist association that did not have any tradition of working with the socioeconomic divisor of ethnicity. Nor did the association itself have many minority members. Perhaps as a consequence of this, the discussion of the zipper quota focused solely on the dichotomy and power relations between women and men. As one interviewee described the situation, “the women's association had to fight long and hard to achieve every inch of increased representation, there simply did not exist any ‘surplus’ influence that could spill over to others.”Footnote 13
While the women's federation was not inclusive of polyethnic minority concerns, our document study also showed that the party board actively resisted the formation of strong organizations based on nationality. While women have had a national party federation for a long period of time, a similar association for one of the largest immigrant groups, the Finns, was rejected by the party board at the 1993 congress. The party board claimed that polyethnic minorities should be mainstreamed into all of the party's national federations (for women, youth, etc.) instead of separately organized.
Recent developments in group-based representation in the Social Democratic Party show the important role played by national associations in the spillover of quota policies. In the 2014 election(s), the Social Democrats adopted a quota policy for age.Footnote 14 Ahead of this quota adoption, the youth league—the formal youth association at the national level—was greatly aided by members of the women's branch and in a fashion that resembled a consultancy service. Without an organization within the party to represent the interests of the young, such transfers of knowledge and methods of mobilization around the joint goal of a quota would likely not have been possible. A women's association with a balanced power structure across minority groups would arguably not fill the same function since there is a saturation of quotas for specific group interests. Once the women's federation received “its” quota, it could not propose another. Although in theory the zipper quota could have been modified over time to cover within-group inequalities, this is very rare in practice, and the vast majority of quotas target only one specific minority (Hughes Reference Hughes2011; Krook and O'Brien Reference Krook and O'Brien2010). This was also described as largely unthinkable in our interviews.
A second type of constraint that may have limited the impact on intersectional representation can be called practical. With this term we refer to the pure complexity of the identity in question. Several of our interviewees pointed out the difference across identities in terms of measurability. An individual's age, for example, is subject to little ambiguity, and enforcing a quota based on age was perceived to be straightforward. Gender was viewed as a more complex categorization, but considerably less complex than ethnicity (c.f. Bird Reference Bird2003). In particular, the diverse composition of nationalities and the tricky question of “when a person becomes Swedish” made it challenging to delineate first-, second-, or third-generation immigrants into specific categories. To decide which individuals to count as an “ethnic minority” was described as requiring thorough considerations of identity formation. These practical constraints clearly limited the perceived feasibility of formulating any concrete strategies for polyethnic minority representation. In the Swedish case, this practical constraint clearly contributed to why the gender quota did not have an impact on intersectional representation, neither in the short run nor in the long run.
CONCLUSIONS
In this article, we use a mixed-methods approach to study the impact of a gender quota provision on the intersectional representation of men and women. This quota—the zipper system—was adopted in 1993 by Sweden's largest political party. The results from our quantitative analysis show that the quota did not have an immediate impact on the intersectional representation of either men or women. As the quota changed the gender balance in the party group, it improved the representation of minority women to the same degree as it improved the representation of majority women, and vice versa for men. This means that minority women were not overrepresented among the “quota women” and that minority men were not overrepresented among the men who had to leave their elected seats.
Our qualitative analysis provides an understanding of the mechanisms behind this result. In particular, we find large differences in the norms of representation for gender and polyethnic minorities within the Social Democratic Party. Over the party's history, gender had been a consistent category for the formulation of claims to representation. Polyethnic minorities, on the other hand, were not viewed as a permissible categorization, as evidenced by the party board's active dismissal of the formation of a national-level organization in the case of the Finns and the dismissal of several soft measures over time. Representation on the basis of minority status was seen as divisive and controversial from an ethical standpoint, which is likely to be a key reason for why the gender quota did not have any clear impacts on the intersectional representation of women and men.
In a longer time perspective, our rejection of H1 is not as clear as where we find some suggestive evidence of a quota impact. The party's acceptance of the norm that socioeconomic characteristics of the politicians matter for policy making in the case of gender may have cleared the path for the proponents of ethnic minority representation to raise this issue in discussions. Although the ensuing discussions were still not the product of organized agency, they produced formal but imprecise and largely toothless recommendations for letting party lists “reflect the diversity of Swedish society.” From our quantitative analysis of longitudinal data on representation, this recommendation nevertheless appears to have triggered at least some form of positive response on party lists.
We argue that the different norms of representation hindered the practical institution of the gender quota from triggering the adoption of practical institutions that could have further aided intersectional representation. In addition to the norms, we argue that two other types of constraints hindered this type of spillover. Our qualitative analysis clearly pointed to the role of organizational and practical constraints in formulating strategies for polyethnic minority representation. The agency for representation within the party is organized in “clubs” that are tied (more or less loosely) to a national federation within the party. The party's women's clubs, along with their national federation, struggled for quotas during more than half a century. Meanwhile, polyethnic minorities lacked a similar structure of advocacy and ethnicity that was not well integrated into the other socioeconomic organizational divisions within the party. Lacking a national organization, polyethnic minorities did not have an organization that could learn from the women's branch and achieve their own affirmative action. Thus, one of the most enabling factors that exercised pressure in favor of gender quotas was missing in the field of intersectional representation, and oppositional actors could not be counteracted. The importance of having a national organization is that formal affirmative action was introduced on the basis of age. In the process of introducing this policy, the women's association aided the party's national youth league to argue efficiently for a quota policy with a placement mandate, which was adopted in the 2010 election.
We also argue that practical constraints have limited the ability of existing advocates to formulate affirmative action policies in the case of polyethnic minorities or to make existing strategies more inclusive. The questions of first- and second-generation immigrants, cultural proximity to Swedish traditions and customs, and individuals’ own identification with the Swedish or immigrant groupings all pose difficulties. The pragmatic way in which the party (including some of its most prominent minority representatives) has tackled the question is to emphasize “diversity” of representation in broad terms, which has come at the cost of formulating clear and efficient policies.
Our results may provide some insights for future research. They indicate that researchers should be cautious in comparing countries and political contexts when it comes to the limitations on practical institutions and norms of representation and their interactions. These contextual factors, which can be specific to countries, parties, and political identities, create limitations on formal institutional development.
Finally, our results highlight the importance of using longitudinal data to assess the broader institutional configuration regarding the representation of minorities. In the case of Sweden, the effects were nonexistent over the short time horizon. In a medium horizon, there are potential effects that may have run via the channel of intraparty discourse. The long horizon, which is outside the scope of this study, may, of course, entail even greater impacts, which may be the topic of future studies.
Another avenue for further studies is to apply this analytical framework to contexts with similar political systems where quotas have been imposed on local agents through mandates from central agents. Examples of such contexts include Germany, where some of the central party organizations have imposed party quotas on the regional parties; Peru, where legal quotas were imposed at the local level; and Belgium and Spain, which have seen both legal and party quotas imposed at the local level. By studying such contexts, we can learn more about what type of institutions mitigate the intersectional impact of gender quotas.
APPENDIX
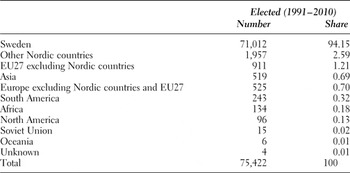
Number of Swedish municipal politicians according to region of birth, 1991–2010 average number and fraction of all elected politicians

Summary statistics for polyethnic minority representation—first and second generation—among all parties and the Social Democrats, 1991–2006

Summary statistics for the average number of elected representatives from different socioeconomic groups among all parties and Social Democrats, 1991–2006.

Impact of the gender quota on the representation of elected ethnic minority politicians in Social Democratic municipal party groups, 1991–1994

Interview questions
1. Has the Social Democratic Party implemented any strategies to improve ethnic minority representation? If yes, what type of strategies were they, when were they implemented, and how do you judge their effects?
2. From your point of view, what impact—if any—did the zipper quota have on polyethnic minority representation within the Social Democratic Party?
3. Do you think that the zipper quota facilitated or impeded the efforts to improve minority representation for individual actors or groups that have been or are currently involved in efforts of that kind?
4. Which similarities and/or differences can you outline between the political processes and discussions that have surrounded women's and minorities’ political representation within the party? Can you see any changes over time and, if so, what type of changes? Do you believe one discussion has had impacts on the other, or vice versa? If so, how?
5. What are the main reasons for minority underrepresentation in the Social Democratic Party? If you think that this is a concern that needs to be addressed, which would be the most appropriate way to do so?