







1. Introduction
In aquatic habitats, the two common types of propulsion are through the flapping of fins or tails and through pulsed jets. Whereas the former has been extensively studied, pulse jet propulsion has received far less attention. A recent review gives (Gemmell et al. Reference Gemmell, Dabiri, Colin, Costello, Townsend and Sutherland2021) an overview of the different types of pulsed propulsion found among marine invertebrates and a detailed comparative analysis of their swimming performances. Jellyfish and squids use the pulse jet propulsion mechanism. In both creatures, contraction of the body cavity produces a jet. Most of the studies on pulsed propulsion have looked at the structure of the wake (e.g. Dabiri et al. Reference Dabiri, Colin, Costello and Gharib2005; Dabiri, Colin & Costello Reference Dabiri, Colin and Costello2006; Bartol et al. Reference Bartol, Krueger, Stewart and Thompson2009). Bartol et al. (Reference Bartol, Krueger, Stewart and Thompson2009) have showed the existence of two types of jetting patterns behind a squid Lolliguncula brevis: the first one consists of the isolated vortex ring, and the second one consists of the vortex ring followed by a trailing jet. In a later study Bartol et al. (Reference Bartol, Krueger, Jastrebsky, Williams and Thompson2016) studied the interaction between fin motion and short pulse jets in the same species. Pulsed jet propulsion has also been used in several aquatic robots, such as Robosqid (Nichols, Moslemi & Krueger Reference Nichols, Moslemi and Krueger2008) and CALAMAR-E (Krieg & Mohseni Reference Krieg and Mohseni2008), and flexible robots with eight radial arms (Bujard, Giorgio-Serchi & Weymouth Reference Bujard, Giorgio-Serchi and Weymouth2021).
Clapping motion provides an alternative way to produce pulse jets, though most studies have been in the context of the flight of butterflies (Brodsky Reference Brodsky1991; Johansson & Henningsson Reference Johansson and Henningsson2021). Kim, Hussain & Gharib (Reference Kim, Hussain and Gharib2013) have made a detailed study of the flow created and the thrust generated due to the clapping of two plates in otherwise quiescent fluid. In a comparative analysis between flapping and clapping, Martin et al. (Reference Martin, Roh, Idrees and Gharib2017) show that clapping produces a higher thrust, whereas the flapping form of propulsion is more efficient.
The relation between the pulsed jet and the thrust is quite clear when the body is stationary in initially quiescent fluid. In pulsed jet propulsion systems, however, the body accelerates and moves forward due to the inherently unsteady thrust. The fluid flow affects the body motion, and the body motion, in turn, affects the fluid flow. The nature of the body motion and the effect of the body motion on the pulsed jet itself are important fundamental questions that need to be answered to better understand the propulsion of creatures such as jellyfish and squids. In the present study, we use a simple model of pulsed propulsion to study these issues. We have a body that rapidly moves forward due to the action of a pulsed jet. The self-propelling body consists of two rigid thin plates, pivoted at the front and held together by a torsion-like spring. In the natural state, both plates touch each other; the interplate angle is zero degrees. Initially, the plates are held at some angle, in the range of  $45^{\circ }-60^{\circ }$, in quiescent water. The release of the holding force brings the plates rapidly together, expelling the water between the plates, creating a jet, and propelling the body forward. Figure 1 shows a schematic of the set-up. Our interest is to study the kinematics of the body motion and the flow and the interaction of the two.
(a) The clapping body at rest with an initial torque  $T_o$ and interclap angle
 $2\theta _o$, held by the fishing thread (0.25 mm in diameter and shown by the black dashed line) that loops over two stationary solid rods. The plane
 $Z = 0$ is located at the mid-depth of the body. (b) The clapping body moves with a velocity
 $u_b$ along the X-direction subsequent to cutting of the thread. The vortex pair, with a core separation equal to
 $S_{cr}$, moves with a velocity
 $u_v$. The blue colour indicates water masses travelling with the body and the wake vortex pair.

In this paper, § 2 describes the apparatus design. A brief discussion of the overall analysis, § 3, is followed by a detailed analysis of body kinematics, § 3.1, a quantitative description of the wake from two-dimensional (2-D) particle image velocimetry (PIV) data, § 3.2, and wake momentum and energy considerations, § 3.3. The concluding remarks are presented in § 4.
2. Experimental set-up
The requirements that need to be satisfied for the body to move in a horizontal direction subsequent to the clapping motion are that it has to be neutrally buoyant, that the centre of mass (COM) and centre of buoyancy (COB) coincide, and that the thrust force passes through the COM. In this neutrally buoyant configuration, the total vertical force acting on the body is zero:
 \begin{equation} F_{net}=F_{Buoyancy}-F_{mass} = 0. \end{equation}
These requirements required careful design and fabrication. The main components of the body include balsa wood (specific gravity (SG) 0.22 gm cc $^{-1}$), hard plastic (SG 0.89 gm cc
 $^{-1}$), ‘Bond-Tite’ glue (SG 1.05 gm cc
 $^{-1}$), fishing thread (SG 1.22 gm cc
 $^{-1}$) and steel plate (SG 8.09 gm cc
 $^{-1}$). The balsa wood mainly provides the buoyant force to balance the weight of the steel plates.
Figure 2 shows different views of one of the clapping bodies and its different components. Each arm of the clapping body consists of a steel plate of length  $L_{Steel}$ on which a balsa piece having an aerofoil shape is attached at the front end. The steel plate provides the necessary spring action. A rectangular sheet of hard plastic is attached at the back end of the steel plate; another piece of balsa is glued onto the plastic sheet at the back. A canopy made of a thin plastic sheet (0.17 mm thickness) is attached at the back to change the body's mass
 $m_b$. It envelopes the back balsa piece and the rigid plastic plate. A detailed analysis of the distributions of weight and buoyancy is required to ensure the requirements of neutral buoyancy and coincidence of COM and COB to arrive at the final body configuration. The clapping body is created by gluing two identical arms over the front end with ‘Bond-Tite’, see figure 2(c).
(a) Isometric view of one of the plates that form the clapping body. The thicknesses of the various components are: steel = 0.14 mm for  $Kt_1$ and 0.10 mm for
 $Kt_2$; front balsa aerofoil = 2.7 mm for
 $Kt_1$ and 2.2 mm for
 $Kt_2$; back balsa = 2 mm for
 $Kt_1$ and 1.15 mm for
 $Kt_2$, rigid plastic = 0.8 mm. (b) Canopy for of the body with
 $M^* = 1.5$ and
 $Kt = Kt_1$, and for of the body with
 $M^* = 1.5$ and
 $Kt = Kt_2$. The thicknesses of a clapping plate
 $t_{Body}/2$ before and after canopy addition: 3 mm and 4.7 mm for
 $Kt_1$; 2 and 3 mm for
 $Kt_2$. (c) Top view of the clapping body with
 $d^* = 0.5$,
 $M^* = 1.0$, and
 $Kt = Kt_1$ with the plates pulled apart. The leading portion of the body shows steel plates glued together and sandwiched between two balsa wood aerofoils.

The parameters that we vary are body mass,  $m_b$, the length (
 $L$) and depth (
 $d$) of the body, initial clapping angle
 $2\theta _o$ and spring stiffness
 $\kappa$. The body length is the same in all experiments (
 $L= 89$ mm); three values of depth were used,
 $d=45$ mm, 89 mm and 133 mm. The canopy was used to increase the mass from the base (no canopy) value. The extra body mass is mainly due to the water that occupies the space between the streamlined plastic canopy and rigid plastic with it of length denoted by
 $L_{Plastic}$ (figure 2a,b). Bending of the steel plates over the length
 $L_e$ gives the spring action. The Euler–Bernoulli beam theory was used to determine
 $L_e$ such that the steel plates were still in the elastic limit for an angular deformation of
 $30^{\circ }$. Plates of two different thicknesses (0.14 mm and 0.10 mm) and lengths (40 mm and 35 mm) were used to make bodies with two spring stiffnesses. The spring stiffness of the steel plate with depth
 $d$ is
 $\kappa$ and it is defined as a proportionality constant correlating the initial strain energy with the initial clapping angle (see (3.17)). The value of
 $\kappa$ is determined experimentally for each body. The
 $\kappa$ for all 12 clapping bodies are listed in table 1. The details of spring stiffness calculations are discussed in the Appendix A. We also use the spring stiffness per unit depth, which we denote by
 $Kt$ (
 $= \kappa / d)$. We denote by
 $Kt_1$ the stiffness per depth corresponding to steel plate with the higher thickness (
 $= 0.14$ mm), and by
 $Kt_2$ for the plate with the lower thickness (
 $= 0.10$ mm). Due to the unavoidable variations in the construction of the different clapping bodies, we find the measured values of
 $Kt_1$ vary between 0.8–1.1 mJ mm
 $^{-1}$ rad
 $^{-2}$, and of
 $Kt_2$ between 0.3–0.5 mJ mm
 $^{-1}$ rad
 $^{-2}$. Similarly, there are variations of the values of
 $M^*$ and values of
 $\theta _o$. In all calculations, the values of
 $Kt$,
 $M^*$ and
 $\theta _o$ corresponding to the particular body or experiment were used. The values of
 $m_b$,
 $\kappa$ and centroid of the clapping body
 $X_c$ are given in table 1.
Design data of the clapping bodies.

The experiment required the design of an arrangement to hold the arms at an initial clapping angle  $2\theta _o$ and a release mechanism to allow the arms to quickly come together to give the clapping action. A fishing thread (Caperlan) with a diameter of 0.25 mm was used to construct a loop connecting both arms, where both arms experience initial effective torque
 $T_o$ (see figure 1a). The release stand consists of a pair of rigid acrylic circular rods mounted on an aluminium base. The initial clapping angle was adjusted by changing the separation distance between the rods. All experiments were done in quiescent water in a tank of dimension
 $80\ {\rm cm} \times 80\ {\rm cm} \times 30\ {\rm cm}$ (height). The clapping body was placed at a depth of 15 cm from the water surface. The body was set in motion by cutting the thread using a laparoscopic scissor. The scissor with an arm of 30 cm and 5 mm diameter minimized disturbance in the water during the cutting.
Much care was required to achieve neutral buoyancy and coincidence of COM and COB. The neutral buoyancy condition gets easily disturbed by tiny air bubbles on the body surface, formed during the insertion of the body into the water. A jet from a syringe was used to remove these bubbles. The balsa wood was coated with ‘Plastik 70’ to prevent the absorption of water. The placement of small masses of steel or balsa was required for balancing to achieve the requirements listed above.
Two-dimensional PIV was used to measure the flow field in the unsteady wake. The guidelines given by Raffel et al. (Reference Raffel, Willert, Scarano, Kähler, Wereley and Kompenhans2018) were followed. The PIV set-up consists of a continuous wave 5 W power, 532 nm wavelength laser, a high-speed camera and two plano–concave lenses. Two plano–concave lenses of radius 6 mm are positioned opposite to each other to increase the divergence angle of the laser sheet; the laser sheet thickness was 2–3 mm. Silver-coated particles (CONDUCT-O-FIL, Potters Inc) of 10–15  $\mathrm {\mu }$m were used as tracers. A high-speed camera (Photron-SA5) with
 $1024 \times 1024$ pixel
 $^{2}$ resolution recorded the flow field at 1000 f.p.s. using a Nikon lens of 105 mm focal length. The postprocessing of the PIV database was performed using ‘IDT-ProVision’ software. The 2-D PIV measurements were performed on the
 $XY$ plane at
 $Z =0$ and the
 $XZ$ plane at
 $Y =0$. The term ‘top view PIV’ corresponds to the
 $XY$ plane, whereas ‘side view PIV’ corresponds to the
 $XZ$ plane.
In the top view PIV, as shown in figure 3, the laser light sheet is along the mid- $XY$ plane located at half the body depth. The top view of the PIV set-up shows a green laser sheet illuminating the interplate cavity, and the black region represents the shadow on the back side of the cavity. For the top view, a mirror at
 $45^{\circ }$ placed on top of the tank was used. The interrogation window size was
 $24 \times 24$ pixel
 $^2$, where
 $1~{\rm pixel} \approx 0.3$ mm. The region of interest ROI varies between 100
 $^2$–120
 $^2$ mm
 $^2$ for the clapping bodies corresponding to
 $Kt_1$ and
 $Kt_2$. In the side view PIV, the camera directly recorded the flow field. The interrogation window size was the same as for the one in the top view PIV. The ROI varies between
 $150 \times 120$ mm
 $^2$ to
 $120 \times 120$ mm
 $^2$ based on the
 $d^*$ variations.
Schematic of the PIV set-up for measurement of the flow field in the  $XY$ plane. Also shown is a photograph of the particles illuminated by the laser sheet.

The flow was visualized on the  $XY$ plane using planar laser-induced fluorescence (PLIF). A thin layer of dye paste containing a mixture of Rhodamine B, acrylic binder (Daler–Rowney Slow Drying Gel) and honey was applied along a line at mid-depth on the inside surfaces of the clapping plates; honey provides the required fluidity to the gel. The methodology is adapted from that described in David et al. (Reference David, Mathur, Govardhan and Arakeri2018). RhodamineB emits light at 625 nm when excited with the green laser light. The same high-speed camera and continuous wave (CW) laser were used for the dye visualization.
The body kinematics has been extracted using the Kanade–Lucas–Tomasi (KLT) feature-tracking algorithm in MATLAB. The trajectory of the self-propelling body is recorded both in top and side view (figure 3). The high-speed camera at 1000 f.p.s. is used to record the rapid clapping action from the top view, whereas a regular camera (Nikon-COOLPIX) at 25 f.p.s. is used to record the trajectory of the body in the side view until it comes to rest.
We denote the ratio of the body mass with a canopy to the body mass without a canopy by  $M^*$, and depth is non-dimensionalized by
 $L$ to give
 $d^*$ (
 $=d/L$). We use
 $Kt_1$ or
 $Kt_2$ to denote the high and low stiffness springs, respectively, in the presentation of the results. We performed experiments covering a parametric space of 24 cases, with
 $M^*$ = 1.5 and 1;
 $2\theta _o = 45^{\circ }\text { and }60^{\circ }$;
 $d^*$ = 1.5, 1.0 and 0.5;
 $Kt = Kt_1$ and
 $Kt_2$. Experiments were repeated three times for each of the 24 cases in the parametric space. The aim of the study is to find out how the values of the various parameters such as body speed (
 $u_b$), plate angular velocity (
 $\dot {\theta }$), circulation, etc. vary as the values of input parameters (
 $M^*$,
 $d^*$,
 $\theta _o$ and
 $Kt$) are changed.
3. Results and discussion
First, we give an overview of the body motion and the flow created by the clapping motion of the body following the cutting of the thread. We choose one case with the following parameters:  $Kt = Kt_1$,
 $M^*$ = 1.0,
 $2\theta _o = 60^{\circ }$ and
 $d^*$ = 0.5. The cutting of the threaded loop initiates the rotation of each plate. Ejection of the fluid from the interplate cavity due to the rapid clapping motion creates a transient jet. During this time, the high fluid pressure on the inner surfaces of the two plates provides the propulsive force to the clapping body. The body has two phases of translatory motion: a rapid acceleration during the clapping motion followed by slow retardation. The body velocity is calculated by differentiating the position of the front balsa aerofoil with time. Figure 4(a,b) show the body's translational velocity
 $(u_b)$ with time, the former focuses on the initial phase. After attaining a maximum velocity of 0.71 m s
 $^{-1}$ at 50 ms, the drag force slowly reduces the body velocity tending to zero over approximately 1.56 s. The total distance travelled by the body is approximately three body lengths (BL). The body is tracked until it is primarily moving in the X direction; when the body speed becomes low, even a slight mismatch between weight and buoyancy force makes the body deviate from the horizontal path. The high-speed camera at 1000 f.p.s. records clapping action from the top view, whereas the Nikon camera at 25 f.p.s. records the side view. Data is extracted manually during the clapping action, and the KLT tracker is used after the end of the clapping motion until the body comes to rest. During the impulsive phase, images are analysed at 250 f.p.s. instead of 1000 f.p.s., which gives more than one-pixel displacement per frame. A reduction in body velocity during the retardation phase allows the velocity calculation with a time resolution of 125 f.p.s.. Figure 4 shows the data points along piecewise polynomial fits (sixth degree fit for
 $t \leq 0.16$ s and fourth degree fit for
 $t> 0.16$ s).
(a) Variation of the translational velocity  $u_b$ of the body with time up to 0.35 s. (b) Time evolution of
 $u_b$ until the body translates along the X-direction with negligible displacement in the Z-direction. Here
 $M^* = 1.0$,
 $2\theta _o = 60^{\circ }$ and
 $d^* = 0.5$.

Figure 5(a) shows the corresponding variation of semiclapping angle ( $\theta$) with time starting with the initial value of
 $30^{\circ }$, and figure 5(b) shows polynomial fit (fifth degree) for angular velocity (
 $\dot {\theta }$) variation. Note that the angular velocity is the rate of change of half of the interclap angle. Both clapping plates are set into an impulsive rotation once the thread is cut. The angular velocity attains maxima of 13.1 rad s
 $^{-1}$ at
 $\theta = 10^{\circ }$, at approximately 20 ms. The body reaches its maximum translation velocity at approximately when the angular velocity becomes zero.
(a) Variation of semiclapping angle  $\theta$ with time. (b) Variation of angular velocity
 $\dot {\theta }$ of the clapping plate with time. Here
 $M^* = 1.0$,
 $2\theta _o = 60^{\circ }$ and
 $d^* = 0.5$.

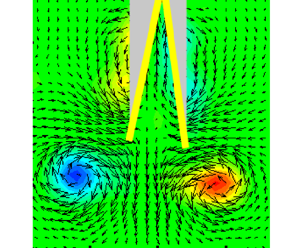
Vorticity is shed from the trailing edges of the plates, culminating in the formation of a three-dimensional (3-D) vortex loop that appears as two vortex patches in the  $XY$ plane. Figure 6(a) shows the PIV velocity and vorticity fields in the central plane. The position of the clapping body is marked with yellow lines, whereas the shadow in the top view PIV image is shown in grey colour. There is an indication of the expected bound vortex (shown schematically in figure 7a) around each plate in figure 6(a). The bound vortices in the PIV field are not clearly visible due to insufficient spatial resolution and the shadow behind the plates. Figure 6(b) shows the dye initially on the inner sides of the plates, being shed into the wake as the body moves forward. The red circles indicate the starting vortices.
(a) The Z-vorticity field  $\omega _Z$ showing the starting vortices at the end of the clapping motion,
 $t = 60$ ms. The two yellow lines show the superimposed clapping body, and the grey colour shows a shadow of the body. (Figure 2c shows the correspondence between the yellow lines and the clapping body.) (b) The wake visualized using the PLIF shows at 45 ms. The starting vortices are marked with red dashed circles. Here
 $M^*$ = 1.0,
 $2\theta _o = 60^{\circ }$ and
 $d^*$ = 0.5.

(a) Schematic showing starting (black circles) and bound vortices (dashed line). (b) Core separation  $S_{cr}$ as a function of time. Here
 $M^* = 1.0$,
 $2\theta _o = 60^{\circ }$ and
 $d^* = 0.5$.

The fluid velocity near the trailing edge of the plate during the clapping phase (figure 8a) shows a jet-like flow between the plates and a signature of the two vortices being formed. Towards the end of the clapping phase (t  $\sim 61$ ms), a wake-like velocity profile is observed (figure 8b). At this time, the plates are almost touching and a small amount of fluid is trapped between them, and dragged along with the body.
Profiles of the X-component of the fluid velocity,  $u_x$, across the line joining the trailing edges: (a) at the midclapping phase; (b) after the end of the clapping phase. The plates of the clapping body are shown by dashed grey lines, black dots show the flow velocity data points and the line joining the data points is a smooth spline fit, and
 $\theta$ is the instantaneous semiclapping angle. Here
 $M^* = 1.0$,
 $2\theta _o = 60^{\circ }$ and
 $d^* = 0.5$.

The circulation around each vortex is calculated using
 \begin{equation} {\varGamma}=\int{\omega}\,{\rm d}A_c, \end{equation}
where  $A_c$ is the area enclosed by a contour within which the vorticity is higher than a cutoff value of
 $5\ \mathrm {s}^{-1}$, which is
 $\omega \leq 0.05 \omega _{max}$ for this case. The circulation evolution is shown in figure 9(a). The circulation increases rapidly until approximately 30 ms, then gradually reduces until approximately 150 ms, after which the reduction is more rapid. Note that the circulation values in the two vortices are nearly identical. The distance between the vortices
 $S_{cr}$ (see figure 7b) also gradually reduces up to 150 ms, after which, it becomes nearly constant when the vortices touch each other. The reduction in circulation at this time (figure 9a) is due to vorticity cancellation in the vortex reconnection zones, discussed in § 3.2.2 and § 3.2.3. The displacements of the left and right vortices in the X-direction (
 $S_X$) closely match, and so do the displacements in the Y-direction (figure 9b). The
 $S_X$–t plot shows (see figure 9b), an initial phase with a slightly lower velocity followed by one with a higher velocity when the two vortices come together. The time period when each vortex has negligible Y displacement, marked by two dashed lines, is used for vortex velocity (
 $u_v$) calculation. In this case,
 $u_v$ is 0.18 m s
 $^{-1}$, four times lower than the maximum body velocity of 0.71 m s
 $^{-1}$. For each case in parametric space, the reported values of the variables
 $u_b$,
 $\dot {\theta }$,
 $\varGamma$ and
 $S_{cr}$ are averaged over three experiments. The error bars are shown in some plots that indicate the scatter obtained from three repeated experiments.
(a) Circulation magnitudes of the left and right starting vortices. (b) The displacements ( $S$) in the X and Y directions of the left vortex (L) and right vortex (R). The black dashed lines indicate the time interval during which we calculate the steady wake vortex velocity
 $u_v$ in the X-direction. Here
 $M^*$ = 1.0,
 $2\theta _o = 60^{\circ }$ and
 $d^*$ = 0.5.

In the following sections, we look at how various parameters (non-dimensional depth  $d^*$, spring stiffness per unit depth
 $Kt$, initial clapping angle
 $2 \theta _{o}$ and mass ratio
 $M^*$) influence the body kinematics (§ 3.1) and the flow, in particular in the wake (§ 3.2).
3.1. Body kinematics
The two main kinematic parameters are the body translation velocity and the angular velocity of the clapping plates.
3.1.1. Translational velocity of the body
The body velocity ( $u_b$), throughout the parametric space, exhibits the same behaviour of rapid increase followed by a slow reduction. For each case in the parametric space, the translational velocity curve is averaged over three experiments. The average of standard deviations over time in
 $u_b$ is less than 6 % of the maximum body velocity. The maximum body velocity (
 $u_m$) lies in the range 0.16 m s
 $^{-1}$ to 0.73 m s
 $^{-1}$ (See table 2). The acceleration phase is in the range of 50–110 ms, whereas the deceleration phase continues for more than 1000 ms. The acceleration of the body is between 0.3 g and 3.5 g, where g is the acceleration due to gravity. In all the cases,
 $u_b$ attains the maximum value close to the end of the clapping motion when the clapping angle is
 $6^{\circ }\unicode{x2013}8^{\circ }$. We illustrate the effect of a particular parameter by plotting kinematic data by changing only that parameter value, with others fixed.
Body kinematics.

In general we found change in the body aspect ratio  $d^*$, does not produce noticeable change in the variation of the body velocity with time. Figure 10(a) illustrates this observation:
 $u_b$ versus
 $t$ curves for three values of
 $d^*$, are nearly identical, especially during the acceleration phase. The relative standard deviation (RSD) in
 $u_m$ due to
 $d^*$ variations is less than 10 % except for
 $Kt_2$ and
 $M^* = 1.5$ case where RSD of 17 % is observed. This invariance with
 $d^*$ for the other cases may be seen in table 2, which lists the
 $u_m$ values for all the different conditions.
Variation of translational velocity  $u_b$ with time: (a) for different
 $d^*$ values, and
 $Kt = Kt_1$,
 $2 \theta _o= 60^{\circ }$ and
 $M^*= 1.0$; (b) for different values of
 $Kt$ and clapping angle
 $2 \theta _o$, and with
 $d^*= 1.5$ and
 $M^*= 1.0$; (c) for different values of
 $M^*$ and
 $Kt$, and with
 $d^*$= 1.5,
 $2 \theta _o= 60^{\circ }$.

The equation of motion for the body in the accelerating phase is
 \begin{equation} \left(m_b +m_{add} \right)\frac{{\rm d} u_b}{{\rm d}t}= F_b. \end{equation}
The net force  $F_b$ (= Thrust
 $F_T$ – Drag
 $F_D$) acting on the body is balanced by an inertial force, where
 $m_{add}$ is the additional mass of fluid that accelerates with the body. The estimation of
 $m_{add}$ is difficult to assess due to the complex motion of fluid during clapping.
In the accelerating phase, independence of  $u_b$ with
 $d^*$ implies that the thrust force per unit depth, and
 $m_{add}$ per unit depth, must be approximately constant. As it to be expected, both the spring stiffness per unit depth (
 $Kt$) and the initial clapping angle (
 $2 \theta _o$) influence the body velocity. The increase in spring stiffness per unit depth from
 $Kt_2$ to
 $Kt_1$, increases the
 $u_m$ by 1.4–2 times, whereas the time corresponding to the velocity maximum (
 $t_{um}$) shows a reduction from 76–121 ms to 47–70 ms (see table 2 and figure 10b,c). A higher initial clapping angle or a lower body mass results in a larger body velocity, though the time to reach maximum velocity does not change much (see figure 10b,c and table 2). A higher body mass reduces the maximum body velocity. The maximum distance covered by the bodies along the X-direction is approximately: 3 BL for
 $Kt = Kt_1$ and
 $M^* = 1$; 2–3 BL for
 $Kt = Kt_1$ and
 $M^* = 1.5$; 1.5–2 BL for
 $Kt = Kt_2$ and
 $M^* = 1$; 1–1.5 BL for
 $Kt = Kt_2$ and
 $M^* = 1.5$.
The translational velocity profiles during the acceleration phase are similar: data from all 24 cases, when plotted as  $u_b/u_m$ versus
 $t/t_{um}$, collapse onto a single curve (figure 11a). During the retardation phase, reasonable collapse is obtained when
 $u_b$ is scaled with
 $u_m$, and time is scaled with time corresponding to when the body velocity has reduced by half from its maximum value (see figure 11b).
Normalized body velocity versus normalized time for all 24 cases during (a) acceleration phase and (b) retardation phase:  $u_m$ is the maximum body velocity;
 $t_{um}$ is the time when
 $u_b = u_m$; and
 $t_{0.5\ um}$ is the time when
 $u_b =u_m /2$ during the retardation phase.

3.1.2. Angular velocity of the clapping plates
The angular velocity shows a rapid increase until it reaches a maximum ( $\dot {\theta }_m$) at the time,
 $t_{\dot {\theta }m}$, and slower reduction to zero as the two plates come close to each other. The influence of change of the various parameters on the time variation in
 $\dot {\theta }$ is similar to that observed for the time variation in
 $u_b$: the
 $\dot {\theta }$ curves do not change with change in
 $d^*$; reduction in the maximum value of angular velocity
 $(\dot {\theta }_m)$ is significant when
 $Kt$ is reduced or when
 $M^*$ is increased. Figure 12(a,c,d) show data on angular velocity from a selected few cases that illustrate these features. Table 2 lists the values of
 $(\dot {\theta }_m)$ for all the 24 cases. The average of standard deviations in
 $\dot {\theta }$ is less than 7 % of the maximum angular velocity. In all the experiments, we observed symmetric clapping, both plates had the same angular velocity. The maximum angular velocity
 $(\dot {\theta }_m)$ ranges from 2 rad s
 $^{-1}$ to 13 rad s
 $^{-1}$ (see table 2).
(a) Variation of angular velocity  $\dot {\theta }$ with time, for different
 $d^*$ values, and
 $Kt = Kt_1$,
 $2 \theta _o= 60^{\circ }$ and
 $M^*$= 1.0. (b) Variation in
 $\theta$ with time, for different
 $d^*$ values, and
 $Kt = Kt_1$,
 $2 \theta _o= 60^{\circ }$ and
 $M^*$= 1.0. Angular velocity
 $\dot {\theta }$ variation with time: (c) for different values of
 $Kt$ and clapping angle
 $2 \theta _o$, and with
 $d^*$= 1.5 and
 $M^*$= 1.0; (d) for different values of
 $M^*$ and
 $Kt$, and with
 $d^*$= 1.5,
 $2 \theta _o= 60^{\circ }$.

The rotational equilibrium of each plate is given by (3.3). In the equation, applied torque,  $T$ (
 $= 2 \kappa \theta$) is proportional to spring stiffness
 $(\kappa )$ and semiclapping angle
 $(\theta )$. Reactive torque can be given as the product angular acceleration
 $(\ddot {\theta })$ and total rotational inertia
 $(I_t)$ which is the sum of mass moment of inertia of the plate
 $(I_b)$ and added inertia of water
 $(I_{add})$. The clapping motion involves complex 3-D unsteady flow due to the simultaneous translation and rotation of the plates. Here
 $I_{add}$ is not negligible in such a flow field, but analytical expressions for it are unavailable. The second term on right-hand side of the following equation is an additional torque (
 $T_f$) due to the fluid that could depend on angular velocity and displacement, analogous to the drag and history forces on bodies moving unsteadily in a fluid:
 \begin{equation} T = (I_b + I_{add}) \ddot{\theta} + T_f (\dot{\theta},\theta). \end{equation}
Since  $T/d$ and
 $I_b/d$ do not vary with
 $d^*$, the angular velocity curves being nearly independent of
 $d^*$ (see figure 12a) implies added moment of inertia per unit depth, and
 $T_f$ per unit depth is nearly the same for all bodies. The differences in
 $\dot {\theta }_m$ with
 $d^*$ are due to the slight and inevitable variations in
 $\kappa$ in the different models (table 1), see table 2. Figure 12(b) shows
 $\theta$–
 $t$ variations for the same three cases as in figure 12(a) and show near collapse. There is some variation in the initial clapping angle, of the order of
 $3^{\circ }$.
Change in  $Kt$ produces a noticeable change in
 $\dot {\theta }$. The increase in spring stiffness per unit depth from
 $Kt_2$ to
 $Kt_1$ increases
 $\dot {\theta }_m$ by a factor of 1.6–2.5 and reduces the time scale over which
 $\dot {\theta }$ reduces to zero. Similarly, the higher initial clap angle results in a higher
 $\dot {\theta }_m$; the increase in
 $\dot {\theta }_m$ is 1.5–2 times when
 $\theta _o$ changes from
 $45^{\circ }$ to
 $60^{\circ }$ (see table 2, figure 12c).
The influence of body mass on  $\dot {\theta }_m$ is marginal, and some of the variation can be attributed to the differences in the actual stiffness value for the same steel plate thickness (see figure 12d). The maximum value of angular velocity is observed at an angular displacement of
 $8^{\circ }$–11
 $^{\circ }$ for
 $2\theta _o = 60^{\circ }$, and
 $5^{\circ }$–9
 $^{\circ }$ for
 $2\theta _o = 45^{\circ }$. The time (
 $t_{\dot {\theta }m}$) when angular velocity reaches its maximum value is most influenced by the spring stiffness per unit depth
 $Kt$ and not so much by in
 $M^*$,
 $d^*$ and
 $\theta _o$; for
 $Kt_1$, the
 $t_{\dot {\theta }m}$ lies in the range 19–28 ms, and for
 $Kt_2$, the range is 28–53 ms.
As in the case of  $u_b$, the
 $\dot {\theta }$–t profiles are similar in the acceleration and in the deceleration phases, and collapse when suitably scaled (figure 13a,b). In the angular acceleration and retardation phase, the
 $\dot {\theta }$ is scaled by its maxima
 $\dot {\theta }_m$. For the acceleration phase time is scaled with time when angular velocity
 $(t_{\dot {\theta }m})$ reaches the maximum value and for the retardation phase by the time
 $(t_{0.5\dot {\theta } m})$ when
 $\dot {\theta }$ reaches half its maximum value.
Normalized angular velocity versus normalized time for all 24 cases during (a) acceleration phase and (b) retardation phase:  $\dot {\theta }_m$ is the maximum angular velocity;
 $t_{\dot {\theta }m}$ is the time when
 $\dot {\theta } = \dot {\theta }_m$; and
 $t_{0.5 \dot {\theta }m}$ is the time when
 $\dot {\theta } = \dot {\theta }_m /2$ during the retardation phase. The data legends are given in figure 11.

3.1.3. Acceleration phase
The acceleration phase, as discussed above, occurs over a short period and lasts approximately until the clapping motion is occurring. A relevant question is how are the body translation velocity and tip velocity of the plates related. The forward motion of the clapping body strongly depends on the rotation motion of the clapping plate. Figure 14(a) shows that maximum body velocity,  $u_m$, and the maximum tip velocity of the clapping plate
 $u_{Tm}$ (
 $= R_c \dot {\theta _m}$) are linearly related across the 24 experimental cases, the linear fit giving
 $u_m = 0.87 u_{Tm} + 0.09$, with
 $R^2$ = 0.86. The body and tip velocities averaged over time (not shown) also are linearly related:
 $\bar {u}_b = 1.54 \bar {u}_T - 0.01$, with
 $R^2 = 0.84$.
(a) Plot of maximum body velocity  $u_m$ versus maximum plate tip velocity
 $u_{Tm}$
 $(=R \dot {\theta }_m)$. (b) The maximum net force acting on the clapping body
 $F_{bm}$ is plotted with the thrust force scaling given in (3.7).

A scaling for the thrust force, acting at least at the initial time, may be obtained by looking at the moment balance on one of the plates:
 \begin{equation} 2 \kappa \theta=I_b \ddot{\theta}+F_p \frac{R_c}{2}. \end{equation}
The torque due to the spring is balanced by the force due to fluid pressure assumed to act at  $R_c/2$,
 $R_c$ being the radius of rotation of clapping plate shown by the yellow dashed line in the figure 2(c). The same pressure force also provides the forward thrust,
 $F_t$ and is
 $= \ F_P\ \sin \theta$. Assuming
 $\sin (\theta ) \sim \theta$ and using (3.4), we get the thrust force acting on a clapping plate is
 \begin{equation} F_t= \frac{4 \kappa \theta^2}{R_c}-\frac{2 I_b \ddot{\theta}\ \theta}{R_c}. \end{equation}
On substituting (3.5) in (3.2), the force equilibrium for the accelerating clapping plate is obtained as
 \begin{equation} \frac{m_b +m_{add}}{2} \dot{u_b}= \frac{4 \kappa \theta^2}{R_c}-\frac{2 I_b \ddot{\theta} \theta}{R_c} - \frac{F_D}{2}. \end{equation}
In the (3.6),  $F_D$ and
 $m_{add}$ are the unknowns. In the initial phase, the body attains maximum acceleration (
 $\dot {u}_m$) and first two terms on right-hand side in (3.6) are of comparable magnitude. We plotted, the maximum force on the clapping body
 $F_{bm}(= m_b\dot {u}_m)$ with
 $\kappa \theta _o^2 /R_c$ to correlate the force in the initial phase with the input parameters. This plot (figure 14b) shows a linear fit with
 $R^2 = 0.91$; hence the scaling for the initial maximum force can be given as
 \begin{equation} F_{bm} \sim \frac{\kappa \theta^2_o}{R_c}. \end{equation}
The body velocity is small in the initial phase of motion (see figure 4a), and the drag force ( $F_D$) can be assumed to be negligible. We may define a thrust coefficient,
 $C_T = F_{bm} / (0.5 \rho \bar {u_T}^2 R_c d)$ and, we find its value to lie between 1.9 to 4.5 for
 $Kt =Kt_1$ and 1.5 to 4.2 for
 $Kt =Kt_2$. For comparison, Martin et al. (Reference Martin, Roh, Idrees and Gharib2017) obtained maximum thrust coefficient values of approximately 15 in their study of clapping propulsion, but where the body was not allowed to translate.
The maximum acceleration  $\dot {u}_m$ gained by the clapping body is proportional to
 $u_m / t_{um}$ (see table 2). On substituting
 $\dot {u}_m \sim u_m / t_{um}$ in (3.7), scaling for
 $t_{um}$ is obtained as
 \begin{equation} t_{um} \sim \frac{R_c m_b u_m}{ \kappa \theta^2_o}. \end{equation}
From energy considerations (§ 3.3), we derive a scaling relation for  $u_m$ (3.26). Substituting (3.26) in (3.8), the scaling relation for
 $t_{um}$ becomes
 \begin{equation} t_{um} \sim \sqrt{\frac{2 m_b}{\kappa}} \frac{R_c}{\theta_o}. \end{equation}
In figure 15, the experimentally obtained values for  $t_{um}$ are plotted against analytically predicted time scale using (3.9); we can see approximately linear trend with
 $R^2$ value of 0.57.


3.1.4. Retardation phase
After the end of the clapping motion, the body experience net drag force that slows down the body. At the end of the clapping motion ( $t=t_{\zeta }$), when the angular velocity of the clapping plate is zero, the corresponding translational velocity
 $u_b$ can be expressed as
 $\zeta \ u_m$: we found
 $\zeta \sim 0.75$, for all 24 cases. The motion of the body in this retardation phase is modelled as a submerged body undergoing retardation due to a net drag force:
 \begin{equation} \left(m_b +m_{add} \right)\frac{{\rm d} u_b}{{\rm d}t_r}=-F_D. \end{equation}
Here  $m_b$ and
 $m_{add}$ represent the body mass and any added mass of water that is carried along with the body, which we will assume to be zero, as the plates are in close contact;
 $t_r$ (
 $=t-t_{\zeta } ; t_r \geq 0$) represents time during the retardation phase. We may write
 \begin{equation} F_D=0.5 C_d \rho A_p u_b^2, \end{equation}
where by  $A_p(=Ld)$ and
 $\rho$ are planform area of the plates and fluid density and
 $C_d$ is the drag coefficient. The solution to (3.10) and (3.11) subjected boundary conditions at the starting of retardation phase when
 $u_b= \zeta u_m$ (
 $\zeta = 0.75$) at
 $t_r = 0$ is
 \begin{gather} u_b= \left(\phi t_r + \frac{1}{\zeta u_{m}}\right)^{-1}, \end{gather}
 \begin{gather} \phi=\frac{0.5 C_d \rho A_p}{(m_b + m_{add})}. \end{gather}
Due to the assumption of  $m_{add} \sim 0$,
 $C_d$ derived from (3.13) is given as
 \begin{equation} {C_d=\frac{2\phi m_b}{\rho A_p}}. \end{equation}
For each case, the value of  $\phi$ is obtained by fitting the experimental data of
 $u_b$ versus
 $t_r$ in (3.12), from which value of
 $C_d$ is calculated using (3.14). A sample case (
 $d^* =$ 1.0 ,
 $Kt = Kt_1$,
 $M^* =1.0$ and
 $2\theta _o = 45^{\circ }$) is shown in figure 16, which shows (3.12) is a good model; for this case, we get
 $\phi = 9.5$, and
 $C_d = 0.051$. The Reynolds number
 $Re$ (
 $=L u_m / \nu$) for this case is 5.5
 $\times 10^4$ . For comparison, at the same
 $Re$,
 $C_d$ for a symmetric aerofoil with 18 % thickness to chord ratio is 0.041 and the
 $C_d$ for NACA 0012 aerofoil is 0.023. Table 2 lists the
 $C_d$ values, and figure 17 shows the
 $C_d$ versus
 $Re$ for the 24 cases, along with
 $C_d$ values given in the literature for an 18 % thick and NACA 0012 aerofoils. We notice that the
 $C_d$ values for
 $M^* = 1.5$ bodies are higher due to the presence of the canopy. Several of the
 $C_d$ values are close to the
 $C_d$ curve corresponding to the 18 % thick aerofoil (see figure 17).
The translational velocity of the body in the retardation phase for the case with  $d^* = 1.0$,
 $Kt = Kt_1$,
 $M^* =1.0$ and
 $2\theta _o = 45^{\circ }$. Blue curve represents a fit to the experimental data, and the red curve is data obtained using (3.12);
 $\phi = 9.5$ for this case.

The calculated values of  $C_d$ plotted versus Reynolds number
 $Re$ for the 24 cases. The black line represents
 $C_d$ for a 18 % thick symmetric aerofoil at zero angles of attack and the
 $C_d$ data is extracted from Munson et al. (Reference Munson, Okiishi, Huebsch and Rothmayer2013). The blue line shows
 $C_d$ values for NACA 0012 aerofoil (National Advisory Committee for Aeronautics) and the data is extracted from Laitone (Reference Laitone1997). The data points legends are given in figure 14.

3.2. Wake dynamics
In this section, we characterize the wake of the clapping body from dye visualizations in the  $XY$ plane and from the 2-D PIV data obtained in the
 $XY$ and
 $XZ$ planes. The PIV data from the mutually perpendicular planes allows us to get the approximate structure of 3-D vortex loops, which are discussed in § 3.2.2. The effect of parametric variations on vorticity field, core separation and circulation is presented in the following subsections.
3.2.1. Vorticity field in the  $XY$ plane: $\omega _z$


The PIV fields at different instants after the start of clapping correspond to the body with  $Kt = Kt_1$,
 $M^*= 1$,
 $d^*=1.5$ and
 $2\theta _o = 60^{\circ }$ are shown in figure 18, where grey colour is used to mark shadow, and yellow is used to identify the rotating portion of the clapping plate. The red and blue patches identify the region with non-zero vorticity, whereas green represents regions with approximately zero vorticity.
The Z-component vorticity fields at different time instants for the body with  $Kt = Kt_1$,
 $M^*$ = 1.0,
 $2\theta _o = 60^{\circ }$ and
 $d^* =$1.5.

Opposite-signed vortices begin to form at the trailing edges of the two plates soon after the motion starts; these are clearly seen at  $t = 0.0195$ s (figure 18b). As the body propels forward, the vortices detach and are left behind. As we shall see below, the circulation around each vortex increases rapidly during the initial time, and by
 $t = 0.0395$ s (figure 18c) it would have reached its peak value. During clapping and just after, as the body moves forward, there is hardly any change in the location and strength of the vortex; at
 $t = 0.1395$ s, the body has moved approximately 75 mm, whereas the vortex pair movement is only approximately 5 mm (figure 18i). The large difference in the velocities of the body and vortex-pair is observed across all the cases in the parametric space (see
 $u_m$ in table 2 and
 $u_v$ in table 3).
Wake dynamics.

The velocity field shows some important features. Two distinct regions are seen during the initial clapping phase (figure 18b,c), one where the fluid has an x-velocity component in the forward direction and the other where the fluid, which is in between the vortices, is moving in the opposite direction. At later times, when the vortex pair has separated from the body, fluid between the plates essentially moves with the body. A distinct wake also can be seen just behind the body (figure 18f–i). However, the vortex patches are isolated with no trailing jet connected to the body. Such type of wake has also been observed in fast-swimming jellyfish by by Dabiri et al. (Reference Dabiri, Colin and Costello2006) and in the squid by Bartol et al. (Reference Bartol, Krueger, Stewart and Thompson2009). Most of the flow features during and just after the clapping described for the case shown in figure 18 are observed for other cases in the parametric space. Main differences arise in the evolution of the vortex loops, significantly when the body aspect ratio ( $d^*$) changes.
3.2.2. Vorticity field in the $XZ$ plane: $\omega _y$


The flow field in the  $XZ$ plane at
 $Y = 0$ reveals the 3-D structure of the vortex loop. The clapping action results in a high-pressure region between the plates that produces not only a downstream jet but also jets from the top and bottom sides of the interplate cavity. Vorticity shed from the top and bottom edges of the plates finally reconnect to form vortex loops whose configurations depend mainly on the aspect ratio
 $d^*$. The starting vortices seen in the
 $XY$ plane are cross-sections of these vortex loops. Figures 19 and 20 show schematics of the vortex loops that form for the bodies with the
 $d^* = 1.5$ and 0.5. These schematics are based on the PIV measurements in both planes and the dye visualizations. During the clapping motion, the rotation of plates forms the vortex loop enveloping the trailing, top and bottom edges. In the case of
 $d^* = 1.5$, at 40 ms, as the body gains forward velocity, a portion of the vortex loop previously attached to the trailing edge detaches (figure 19a) and a process of reconnection with the corresponding loop element from the other plate starts; a similar reconnection happens between the vortex elements from the top and bottom edges. At a later time, around 400 ms, we observe three elliptical vortices (figure 19b), one moving downstream and the other two in the lateral directions. At this time, the lengths, respectively, of the major axis (aligned in the depth direction) and the minor axis are approximately 100 mm and 50 mm; characteristic of elliptical rings, we observe axis switching; at 1300 ms, axis switching is complete (figure 19c). For the
 $d^* = 1.0$ case, wake evolution is similar to the
 $d^* = 1.5$ case. At 400 ms, the wake vortex loop in
 $d^* = 1.0$ case has major and minor axes of 75 mm and 35 mm, and at 700 ms, the minor axis (= 45 mm) is in the vertical direction and the major axis (= 75 mm) is horizontal. Axis switching (see, for example, Dhanak & Bernardinis (Reference Dhanak and Bernardinis1981) and Cheng, Lou & Lim (Reference Cheng, Lou and Lim2016)) occurs primarily due to the inverse dependence on the radius of curvature of self-induced velocities of vortex loops, given by the Biot–Savart law. The flow development for the
 $d^* = 0.5$ case, initially is same as for the
 $d^* = 1.5, 1.0$ bodies, but later shows a more complex structure: at 200 ms, six prominent vortex loops (ringlets) are observed (figure 20a), of which only two vortex loops exist at later times (figure 20b). In all three
 $d^*$ configurations, during the clapping action flow ejected in
 $\pm$Z direction results vortex loop being formed on both the top and bottom regions of the body, see figures 19(b) and 20(a).
Schematic showing the evolution of the wake for the body with  $d^*$= 1.5. (a) The wake shows two vortex loops (blue) enveloping the top, bottom, and trailing edges of clapping plates. (b) Reconnection of the loops leads to formation of three elliptical vortices with one moving downstream having major axis in the Z direction. (c) Elliptical vortex shown after axis switching. The wake evolution for
 $d^*=1.0$ body is similar. For the particular case of
 $Kt = Kt_1$,
 $M^* = 1.0$ and
 $2\theta _o = 60^{\circ }$, the times corresponding to panels (a–c) are 40 ms, 400 and 1300 ms.

The wake for the body with  $d^* = 0.5$ has multiple ringlets (a) at 200 ms (b) out of which only two survive at a later time = 360 ms. Other parameters are
 $Kt = Kt_1$,
 $M^* = 1.0$ and
 $2\theta _o = 60^{\circ }$.

Figure 21 shows the flow fields at different instants in the  $XZ$ plane for
 $d^*$ = 1.5 (figure 21a,d), for
 $d^* = 1.0$ (figure 21b,e) and for
 $d^* = 0.5$ (figure 21c,f). The grey thick vertical line represents a stationary rod of 6 mm diameter, which is part of the release stand. The
 $d^* = 1.5$ case corresponds to the flow field shown in figure 18 in the
 $XY$ plane. At
 $t = 0.3175$ s (figure 21a), when the clapping action is complete, we see two oppositely signed vorticity patches on either side of a high-velocity region; at this time, the body is out of the picture, at
 $x \approx +14$ cm. These two vortex patches connect to the vortices in the
 $XY$ plane as shown in figure 18 to form an elliptical vortex loop. The loop essentially forms after the reconnection of independent vortex loops associated with each clapping plate (figure 19a,b). A detailed discussion on vortex reconnection is found in Kida, Takaoka & Hussain (Reference Kida, Takaoka and Hussain1989) and Melander & Hussain (Reference Melander and Hussain1989). The defocusing digital PIV for stationary pair clapping plates performed by Kim et al. (Reference Kim, Hussain and Gharib2013) also shows similar vortex reconnection. For the
 $d^* =1.5$ case, due to the axis switching (figure 19b,c), the vortex patches in the
 $Y$–
 $Z$ plane move closer with time (figure 21a and figure 21d).
Flow fields in the  $XZ$ plane at different instants corresponding to the body with
 $d^* = 1.5$ (a–d),
 $d^* = 1.0$ (b–e) and
 $d^* = 0.5$ (c–f). Other parameters are
 $Kt = Kt_1$,
 $M^* = 1.0$ and
 $2\theta _o = 60^{\circ }$.

The flow in the wake for the  $d^* = 1.0$ case (figure 21b) shows the strong backward flow and two vortex patches that are less distinct than for the
 $d^* = 1.5$ case. In addition, we can observe outward flow in the Z-direction, created at the top and bottom edges. Towards the left of the picture, forward flow associated with the immediate wake of the body is seen. At a later time (figure 21e), two distinct vortex patches are seen, which is the cross-section in the
 $XZ$ plane of the elliptical loop with horizontal major axis.
For the lowest body depth ( $d^* = 0.5$), the initial flow behind the body shows the six vortex-patch pairs (ringlets) (figure 21c). Later only two vortex ringlets (figure 20b) remain, seen as two pairs of vortex patches in the
 $XZ$ plane (figure 21f). Similar vortex ringlets are observed in the studies of the head-on collision of two vortex rings (Lim & Nickels Reference Lim and Nickels1992; Cheng, Lou & Lim Reference Cheng, Lou and Lim2018).
3.2.3. Strength of the starting vortices
In this section, we present the data on circulation obtained from PIV for the various cases. Circulation is calculated using (3.1), with cutoff values  $\omega \leq 0.05 \omega _{max}$ for
 $Kt_1$ (
 $\omega _{max}$ for
 $Kt_1 = 110\ \mathrm {s}^{-1}$) and
 $\omega \leq 0.07 \omega _{max}$ for
 $Kt_2$ (
 $\omega _{max}$ for
 $Kt_2 = 67\ \mathrm {s}^{-1}$). The average of the standard deviation is less than 12 % of the maximum circulation (
 $\varGamma _m$). It helps to view the evolution of circulation keeping in mind the vortex structures depicted in figures 19 and 20.
In all cases, until the  $\dot {\theta }$ of the plates becomes zero, the
 $\varGamma$ increases rapidly and reaches a maximum value (
 $\varGamma _m$) and its further evolution largely depends on
 $d^*$. The nature of circulation variation until it reaches the maximum is nearly independent of
 $d^*$ (see figure 22 and table 3). The RSD in
 $\varGamma _m$ due to
 $d^*$ variations is less than 12 % for the bodies with
 $Kt_1$ and less than 25 % for
 $Kt_2$. In the case of the body with
 $d^* = 1.5$ and 1.0, the circulation becomes steady after reaching the maximum. In the case of the body with
 $d^* = 0.5$, the circulation shows rapid reduction (see figure 22a) after it reaches the maximum because cancellation of vorticity as the two vortices come close to each other (see figure 23c). A detailed discussion on circulation reduction due to the cancellation of vorticity is found in Melander & Hussain (Reference Melander and Hussain1989).
Variation of circulation ( $\varGamma$) in the starting vortices with time: (a) for different
 $d^*$ values, and
 $Kt = Kt_1$,
 $2 \theta _o= 60^{\circ }$ and
 $M^*= 1.0$; (b) for different values of
 $Kt$ and clapping angle
 $2 \theta _o$, and with
 $d^*= 1.5$ and
 $M^*= 1.0$; (c) for different values of
 $M^*$ and
 $Kt$, and with
 $d^*= 1.5$,
 $2 \theta _o= 60^{\circ }$. For (a–c), circulation is from flow fields measured in the
 $XY$ plane. (d) The time evolution of
 $\varGamma$ of the vortices in the
 $XY$ (top view) and
 $XZ$ (side view) planes during different time periods. Other parameters are
 $Kt = Kt_1$,
 $2\theta _o = 60^{\circ }$,
 $M^* = 1.0$.

Vortex pairs in the  $XY$ plane (a) for the body with
 $d^*= 1.5$ at 300 ms, (b) for the body with
 $d^*= 1.0$ at 300 ms, (c) for the body with
 $d^*= 0.5$ at 200 ms. Other parameters are
 $Kt = Kt_1$,
 $M^*=1.0$,
 $2\theta _o= 60^{\circ }$.

The higher spring stiffness results in higher  $\varGamma _m$, bodies with
 $Kt = Kt_1$ have 2.4–3.4 times higher
 $\varGamma _m$ than those with
 $Kt_2$ for
 $M^* = 1.0$; for
 $M^* = 1.5$ this ratio is 3.0–4.1. The time to reach
 $\varGamma _m$ also reduces with an increase in stiffness (see figure 22b). An increase in
 $\theta _o$ increases the circulation slightly, this increase being much less than that due to variation in
 $Kt$ (see figure 22b). The time corresponding to
 $\varGamma _m$ is approximately independent of clapping angle. The effect of
 $M^*$ on
 $\varGamma _m$ is not clear. The increase in
 $M^*$ increases circulation in the case of bodies with
 $Kt = Kt_1$, whereas this effect is negligible for
 $Kt_2$ cases (figure 22c).
Circulation of vortex patches in the side view ( $XZ$ plane) has been calculated for the cases with
 $Kt = Kt_1$,
 $2\theta _o = 60^{\circ }$,
 $M^* = 1.0$ and
 $d^* = 1.5$, 1.0 and 0.5. In this plane, vortices appear only after the initial vortex reconnection. Figure 22(d) shows the circulation in the side view from 400 ms onwards, and is almost same as the circulation in the top view. In the case of the bodies with
 $d^* = 1.5$ and 1.0, the magnitude of circulation in the top view and side view is approximately the same, implying negligible circulation reduction after the reconnection of vortex loops.
3.2.4. Core separation between the starting vortices
Analysis of core separation distance ( $S_{cr}$) between vortex cores provides an insight into the wake dynamics and confirms the general picture of vortex evolution as depicted in figures 19 and 20. The average of the standard deviation is less than 6 % of the initial tip separation.
The  $S_{cr}$ follows the reduction in the tip distance until the time corresponding to the end of clapping motion, see figure 18. After that, the evolution of
 $S_{cr}$ depends on
 $d^*$. Figure 23(a–c) show the vortex pairs some time after completion of clapping for the three values of
 $d^*$, for
 $Kt = Kt_1$,
 $M^*$ = 1.0 and
 $2\theta _o= 60^{\circ }$. Figure 24 shows PLIF-based dye visualization with the laser sheet in the
 $XY$ plane for the same parameter values as in figure 23. Much of the dye is in the vortices, with some remaining in a trail connected to the body.
Dye visualization in the  $XY$ plane (a) for the body with
 $d^*= 1.5$ at 300 ms, (b) for the body with
 $d^*= 1.0$ at 300 ms, (c) for the body with
 $d^*= 0.5$ at 200 ms. Other parameters are
 $Kt = Kt_1$,
 $M^*=1.0$,
 $2\theta _o= 60^{\circ }$.

Figure 25 shows plots of  $S_{cr}$ versus time, obtained from PIV images, for a few selected cases that show the effect of different parameters. Once the clapping motion is initiated, the starting vortices appear, with the initial separation slightly less than the initial distance between the tips. The subsequent evolution of
 $S_{cr}$ depends most strongly on
 $d^*$ as seen in figure 25(a). For the same parameter values figure 26 shows
 $S_{cr}$ variation obtained from dye visualization images where the vortices could be tracked over longer distances, and we observe for the
 $d^*$1.5 and
 $d^*$1.0 cases, the vortex pairs travel a distance of 15 cm over 1.8 s, and that corresponding to the
 $d^*$0.5 case travels only around 5 cm.
Variation of core separation ( $S_{cr}$) in the starting vortices with time: (a) for different
 $d^*$ values, and with
 $Kt = Kt_1$,
 $2 \theta _o= 60^{\circ }$ and
 $M^*= 1.0$; (b) for different values of
 $Kt$ and clapping angle
 $2 \theta _o$, and with
 $d^*= 1.5$ and
 $M^*= 1.0$; (c) for different values of
 $M^*$ and
 $Kt$, and with
 $d^*= 1.5$,
 $2 \theta _o= 60^{\circ }$. For (a–c), circulation is from flow fields measured in the
 $XY$ plane. (d) The time evolution of
 $S_{cr}$ of the vortices in the
 $XY$ (top view) and
 $XZ$ (side view) planes during different time periods. Other parameters are
 $Kt = Kt_1$,
 $2\theta _o = 60^{\circ }$,
 $M^* = 1.0$.

Time variation of core separation  $S_{cr}$ as obtained using PLIF visualization. Other parameters are
 $Kt = Kt_1$,
 $2\theta _o = 60^{\circ }$,
 $M^* = 1.0$,
 $d^* = 1.5$, 1.0 and 0.5.

For  $d^*$ = 0.5 case, the vortices rapidly approach each other (see also figures 23c and 24c), and later, they disappear due to the vortex reconnection and cancellation discussed above. This vortex pair seen in the
 $XY$ plane corresponds to one of the several vortex loops that form for
 $d^*= 0.5$ (figure 20a). For
 $d^*=1.0$, there is some up and down variation in
 $S_{cr}$ before a rapid increase at around 0.5 s, reaching a maximum value of 86 mm at 0.7 s followed by a drop (figure 26); this variation is consistent with the axis switching of the vortex loop shown in figure 19. For
 $d^*= 1.5$ cases also axis switching is observed; core separation is almost constant shows until 200 ms, after which there is a period of slow increase followed by a rapid one reaching a maximum value of 126 mm at 1.4 s. Note that for both these cases, the maximum vortex separation is close to the depth of the body (
 $d$) (figure 26).
Change in the initial clapping angle changes the initial vortex spacing but the nature of the subsequent evolution in  $S_{cr}$ is similar for both the
 $2\theta _0$ values (figure 25b). Reduction of the spring stiffness per unit depth from
 $Kt_1$ to
 $Kt_2$ slows down the switching process (figure 25b), as is to be expected because both body and vortex propagation speeds reduce. The mass of the body seems to have a negligible influence on the evolution of the vortex spacing (figure 25c) compared with change in the stiffness value.
Figure 25(d) shows the vortex separation in the side view ( $XZ$ plane) for the
 $d^*$= 1.5 case, with the other parameters being same as in figures 25(a) and 26. As discussed above, vortex cores are seen in the
 $XZ$ plane only after the vortex reconnection, which happens at around 300 ms. In figure 25(d), we see a gradual reduction in vortex separation in the
 $XZ$ plane. From the plots of vortex spacing in the two planes (figures 25d and 26), we get get the values of the major and minor axis of the elliptical rings before and after switching: initially major axis, oriented along the Z-direction, is approx
 $= 130$ mm, nearly the same as body depth (figure 21a) and the minor axis is of slightly less than the initial tip distance (figure 19a); at around 1300 ms, after the switching, the major axis is along the Y direction
 $=126$ mm (figure 26), and the minor axis is less than 40 mm. During this phase, the circulation is nearly constant (figure 22d).
3.3. Momentum and energy considerations
In the previous sections, the wake structure obtained in the wake of the clapping body has been discussed. Next, we look at the energy budget, i.e. the conversion of the strain energy ( $SE$) initially in the spring into kinetic energy in the body and in the fluid. At the end of the clapping motion, the energy balance with the assumption of negligible viscous dissipation of energy is
 $$\begin{gather} SE = KE_b + KE_f , \end{gather}$$
 $$\begin{gather}KE_b = 0.5 (m_b + m_{add}) u_m^2, \end{gather}$$
where  $KE_b$ in (3.15) represents the maximum kinetic energy attained by the body and the fluid moving along with it (
 $m_{add}$), corresponding to the time when body velocity has reached its maximum value
 $u_m$, and
 $KE_f$ represents the kinetic energy in the fluid in the wake. To account for all the kinetic energy in the fluid in the wake of the clapping body, we need 3-D velocimetry data, which is not available. Since, at the end of the clapping motion, both plates touch each other resulting in a thin, streamlined body configuration, we neglect
 $m_{add}$ contribution. The energy stored in the two steel plates for the initial angular deflection
 $\theta _o$ is
 \begin{equation} SE = 2 \kappa {\theta_o}^2. \end{equation}
In (3.17),  $\kappa$ is the stiffness coefficient which correlates the strain energy to angular deflection. The details of
 $SE$ measurement are provided in the Appendix A. In (3.15),
 $SE$ is calculated using the initial clapping angle, and the kinetic energy of the body is calculated from
 $u_m$; the only unknown is
 $KE_f$. Furthermore, table 3 shows that approximately 80 % initial stored energy is transferred to the fluid.
We use an approximate relation based on the fluid volume and circulation to calculate the kinetic energy of the fluid in the wake. In the case of bodies with  $d^*= 1.0$ and 1.5, the wake can be modelled as a single vortex ring; furthermore, for scaling purposes, we assume the ring to be circular. The vortex ring radius (
 $R_v$) can be assumed to scale as the cube-root of volume (
 $\forall$) of the fluid present in the interplate cavity; the volume of the cavity is the product of body depth (
 $d$) and the area of the triangular region (
 $0.5\ R_c^2 \sin (2\theta _o)$) indicated by the yellow dashed line (figure 2c); the approximate radius of rotation of the clapping plate (
 $R_c$) is 58 mm:
 \begin{equation} R_v \sim {\forall}^{1/3}. \end{equation}
Expressions are available for impulse ( $I_v$) and kinetic energy (
 $KE_v$) of thin vortex rings (e.g. Sullivan et al. Reference Sullivan, Niemela, Hershberger, Bolster and Donnelly2008) in terms of
 $R_v$, density
 $\rho$ and circulation
 $\varGamma$. For our case we write
 $$\begin{gather} KE_v \sim \rho R_v \varGamma_m^2, \end{gather}$$
 $$\begin{gather}I_v \sim \rho R_v^2\ \varGamma_m, \end{gather}$$
where  $\varGamma _m$ is the maximum circulation.
At the end of the clapping action, the momentum of the body and of the fluid moving forward with it must be equal to the momentum of the fluid moving in the opposite direction in the wake. If we consider the time when the body has reached maximum velocity, we get
 \begin{equation} (m_b + m_{add}) u_m = m_v u_v. \end{equation}
In the above equation, the  $m_{add}$ is the added mass associated with the body, and
 $m_v$ is the mass of fluid associated with the vortex loop. In all the cases, we found
 $u_m$ is always higher than
 $u_v$, implying that
 $m_v$ is always higher than total body mass (
 $= m_b + m_{add}$), see tables 2 and 3. The steady velocity
 $u_v$ is in the range 12–21 cm s
 $^{-1}$ for
 $Kt_1$ and 4–9 cm s
 $^{-1}$ for
 $Kt_2$. The influence of change in
 $d^*$,
 $2\theta _o$ and
 $M^*$ on
 $u_v$ is less, see table 3. The data shows
 $u_v \sim 0.32\ \varGamma _m/ S_{cr}$, where
 $S_{cr}$ is taken when
 $\varGamma = \varGamma _m$.
We may also write the momentum in the fluid in the wake in terms of the circulation using (3.20) for the assumed ‘equivalent’ ring; neglecting  $m_{add}$, we get
 \begin{equation} m_b u_m = c_1 \rho R_v^2\ \varGamma_{m}. \end{equation}
In figure 27, the plot of  $m_b u_m$ versus
 $\rho R_v^2 \varGamma _m$, shows that the two are linearly related, with a linear fit giving a value of
 $c_1$ = 0.45, with
 $R^2$ value of 0.93. The linear fit suggests that the assumption of the linear momentum of the fluid being equal to that of an equivalent vortex ring is valid, even for
 $d^* = 0.5$ case. The
 $u_m$ and
 $\varGamma _{m}$ are obtained from measurements, and
 $R_v$ is obtained from (3.18). A plot of
 $m_b u_m$ versus
 $m_v u_v$ shows a similar fit, on writing
 $m_v$ as
 $\rho R_v^3$, and
 $u_v$ is the measured vortex velocity (table 3).
Plot showing the linear dependence between body momentum and fluid momentum. The data points legends are given in figure 14.

The equation for energy (3.15) at the end of clapping motion with the assumptions of negligible added mass and negligible viscous dissipation of energy becomes
 \begin{equation} 2 \kappa {\theta_o}^2 = 0.5 m_b u_m^2 + c_2 \rho R_v \varGamma_m^2, \end{equation}
where  $c_2$ is a constant obtained by equating
 $KE_f$ with
 $KE_v$. Equations (3.22) and (3.23) may be solved to obtain
 $u_m$ and
 $\varGamma _m$ in terms of the parameters
 \begin{gather} u_m= \theta_o\sqrt{\frac{2 \kappa}{m_b}} \left[\frac{1}{2}+ \frac{c_2}{{c_1}^2}\frac{{m_b}}{\rho{ R_v}^3}\right]^{-1/2}, \end{gather}
 \begin{gather} {{\varGamma}}_{m} = \theta_o \frac{\sqrt{2\kappa m_b}}{\rho R_v^2} \left[ \frac{{c_1}^2}{2}+ c_2 \frac{m_b}{\rho{\ R_v}^3} \right]^{-1/2}. \end{gather}
The above expressions may be used to obtain the velocity of a self-propelling body and circulation in the starting vortex due to the ejection of an impulsive jet in terms of the initial strain energy or work done by the body. In the present study, the ratio of the mass of the body ( $m_b$) to the mass of fluid (
 $\rho {\ R_v}^3$) is much less than one (0.2–0.3 for
 $Kt_1$ and 0.1–0.2 for
 $Kt_2$). However, estimated values of the
 $c_1$ and
 $c_2$ show that the second terms in (3.24) and (3.25) are not negligible. Nevertheless, we plot
 $u_m$ versus
 $\theta _o \sqrt {2 \kappa / m_b}$ (figure 28a) to study the correlation between
 $u_m$ and the input parameters, and see an approximate linear fit with
 $R^2 = 0.75$. Thus, we obtain the scaling for the maximum body velocity as
 \begin{equation} u_m \sim \theta_o\sqrt{\frac{2 \kappa}{m_b}}. \end{equation}
(a) Measured maximum body velocity ( $u_m$) plotted versus the term obtained from (3.24). The black shows a linear fit with
 $R^2 = 0.75$. (b) Measured maximum circulation (
 $\varGamma _m$) plotted versus the term obtained from (3.25) and the linear trend in this figure is captured by black line with
 $R^2 = 0.84$. The data points legends are given in figure 14.

Similarly, based on (3.25), we see a linear relation between  $\varGamma _m$ and
 $\theta _o \sqrt {2\kappa m_b}/(\rho R_v^2)$ (figure 28b). Thus, the scaling for
 $\varGamma _m$ is given as
 \begin{equation} {{\varGamma}}_{m} \sim \theta_o \frac{\sqrt{2 \kappa m_b}}{\rho R_v^2}. \end{equation}
Both figures 28(a) and 28(b) show among the parameters,  $Kt$ has the largest influence: an increase in
 $Kt$ from
 $Kt_2$ to
 $Kt_1$ results in a significant increase in
 $u_m$ and
 $\varGamma _m$. Equation (3.26) implies that
 $KE_b \sim SE$, which means
 $KE_f$ is also proportional to
 $SE$. From the data, we get
 $KE_b = 0.14\ SE$, with
 $R^2$ value of 0.895. In figure 28(b), one notices a certain trend that our analysis does not capture. The data points corresponding to
 $Kt_1$ bunch together, and similarly, those corresponding to
 $Kt_2$, and in each of these groups of points, data for
 $d^* = 1.5$ lie to the right and ones for
 $d^*$ = 0.5 to left and the
 $d^*$ = 1.0 ones lie in between; the model for scaling for
 $\varGamma _m$ clearly needs to be modified to capture the
 $d^*$ influence more accurately. It is puzzling, though, that the model predicts the momentum balance reasonably well (figure 27).
A commonly used performance metric for locomotory bodies, including underwater ones is the cost of transport ( $COT$) (Vogel Reference Vogel1988; Videler Reference Videler1993), defined as the ratio of work done by the body to mass times distance moved. In our case we may write
 \begin{equation} COT=\frac{SE}{m_b\times \Delta S}, \end{equation}
where  $SE$ is the initial energy stored in the body of mass
 $m_b$ and
 $\Delta S$ is the distance travelled.
We may obtain through simple analysis a scaling for  $COT$ for our clapping body. The clapping body travels most of the distance in the retardation phase as the acceleration phase ends in a short time, see figure 4(a,b). The total distance travelled by the body is approximately the distance travelled in the retardation phase and can be obtained by integrating the body velocity with time
 $(=\int {u_b \, {\rm d}t_r})$. Using (3.12) and (3.13), and subject to
 $u_b = \zeta u_m$ (at
 $t_r = 0$) as the lower limit and
 $u_b = \eta u_m$ (
 $\eta \ll 1$) as upper limit that shows body velocity until it reaches a small fraction(
 $\eta$) of
 $u_m$, we obtain
 \begin{equation} \Delta S\cong-{\phi }^{-1} \log(\eta/\zeta) . \end{equation}
Obtaining  $SE$ (
 $\sim m_b u_m^2$) using (3.17) and (3.26), and obtaining
 $\Delta S$ using (3.29), we get the scaling for
 $COT$ as
 \begin{equation} COT \sim \frac{-\rho L}{ 2 \log(\eta/\zeta) }~\frac{u^2_m C_d d}{m_b}. \end{equation}
Figure 29 shows the values of  $COT$ obtained in the experiments using (3.28) plotted versus the scale for
 $COT$ given by (3.30); in the plot,
 $\eta$ is taken as 0.1 and
 $\zeta$ is taken as 0.75. First, the
 $COT$ values for the clapping body in our study vary between 2 and 8, which lies between the
 $COT$ of jellyfish and the
 $COT$ of squid (Gemmell et al. Reference Gemmell, Costello, Colin, Stewart, Dabiri, Tafti and Priya2013). Second, the variation in
 $COT$ is reasonably well captured by the scaling given by (3.30), which indicates the dependence on the various parameters, body mass, body dimensions and drag coefficient. The slower-moving bodies have a lower
 $COT$ value. The lower
 $COT$ for jellyfish may be partly ascribed to their low speeds of the order of a few centimetres per second. A general analysis of the energetics of bodies moving in a fluid (Arakeri & Shukla Reference Arakeri and Shukla2013), including self-propelling ones, shows that energy expended by the swimmer will be lost as fluid kinetic energy in the wake and in viscous dissipation. In the clapping body, we have seen that a substantial portion of the energy is lost in the fluid. What is included in the above scaling is the viscous dissipation in the boundary layers on the body surface. We may expect, for high Reynolds number self-propelling bodies, the kinetic energy lost in wake to scale with
 $\rho u_b^2$, and the scaling in (3.30) may be more generally valid.


4. Concluding remarks
The hydrodynamics of a simple clapping propulsion-based self-propelling body is investigated experimentally. The self-propelling body consists of two plates pivoted together at the front with a ‘torsion’ spring. The clapping action is achieved by release of the plates that are initially pulled apart at the other end. The clapping action of the plates generates a jet that propels the body in a forward direction. Much effort went into making the body neutrally buoyant and fixing the COMs and COBs to ensure stable straight-line motion. Experiments were done by varying the spring stiffness per unit depth ( $Kt$), body mass (
 $m_b$), body aspect ratio (
 $d^*$) and the initial clapping angle (
 $\theta _o$). A total of 24 cases were studied. We used high-speed imaging to obtain the body kinematics and PIV and PLIF visualization to study the wake structure.
The body motion has two phases: a rapid linear acceleration accompanied by the rapid reduction in the clapping angle, which is followed by a relatively slow deceleration of the body until it stops. The first phase is when the forward thrust is produced due to clapping action, and in the second phase, it is the drag force on the closed body that slows it down. The drag coefficient obtained experimentally is in the range 0.04–0.13. In the acceleration phase, we observe that maximum velocity of the body is linearly proportional to maximum tip velocity of the clapping plate (figure 14a). We derived scaling relations for the maximum force acting on the body (3.7) and the time at which it attains the maximum velocity (3.9) in terms of system input parameters. We found that the translational velocity of the body is nearly independent of  $d^*$, though the wake structure showed large differences with change in
 $d^*$.
The wake of the clapping body has complex vortex structures whose cross-section in the  $XY$ plane shows an isolated vortex pair that travels opposite to the body with lower translational velocity than the body. The initial circulation of the vortices is approximately independent of
 $d^*$. The later evolution of the wake is strongly dependent on
 $d^*$: for the
 $d^* = 1.0$ and 1.5 bodies, the vortex loops display axis switching (figure 19) characteristic of elliptical rings, whereas, for the shorter body (
 $d^*$ = 0.5), we observe multiple ringlets (figure 20).
Using a simple vortex ring to model the wake, we use conservation of momentum and energy to derive expressions for body velocity (3.24) and circulation (3.25) in the starting vortex in terms of the initial stored strain energy in the spring and the other parameters,  $d^*$,
 $m_b$ and
 $\theta _o$. These relations will be useful for calculating the velocity of self-propelling bodies under pulsed jet propulsion. The energy budget shows that more than 80 % of initially stored energy is transferred to the fluid. The
 $COT$ of the clapping body varies between 2 to
 $8\ \mathrm {J}\ \mathrm {kg}^{-1}\ \mathrm {m}^{-1}$, which lies between
 $COT$ corresponding to squid and jellyfish (Gemmell et al. Reference Gemmell, Costello, Colin, Stewart, Dabiri, Tafti and Priya2013). The
 $COT$ scaling shows its strong dependence on the maximum body velocity
 $u_m$ (3.30). It must be noted that this
 $COT$ calculation accounts for only the acceleration phase of the body, though the additional energy required for opening the cavity may not be much, especially if done slowly compared with the clapping motion.
Most of the earlier laboratory experiments of clapping propulsion have been with bodies that are constrained from moving forward (Brodsky Reference Brodsky1991; Kim et al. Reference Kim, Hussain and Gharib2013). It is expected that the clapping kinematics and the hydrodynamics will be different when the body is allowed to move, and that is what we have been able to do in the present study reproducing what happens in practice. Some studies have been done on freely swimming animals. Bartol et al. (Reference Bartol, Krueger, Stewart and Thompson2009) measured the swimming speed of squid Lolliguncula brevis to be in the range of 2.43–22 cm s $^{-1}$. Dabiri et al. (Reference Dabiri, Colin and Costello2006) measured the swimming speeds of jellyfish Aglantha digitale to be approximately 13BL/s in fast swimming. In our experiments, the maximum speed attained by the clapping body is 73 cm s
 $^{-1}$ (8 BL s
 $^{-1}$). Our analysis has revealed that the body speed depends on a variety of factors, including the stored strain energy. This study offers an insight into the flow dynamics and the kinematics of a freely moving clapping body, and can have direct practical utility in the design of aquatic robots based on pulsed propulsion. A limitation of the present investigation is confined to one phase, the jet ejection phase. The other phase when the plates open out and fluid enters the cavity will bring in additional parameters and fluid mechanics. The body design will have to be changed substantially to include both phases.
Funding
This work was supported by the Department of Science and Technology, India under ‘Fund for Improvement of S&T’ (grant number FA/DST0-16.009) and Naval Research Board, India (grant number NRB/456/19-20).
Declaration of interests
The authors report no conflict of interest.
Appendix A
Experiments have been conducted to measure initial strain energy ( $SE$) stored in two steel plates of the clapping body. In this experiment, force
 $F$ is applied at the trailing edge of the clapping plate, produces moment
 $M$ on the steel plate of length
 $L_e$. The
 $M$ is given as a sum of the constant moment (
 $FL_P$) due to the rigid plastic plate of length
 $L_P$ and variable moment (
 $Fx$), see (A2). Due to the applied moment
 $M$, the steel plate has an angular deflection
 $\varTheta$ at the end point. The corresponding strain energy is given by the right-hand side of (A1) and is related to the angular deflection as follows:
 $$\begin{gather} \kappa {\varTheta}^2=\frac{1}{2EI}\int M^2\, {{\rm d} x}; \end{gather}$$
 $$\begin{gather}M=-FL_p -Fx. \end{gather}$$
The Young modulus  $E$ is experimentally measured as 212–239 Gpa for the steel plate thickness of 0.14 mm (
 $Kt = Kt_1$) and 175–208 GPa for the steel plate thickness of 0.10 mm (
 $Kt = Kt_2$). The
 $SE$ versus
 $\varTheta$ curve is parabolic in nature, and the second-order polynomial fit gives the values for coefficient
 $\kappa$.


 Open access

