Introduction
The rare earth elements (REEs), comprising a series of elements from La to Lu, are high field-strength elements that are insoluble in water. Their chemical compositions remain stable during weathering transport and sedimentary diagenesis. As a result, they are often employed as crucial proxies in provenance studies of sediments (Ding et al., Reference Ding, Sun, Yang and Liu2001; Xiong et al., Reference Xiong, Sun and Ding2002; Yang et al., Reference Yang, Jung and Li2004; Hao et al., Reference Hao, Guo, Qiao, Xu and Oldfield2010; Drugat et al., Reference Drugat, Pons-Branchu, Douville, Foliot, Bordier and Roy-Barman2019; Peng et al., Reference Peng, Liu, Liu, Cheng, Tian, Chen and Zhou2019; Zhang et al., Reference Zhang, Zhang, Chang, Xie, Li, Wu and Ouyang2021). Studies investigating carbonate depositional environments and paleoclimate fluctuations, including oceanic sediment (Craddock et al., Reference Craddock, Bach, Seewald, Rouxel, Reeves and Tivey2010; Zhao et al., Reference Zhao, Wei, Li, Yang, Zhang, Somerville and Santosh2021), lacustrine deposits (Zhang et al., Reference Zhang, Zhang, Chang, Yang, Lei, Yang, Pu and Lei2009; Zhang et al., Reference Zhang, Zhang, Chang, Xie, Li, Wu and Ouyang2021), and loess accumulation (Wen et al., Reference Wen, Yu, Fuqing, Wang, Chen, Tu and Sun1985; Mao et al., Reference Mao, Mo, Li, Zhou, Yang and Guo2011), have utilized proxy REEs for reconstruction. However, the content of REEs in carbonates is generally very low (<1 µg/g; Zhou et al., Reference Zhou, Wang, Zhao, Zheng, Guan, Feng and Greig2008b), in particular for secondary carbonate sediments in caves, posing challenges for conventional testing methods and analytical instruments.
The first report of stalagmite-based REE contents utilized a cathodoluminescence approach, which showed that the total REEs (ΣREE) in stalagmites increased significantly during relatively humid and warm climate periods (Richter et al., Reference Richter, Gotte, Niggemann and Wurth2004). Subsequently, Zhou et al. (Reference Zhou, Chi, Lawrence, Zhao, Yan, Greig and Feng2008a, Reference Zhou, Wang, Zhao, Zheng, Guan, Feng and Greigb, Reference Zhou, Greig, Tang, You, Yuan, Tong and Huang2012) determined stalagmite REEs in central China using inductively coupled plasma-mass spectrometry (ICP-MS), demonstrating that REEs can sensitively reflect local environmental changes. In addition, the measurements by ICP-MS include both the lattice substitution of calcite and inclusions with colloids and/or particles in carbonates (i.e., speleothems), whereas using cathodoluminescence emission may be mainly sensitive to the substitution between REEs and Ca2+ (Zhou et al., Reference Zhou, Chi, Lawrence, Zhao, Yan, Greig and Feng2008a). In the last decade, Shen et al. (Reference Shen, Wu, Liu, Yu, Chang, Lam, Chou, Lo and Wei2011) improved the capability of REE analysis to achieve a high precision (1.9–6.5%, 2RSD [relative standard deviation]) with a small amount of carbonate sample required (10–20 μg) and short acquisition time (ca. 3 min/measurement) using sector field-inductively coupled plasma–mass spectrometry (SF-ICP-MS). Until recently, the optimization of chemical separation (Barrat et al., Reference Barrat, Bayon, Wang, Le Goff, Rouget, Gueguen and Ben Salem2020) and testing techniques for large sample segments using laser ablation (LA)-SF-ICP-MS (Wu et al., Reference Wu, Burger, Günther, Shen and Hattendorf2018) has made it feasible to analyze the REEs in stalagmites at high spatial resolution.
Marine Oxygen Isotope Stage (MIS) 5, spanning 123–73.5 ka, is characterized by its unique boundary conditions with stronger eccentricity and larger seasonal insolation fluctuations (Jiang et al., Reference Jiang, Wang, He, Hu, Li, Spötl and Shen2016). Specifically, millennial-scale abrupt climate events such as Greenland interstadials (GIS) 25–21, recorded by the North Greenland Ice Core Project (NGRIP) ice core, display sub-millennial scale variability (North Greenland Ice Core Project members, 2004). Among them, the GIS 24 event corresponds to the abruptness of the MIS 5d/5c transition, characterized by the sub-millennial variability of frequently occurring warm and cold spells (Capron et al., Reference Capron, Landais, Chappellaz, Schilt, Buiron, Dahl-Jensen and Johnsen2010). Our previous work indicated that there were four sub-millennial scale δ18O excursions (Wang et al., Reference Wang, He and Jiang2015; Jiang et al., Reference Jiang, Wang, He, Hu, Li, Spötl and Shen2016), corresponding with δ18O sub-cycles recorded in the NGRIP ice core, which reflect the enhanced summer monsoon intensity in low latitudes and associated warming climate state in Greenland. In addition, the abrupt transition of MIS 5d/5c, as a typical feature for North Atlantic climate, is also imprinted in the Asian summer monsoon (ASM) realm inferred from stalagmite δ18O (Jiang et al., Reference Jiang, Wang, Yang, He, Shen and Li2014, Reference Jiang, Wang, He, Hu, Li, Spötl and Shen2016), suggesting a common forcing between high and low latitudes. Although Chinese stalagmite δ18O has been used widely to reconstruct large-scale summer monsoon strength (Cheng et al., Reference Cheng, Zhang, Zhao, Li, Ning and Kathayat2019), how local/regional hydro-geochemistry indicators (e.g., REEs) respond to monsoonal climate background is still not fully understood. Therefore, applying multi-index records to probe the characteristics of climate change, using early–middle MIS 5 as a time window, is helpful to further understand its dynamics under different boundary conditions.
Guizhou Province is located in southwestern China, which has a unique geographical environment affected by both the Indian summer monsoon (ISM) and East Asian summer monsoon (EASM) subsystems. Meanwhile, the phenomenon of REE enrichment is common in the carbonate weathering crust in Guizhou (Lei et al., Reference Lei, Wang, Qian, Zhang, Yang and Qi1994; Sun et al., Reference Sun, Wang and Ji2002; Yang et al., Reference Yang, Yi, Liu and Li2005), making it capable for the study of REEs. In this study, we selected a stalagmite (SX15a) from Sanxing Cave and conducted the REE analysis using ICP-SF-MS, alongside the canonical δ18O record. Our objectives are to (1) discuss the potential sources of REEs in terms of overlying soil–host rock–speleothem; (2) outline the primary characteristics of REE records including content and distribution pattern; and (3) understand the climatic and/or environmental significance and response mechanisms of REEs in the stalagmite during the MIS 5d/5c transition period. Our record provides some new insights into the linkages between the local/regional hydro-geochemistry processes and large-scale monsoon circulation during the early MIS 5.
Study area, material and methodology
Geographic setting
Sanxing Cave (27°22′N, 107°11′E; 720 m above sea level), is located about 80 km southeast of Zunyi City, Guizhou Province (Fig. 1A). The area lies in the transition from the Yunnan–Guizhou Plateau to Hunan Hills and the Sichuan Basin, with a terrain that is high in the northwest and low in the southeast. The surrounding topography of the cave is dominated by low mountains and hills, with dense vegetation covering mainly subtropical evergreen–deciduous broadleaf mixed forest (Fig. 1B). The vegetation cover near the cave entrance has been replaced by human agricultural activities, including the cultivation of various vegetables. Sanxing Cave is hosted by a 30-m-thick Permian limestone with a thin overlying soil (∼0.6 m thick, Fig. 1C). The overlying soil primarily consists of yellow soil and lime soil. The cave is about 2000 m long, where the secondary carbonate deposits inside the chamber are well developed. The measured temperature inside the cave is 12.8°C (April 2010), and the relative humidity is 95–100% (Jiang et al., Reference Jiang, Wang, Yang, He, Shen and Li2014, Reference Jiang, Wang, He, Hu, Li, Spötl and Shen2016, Reference Jiang, He, Wang, Dong, Li, Lone and Shen2019).
Sketch map (A) showing the location of this study (red triangle) with other cave records (black dots) in the Asian monsoon realm, such as Songjia (Zhou et al., Reference Zhou, Chi, Lawrence, Zhao, Yan, Greig and Feng2008a, Reference Zhou, Wang, Zhao, Zheng, Guan, Feng and Greigb) and Xionglong (Tan et al., Reference Tan, Shen, Cai, Lo, Cheng and An2014) in central China, and Valmiki (Raza et al., Reference Raza, Sawant, Ahmad, Sarma and Babu2023) in southern India. The arrows show the dominant circulation subsystems including East Asian summer monsoon (EASM) and Indian summer monsoon (ISM). The dashed line represents the approximate boundary between of the modern monsoon/non-monsoon zones. The ellipse denotes the position of the Siberian-Mongolian Highs (S-M Highs). Field photographs of the overlying vegetation (B) and soil layer (C) of Sanxing Cave are also displayed.

Climatologically, the cave is affected by both ISM and EASM, which belongs to the subtropical monsoon climate zone, with characteristics of subtropical mountain monsoon climate. The long-term observation data from the meteorological station in Zunyi City (from AD 1950 to 2005) show that the average temperatures in January and July are 5.3°C and 25°C, respectively; the average annual rainfall is about 980 mm, mainly concentrated from May to October.
Sample description and analytical methods
A stalagmite sample, SX15a (Fig. 2A), 650 mm in length and 65 mm in diameter, was collected from the chamber, 800 m away from the cave entrance. Cut in half and polished along the growth axis, the profile surface is white and light yellow, and is composed of pure calcite crystals with pores in some layers. A hiatus was identified at the depth of 393 mm from top by a dark strip and a shifted growth axis. In this study, we mainly focus above 393 mm from the top. Six soil samples were collected from two overlying soil profiles (S1 and S2) with a 10-cm sample spacing. Three limestone samples were collected using a hammer, two from outside the cave (DO) and one from inside (DI).
The profile of sample SX15a from Sanxing Cave (A) and depth-age plot (B). Black points labeled on the profile represent the positions of 230Th dates (Table 1); orange bars indicate sampling locations of representative REEs displayed in Figure 3. The middle line indicates the sampling direction along stalagmite growth axis. A possible hiatus was marked with a red line.

For oxygen isotope (δ18O) measurements, a 0.5-mm-diameter carbide dental bur was used along the central growth axis. We drilled 194 powered subsamples, 50–100 µg each, with a 2-mm-interval spacing. These subsamples were analyzed on a Finnigan-MAT 253 mass spectrometer equipped with an automated carbonate preparation system (Gasbench II), finished at the School of Geographical Sciences, Fujian Normal University, China. The δ18O data are expressed as relative to the Vienna Pee Dee Belemnite (VPDB). An international standard of NBS-19, bracketing for every ten subsamples, was applied to monitor the measuring status. The long-term reproducibility is better than ± 0.1‰ (1σ).
For REE analysis, the same drill technique as stable isotope was used. We drilled and collected 71 REE subsamples of the stalagmite, at 5-mm intervals. About 5–10 mg of powder was dissolved with 5% HNO3, diluted to [Ca] of 40 ppm, then measured using an inductively coupled plasma sector field mass spectrometer (ICP-SF-MS, Element 2), at the High-Precision Mass Spectrometry and Environment Change Laboratory (HISPEC), National Taiwan University. The detection limit of REE/Ca is 0.1–0.7 nmol/mol. Ba/Ca ratios vary from 0.05 to 0.17 µmol/mol. Oxide and hydroxide forms of Ba interference levels on Eu were measured and corrected using an intensity ratio of 10.7×10⁻⁶[(137BaO+ + 136BaOH+)/138Ba+] for all carbonate samples. External matrix-matched synthetic standards were used to correct for instrumental ratio drift and mass discrimination (Shen et al., Reference Shen, Wu, Liu, Yu, Chang, Lam, Chou, Lo and Wei2011; Wu et al., Reference Wu, Burger, Günther, Shen and Hattendorf2018). The precision is expressed as relative standard deviation in percentage (RSD, %). The long-term reproducibility for carbonate materials is 1.9–6.5 % (2 RSD). The detailed chemical operations, instrumentation, and calibration methods followed Shen et al. (Reference Shen, Wu, Liu, Yu, Chang, Lam, Chou, Lo and Wei2011).
In this study, La/Sm and Gd/Yb ratios were selected as indicators to assess the enrichment or depletion characteristics between LREEs and HREEs. The Post Archean Australian Shale (PAAS) normalized La/Sm and Gd/Yb ratios are expressed as equations (1) and (2) where subscript N represents the normalization of REE for sample relative to the PAAS:
 \begin{equation}(\text{La}/\text{Sm})_{\text{N}} = (\text{La}/\text{Sm})_{\text{sample}}/(\text{La}/\text{Sm})_{\text{PAAS}} \end{equation}
 \begin{equation}(\text{Gd}/\text{Yb})_{\text{N}}= (\text{Gd}/\text{Yb})_{\text{sample}}/(\text{Gd}/\text{Yb})_{\text{PAAS}}\end{equation}
We calculated the Ce and Eu anomalies following the linear method shown in equations (3) and (4) (Lawrence et al., Reference Lawrence, Greig, Collerson and Kamber2006):
 \begin{equation}\delta \text{Ce} = \text{Ce}_{\text{N}}/\text{Ce}_{\text{N}}* = \text{Ce}_{\text{N}}/(\text{Pr}_{\text{N}}+(\text{Pr}_{\text{N}}-\text{Nd}_{\text{N}}))\end{equation}
 \begin{equation}\delta \text{Eu} = \text{Eu}_{\text{N}}/\text{Eu}_{\text{N}}*= \text{Eu}_{\text{N}}/(3/2\text{Sm}_{\text{N}}-1/2\text{Nd}_{\text{N}})\end{equation}
CeN* or EuN* refers to the PAAS-normalized content by interpolating from neighboring non-anomalous elements. δCe > 1 indicates a positive anomaly whereas δCe < 1 express as a negative anomaly.
The chronological framework was constrained using U–Th dating with nine powdered subsamples. The chemical separation and purification operations for U and Th were those used by previous studies (Edwards et al., Reference Edwards, Chen and Wasserburg1987; Shen et al., Reference Shen, Lawrence Edwards, Cheng, Dorale, Thomas, Bradley Moran, Weinstein and Edmonds2002). Compositions and contents of U and Th were measured on a multi-collection inductively coupled plasma spectrometer (MC-ICP-MS, Neptune) at the HISPEC (Shen et al., Reference Shen, Wu, Cheng, Lawrence Edwards, Hsieh, Gallet and Chang2012). U–Th ages were determined with the corresponding half-lives of 75,584 yr for 230Th and 245,620 yr for 234U, respectively (Cheng et al., Reference Cheng, Lawrence Edwards, Shen, Polyak, Asmerom, Woodhead and Hellstrom2013). The dating results, relative to AD 1950, are shown in Table 1. Statistical errors of the measurements are ±2σ.
U-Th isotopic measurements and 230Th ages for carbonate subsamples on MC-ICP-MS.

Analytical errors are 2σ of the mean.
a δ234U = ([234U/238U]activity - 1) x 1000.
b δ234Uinitial corrected was calculated based on 230Th age (T), i.e., δ234Uinitial = δ234Umeasured X eλ234*T, and T is corrected age.
c [230Th/238U]activity = 1 - e-λ230T + (δ234Umeasured/1000)[λ230/(λ230 - λ234)](1 - e-(λ230 - λ234) T), where T is the age.
Decay constants used for age calculation are available in Cheng et al. (Reference Cheng, Lawrence Edwards, Shen, Polyak, Asmerom, Woodhead and Hellstrom2013).
d Age corrections, relative to 1950 AD, were calculated using an assumed initial atomic 230Th/232Th ratio of 4 (±2) x 10-6.
Results
Chronology
The U–Th dating parameters including isotopic compositions of stalagmite SX15a are presented in Table 1. The 238U contents are relatively high, ranging between 390 × 10−9 g/g and 2228 × 10−9 g/g; while the 232Th contents are relatively low, mostly less than 1000 × 10−12 g/g. The contents of U–Th make overall small dating errors (3–5‰). Corrected ages in stratigraphic order show that stalagmite SX15a was deposited from about 121.7 ka to 103.3 ka. However, a hiatus was found at the depth of 393 mm from top, indicated by a dark strip on the profile and an abrupt shift in deposition rate (Fig. 2). Due to this hiatus, we mainly focused on the samples above 393 mm depth from the top. Given the relatively stable deposition rate during this interval, we adopted a linear interpolation method to establish the age model, corresponding to a time length of 110.1–103.3 ka.
δ18O record
In terms of typical characteristics (as outlined in Wang et al., Reference Wang, He and Jiang2015), the SX15a δ1⁸O sequence can be divided into two stages: (1) during 110.1–107.7 ka, the δ1⁸O values are relatively high, ranging between −7.45‰ and −6.36‰, with an average of −6.83‰, which corresponds to the MIS 5d period; and (2) the interval of 107.7–107.5 ka, in which δ1⁸O shifts rapidly into depletion, ranging from −7.08‰ to −9.98‰, which corresponds to the transition into the Chinese interstadial (CIS) 24 event. Specifically, the CIS24 warm event, which occurred during 107.6–105.5 ka, is characterized by δ1⁸O reaching its overall lowest values, fluctuating around −9.13‰. Subsequently, however, δ1⁸O increases significantly, exhibiting substantial and high-frequency fluctuations.
REE contents
REEs in the stalagmite were determined by the ICP-SF-MS method, which has relatively higher accuracy and precision. The replicate measurements of SX15a subsamples showed that approximately 72% data had RSDs of 0.81–6%, 21% data had RSDs of 6–10%, and a small proportion of data had RSDs of 10–20%. The REE contents in stalagmite SX15a from Sanxing Cave are listed in Table 2. Specifically, ΣLREE values range between 0.05 μg/g and 0.36 μg/g (Fig. 3A). The low levels can be observed at the depth of 375–240 mm (average 0.17 μg/g), which corresponds to MIS 5d. Subsequently, ΣLREE abruptly shifts from 0.17 μg/g to 0.25 μg/g, which marks the beginning of CIS 24. From 125 mm and above, however, ΣLREE decreases with fluctuating patterns before stabilizing at 0.15 μg/g. Similarly, ΣHREE shows an abrupt and significant increase of ∼0.1 μg/g at the 250–230 mm interval and a decline of ∼0.2 μg/g at the 125-mm level (Fig. 3B).
REE contents in stalagmite SX15a with depth. (A) ΣLREE, (B) ΣHREE, and (C) ΣHREE. The abrupt transition from MIS 5d to MIS 5c in the ΣREE records are indicated by the gray-shading bar.

R×10×10 contents of stalagmite SX15a (μg/g).

Generally, the characters of both ΣLREE and ΣHREE are akin to those of ΣREE (Fig. 3C). However, the stalagmite SX15a ΣREE values of 0.1–0.6 μg/g are comparable to those of the Nuoshuihe karst system in northeastern Sichuan (0.2–0.3 μg/g) in central China (Zhou et al., Reference Zhou, Wang, Zhao, Zheng, Guan, Feng and Greig2008b), which are higher than the Valmiki record (0.05–0.3 μg/g) in southern India (Raza et al., Reference Raza, Sawant, Ahmad, Sarma and Babu2023) but lower than northern France values (0.5–20 μg/g) (Pons-Branchu et al., Reference Pons-Branchu, Douville, Roy-Barman, Dumont, Branchu, François, Frank, Bordier and Borst2014). This difference may be attributed to varying climatic conditions and local cave environments across different periods.
REE patterns
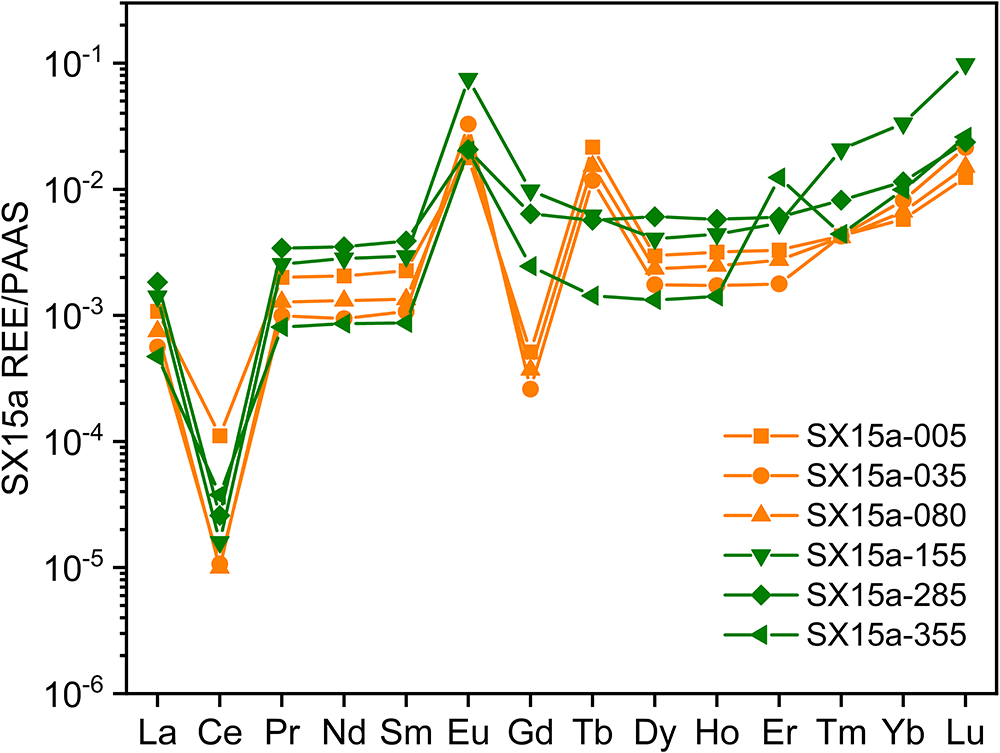
In order to eliminate the ‘odd-even effect’ (Oddo–Harking effect) of saw-toothed REE and express the characteristics of relative abundance and fractionation, the REE contents in rock samples are usually normalized to a common reference standard (Nozaki, Reference Nozaki and Steele2001). Here, we adopted the Post Archean Australian Shale (PAAS, Taylor and McLennan, Reference Taylor and McLennan1985) for carbonate REE normalization, which yielded results similar to those obtained using the North American Shale Composite (NASC, see Supplementary Fig. S1). In order to succinctly highlight typical features illustrated by the REE data, we selected six subsamples to represent different growth stages (SX15a-5, SX15a-35, SX15a-80, SX15a-155, SX15a-285, and SX15a-355 mm, as shown in Fig. 4). The REE patterns of these six subsamples closely resemble those of the overall dataset (Fig. S2), indicating stable and consistent material sourcing during stalagmite formation.
PAAS-normalized REE pattern for stalagmite SX15a. Around the depth of 125 mm (see also Fig S2), the patterns of Gd and Tb are different between lower and upper parts.

The overall picture of REE patterns for stalagmite SX15a shows a seawater-like signature (Nozaki et al., Reference Nozaki, Zhang and Amakawa1997; Deng et al., Reference Deng, Ren, Guo, Cao, Wang and Liu2017), characterized by enrichment in HREE and a Ce negative anomaly (Figs. 4 and S2). Specifically, calculations show that the (Gd/Yb)N is 0.019–0.627 with a mean of 0.254, while the (La/Sm)N is 0.435–0.741 with an average of 0.510, indicating notable HREE enrichment.
Discussion
Possible origins of REE
Different climatic conditions and local cave surroundings can result in different REE features. Previous studies suggested that the activity and migration capacity of REEs in weathering crust and soil would be enhanced under the humid and warm climate in low latitudes (e.g., Zhou et al., Reference Zhou, Wang, Zhao, Zheng, Guan, Feng and Greig2008b), which was the case at this study site. Concurrently, carbonate rocks undergo intense surface weathering and hydrodynamic processes, which enhance the mobilization of REEs into groundwater, where they predominantly occur in forms such as ion adsorption, particles, and colloids, thus facilitating their leaching from carbonate rocks (Zhou et al., Reference Zhou, Wang, Zhao, Zheng, Guan, Feng and Greig2008b, Reference Zhou, Greig, Tang, You, Yuan, Tong and Huang2012; Drugat et al., Reference Drugat, Pons-Branchu, Douville, Foliot, Bordier and Roy-Barman2019). These circumstances provide sufficient origins for REE enrichment in stalagmites, with different provenance backgrounds across various regions.
The depleted LREEs and enriched HREEs, as reported above, are also imprinted in ancient carbonates and modern seawater (Zhao et al., Reference Zhao, Wei, Santosh, Hu, Wei, Yang, Liu, Zhang, Yang and Li2022, and references therein). In general, carbonate ions (CO32−) preferentially bind with HREEs due to the greater complexing ability relative to LREEs (Turner et al., Reference Turner, Whitfield and Dickson1981; Byrne and Sholkovitz, Reference Byrne, Sholkovitz, Gschneider and Eyring1996). Hence, this may be related to the special geological conditions in the karst area of Guizhou, with HREEs dominantly complexed by carbonate ions in the dissolved phase (Han and Liu, Reference Han and Liu2007). The soil in this region consists mostly of weathered carbonate crust, where the migration capacity of HREEs is higher than that of LREEs, a phenomenon also observed in granodiorite (Nesbitt, Reference Nesbitt1979). During enhanced weathering, the HREEs logically undergo preferential leaching. Under a weakly alkaline-water environment abundant in HCO3− ions, REEs migrate mainly in the form of soluble complexes with carbonate and bicarbonate rocks (Zhao et al., Reference Zhao, Wei, Santosh, Hu, Wei, Yang, Liu, Zhang, Yang and Li2022). In the complexation reaction, HREEs exhibit stronger complexation tendency compared to LREEs, and thus more easily form stable complexes (Byrne and Sholkovitz, Reference Byrne, Sholkovitz, Gschneider and Eyring1996; Zhao et al., Reference Zhao, Wei, Li, Yang, Zhang, Somerville and Santosh2021). These mechanisms allow HREEs to migrate from the soil layer and eventually accumulate in stalagmites through karst-water infiltration, resulting in HREE enrichment in stalagmites.
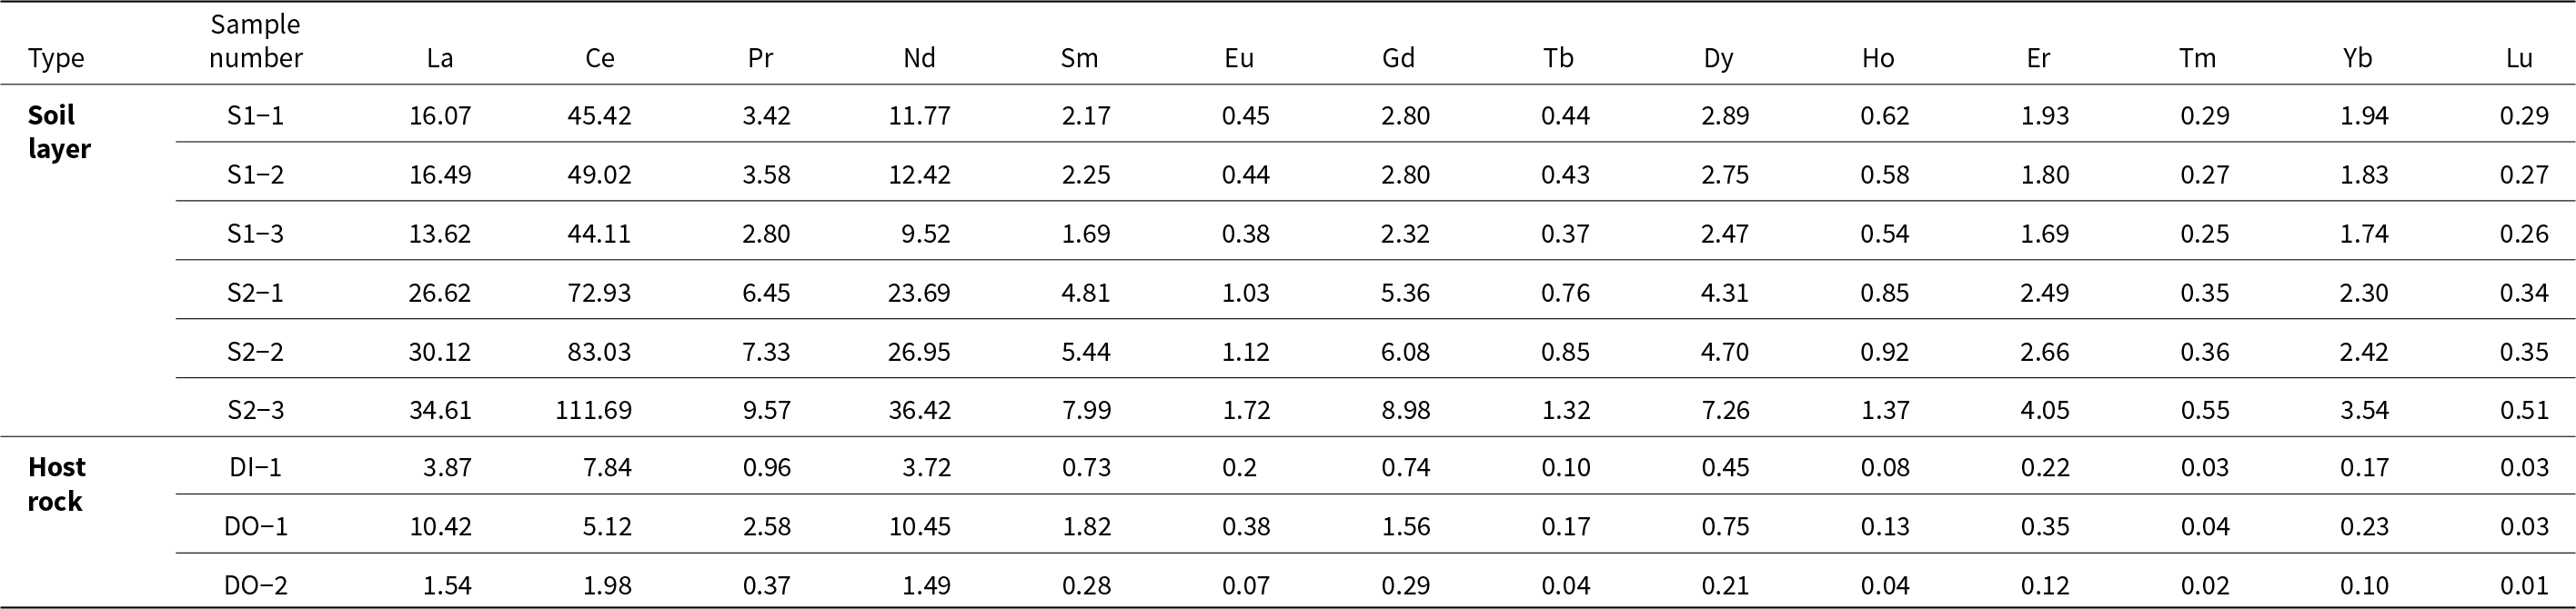
In order to outline the possible REE source of the stalagmite in Sanxing Cave, we analyzed samples of the overlying soil and bedrock, respectively. In terms of REE contents, they are significantly 7 and 409 times higher in soil, averaging from 67.70 μg/g (for Ce) to 0.34 μg/g (for Lu), than those of the host rock and in-cave stalagmite, respectively (see Fig. 5A; Tables 2 and 3). It therefore indicates that the REE signatures originated from the surrounding soil via leaching and transmitting downward, finally being preserved in the stalagmite (Zhou et al., Reference Zhou, Wang, Zhao, Zheng, Guan, Feng and Greig2008b, Reference Zhou, Greig, Tang, You, Yuan, Tong and Huang2012; Tan et al., Reference Tan, Shen, Cai, Lo, Cheng and An2014). The LREE/HREE fractionations of the overlying soil layer, as indicated by (Pr/Yb)N ratios, range from 0.514 to 0.967 with an average of 0.738, inferring an enrichment in HREE. Meanwhile, the PAAS-normalized REE pattern for soil samples displays similar results (see red lines in Fig. 5B), but with a relatively flat shape, overall consistent with that of stalagmite SX15a (Fig. 4). The slight differences occur in the endmembers of typical light and heavy parts, where the slope of SX15a is more noticeable than that of soil. In contrast, the REE pattern for the bedrock demonstrates a more pronounced depletion in HREEs (violet curves in Fig. 5B), characterized by a distinctive MREE bulge ((La/Sm)N = 0.770–0.832, (Gb/Yb)N = 1.755–4.104), which is in concert with previous results from neighboring areas (Lei et al., Reference Lei, Wang, Qian, Zhang, Yang and Qi1994; Yang et al., Reference Yang, Yi, Liu and Li2005; Zhang et al., Reference Zhang, Zhang and Mao2019), but somewhat opposite to those of soil and stalagmite. The difference may be related to the Mn oxyhydroxide preferentially adsorbing LREEs, and Fe oxyhydroxide preferentially adsorbing HREEs in the process of primary carbonate deposition, especially under conditions of weakly alkaline seawater (Surya Prakash et al., Reference Surya Prakash, Ray, Paropkari, Mudholkar, Satyanarayanan, Sreenivas and Chandrasekharam2012; Zhao et al., Reference Zhao, Wei, Li, Yang, Zhang, Somerville and Santosh2021). In addition, the MREEs would be released preferentially during reductive dissolution of Fe–Mn oxyhydroxides, leading to MREE enrichment in seawater and/or sediments (Haley et al., Reference Haley, Klinkhammer and McManus2004; Paul et al., Reference Paul, Volz, Bau, Köster, Kasten and Koschinsky2019). Therefore, we argue that the overlying soil of the cave is likely one of the most important sources contributing to the REE signal preserved in the stalagmite. This conclusion is largely in line with findings from previous studies (Richter et al., Reference Richter, Gotte, Niggemann and Wurth2004; Tyler, Reference Tyler2004; Borsato et al., Reference Borsato, Frisia, Fairchild, Somogyi and Susini2007; Zhou et al., Reference Zhou, Chi, Lawrence, Zhao, Yan, Greig and Feng2008a, Reference Zhou, Wang, Zhao, Zheng, Guan, Feng and Greigb, Reference Zhou, Greig, Tang, You, Yuan, Tong and Huang2012).
REE contents among soil, host rock, and stalagmite (A) and PAAS-normalized patterns of soil and rock (B).

REE contents of the overlying soil layer and host rock (μg/g).

Interestingly, the negative anomaly of Ce and positive anomaly of Eu in the bedrock (Fig. 5B) are consistent with those observed in the stalagmite (Fig. 4), but partially opposite in the soil, especially for Ce. Under a weakly acidic supergene environment such as a carbonaceous weathering crust, Ce3+ is easily oxidized to Ce4+, which is more susceptible to hydrolysis precipitation (Braun et al., Reference Braun, Pagel, Muller, Bilong, Michard and Guillet1990) and/or complexation with Mn–Fe (oxyhydr)oxide particles, organic matter, or clay particles (Byrne and Sholkovitz, Reference Byrne, Sholkovitz, Gschneider and Eyring1996; Ohta and Kawabe, Reference Ohta and Kawabe2001). This results in segregating from other LREEs in the downward migration process. Therefore, the host rock in this instance also plays a regulatory role in REE signals of the deposited stalagmite (Zhou et al., Reference Zhou, Greig, Tang, You, Yuan, Tong and Huang2012), which in turn further verifies that the signals of stalagmite REEs at the study site predominantly originated from surface soil leaching under an oxidation environment. This geochemical process is underscored by the distinctive behaviors of Ce and Eu. In addition, other controlling factors, such as non-carbonate components (Goldstein and Jacobsen, Reference Goldstein and Jacobsen1988; Zhou et al., Reference Zhou, Chi, Lawrence, Zhao, Yan, Greig and Feng2008a) and diagenetic alteration (Zhao et al., Reference Zhao, Wei, Santosh, Hu, Wei, Yang, Liu, Zhang, Yang and Li2022), also should be taken into consideration, thus warranting further investigation in future studies.
REE anomalies
Ce and Eu
As illustrated in Fig. 4, a notable feature of stalagmite SX15a REEs is a prominently negative Ce anomaly, which is concordant with other cave records from central China (Zhou et al., Reference Zhou, Wang, Zhao, Zheng, Guan, Feng and Greig2008b; Tan et al., Reference Tan, Shen, Cai, Lo, Cheng and An2014) and southeastern France (Bourdin et al., Reference Bourdin, Douville and Genty2011), indicating common controlling factors. Given the difference in contents between adjacent elements, neither of which shows any anomalous behavior themselves, the concordance can be regarded as a constant relative to those of ratios (Fig. S3). Thus, we calculated the Ce and Eu anomalies following a linear method (Lawrence et al., Reference Lawrence, Greig, Collerson and Kamber2006).
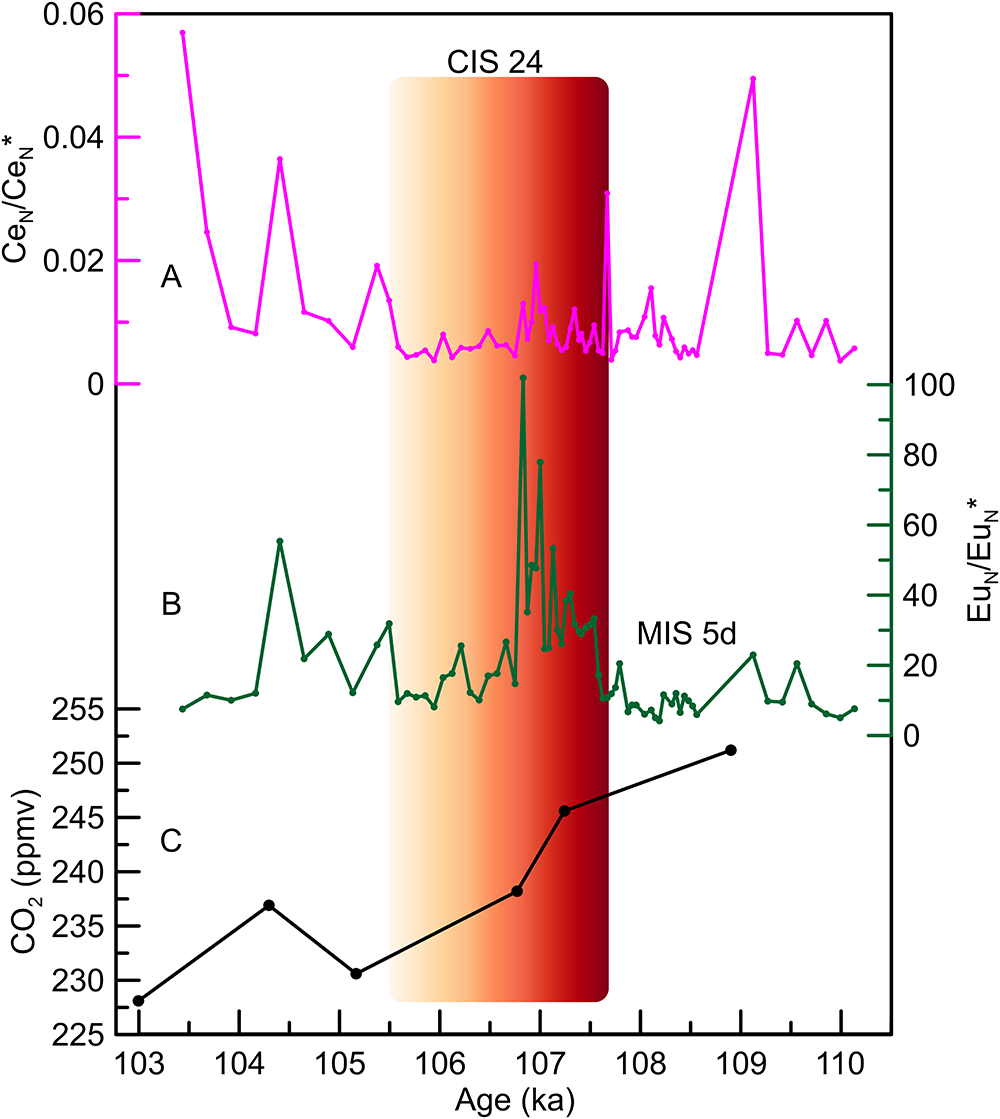
In general, carbonate rocks exhibit an obvious negative Ce anomaly (Zhao et al., Reference Zhao, Wei, Santosh, Hu, Wei, Yang, Liu, Zhang, Yang and Li2022). The δCe values in SX15a range from 0.004 to 0.057, with an average of 0.01 (far less than 1), showing a strong Ce depletion. In contrast, the averaged δCe values of the soil layer and host rock are 1.330 and 0.591, respectively, which supports the REE pattern results discussed above. Therefore, Ce behavior in SX15a significantly deviates from the sources throughout the study period, with the strongest negative anomaly during the wet and warm period (Fig. 6A), suggesting that Ce value is not a merely a consequence of alternating sources or mixing (Zhou et al., Reference Zhou, Greig, Tang, You, Yuan, Tong and Huang2012). In this case, other factors should be considered.
REE anomaly variations for (A) CeN/CeN* (δCe), (B) EuN/EuN* (δEu), and compared with (C) atmospheric CO2 record (Petit et al., Reference Petit, Jouzel, Raynaud, Barkov, Barnola, Basile, Bender, Chappellaz, Davis and Delaygue1999) on the AICC2012 timescale (Veres et al., Reference Veres, Bazin, Landais and Kele2013). The ruby red-shaded bar marks the CIS 24 event. CeN* or EuN* refers to the PAAS-normalized content by interpolating from neighboring non-anomalous elements.

Previous studies suggested that Ce has higher affinity to particle surfaces (Ohta and Kawabe, Reference Ohta and Kawabe2001), in addition to having stronger complexation and mobilization in alkaline solutions than do other LREEs (Goldstein and Jacobsen, Reference Goldstein and Jacobsen1988; Pourret et al., Reference Pourret, Davranche, Gruau and Dia2008). In the process of weathering, soluble Ce3+ is readily oxidized to insoluble Ce4+ (Liu et al., Reference Liu, Hardisty, Lyons and Swart2019; Zhao et al., Reference Zhao, Wei, Santosh, Hu, Wei, Yang, Liu, Zhang, Yang and Li2022), which preferentially adheres onto Mn–Fe (oxyhydr)oxide particles, organic matter, and/or clay particles (Byrne and Sholkovitz, Reference Byrne, Sholkovitz, Gschneider and Eyring1996; Ohta and Kawabe, Reference Ohta and Kawabe2001; de Baar et al., Reference de Baar, Bruland, Schijf, van Heuven and Behrens2018), which segregates Ce from other LREEs. Alternatively, before karstic water percolates into a cave, Ce4+ could be prone to precipitate with CaCO3 due to prior calcite precipitation (PCP, Pons-Branchu et al., Reference Pons-Branchu, Douville, Roy-Barman, Dumont, Branchu, François, Frank, Bordier and Borst2014), especially during dry seasons or over the longer periods of time. This could result in the removal of Ce in the dripping water, which supports the strong negative Ce anomalies in stalagmite. However, the weaker intensity of PCP occurring during wet and warm periods, such as CIS 24 (Fig. 6A), contradicts the stronger negative Ce anomaly during this period. Thus, PCP may not be the main controlling factor. As illustrated in Fig. 6A, a slight rebound of δCe is observed during the time interval of 107.6–106.7 ka, which corresponds to the early stage of CIS 24. This δCe rebound may indicate suboxic circumstances and increased adsorption of colloids and particles in the parent solution, facilitating the mobilization of Ce, possibly due to increased water recharge during the warmer climate. Prominent negative Ce anomalies, which occurred during 110.1–107.8 ka and 106.7–105.5 ka, correspond to relatively dry-cold conditions such as the MIS 5d and late CIS 24, which supports the previous findings in central China (Zhou et al., Reference Zhou, Wang, Zhao, Zheng, Guan, Feng and Greig2008b). This suggests that external factors (e.g., monsoonal rainfall intensity) and soil redox conditions primarily govern the variations in Ce content and its distribution pattern, with partial influence from hydrogeochemical processes (e.g., PCP) in the karst system.
In contrast, Eu shows a distinctive positive anomaly (Fig. 4). The δEu values vary from 4.16 to 101.94 (averaging 20.55) and their pattern closely aligns with those recorded in Xianglong Cave, central China (Tan et al., Reference Tan, Shen, Cai, Lo, Cheng and An2014). Previous studies have indicated that Eu2+ is preferentially transported during soil–water–rock interaction processes, leading to Eu enrichment in groundwater (Guo et al., Reference Guo, Zhang, Wang and Shen2010) and stream waters (Leybourne and Johannesson, Reference Leybourne and Johannesson2008). On one hand, Eu3+ would be reduced into Eu2+ under the reducing conditions, which increases its ion radius, making it easier to substitute Ca2+ into the carbonate lattice (Haskin et al., Reference Haskin, Haskin, Frey, Wildeman and Ahrens1968; Zhao et al., Reference Zhao, Wei, Li, Yang, Zhang, Somerville and Santosh2021). On the other hand, Eu is preferentially released into solution relative to other REEs during the weathering of rock layers rich in Eu2+ (Nozaki et al., Reference Nozaki, Lerche, Alibo and Snidvongs2000). This process allows Eu to enter the karst water system, thereby contributing to a positive Eu anomaly in stalagmite formation. Meanwhile, other research has suggested that the increase of atmospheric CO2 concentration or the decomposition of organic matter may also trigger the release of Eu2+ during weathering in source areas that contain feldspar (Nesbitt, Reference Nesbitt1979; Bolhar and Van Kranendonk, Reference Bolhar and Van Kranendonk2007). The phenomenon coincides with the transition of stadial (MIS 5d) to interstadial (e.g., CIS 24) periods at the study site, characterized by rapidly rising temperature and increased monsoonal precipitation. During the early period of CIS 24, the atmospheric CO2 concentration and temperature are at high levels (Fig. 6C), corresponding with the high δEu levels (Fig. 6B). Furthermore, during this period, increased water discharge and soil leaching under reducing conditions enhanced the activity and concentration of Eu2+ in the solution, ultimately contributing to its incorporation into stalagmite formation. Hence, coupled with enhanced discharge, and subsequent suboxic or even reduction conditions in the soil, δEu significantly rose (Fig. 6B), ultimately leading to segregate from other elements. This is further evinced by the relatively notable increment of δCe during the early age of CIS 24 (Fig. 6A). However, in the latter part of CIS 24, δEu returned to low values. This suggests that reducing conditions were, to a large extent, limited and/or that the oxidation environment was intensified, particularly in the context of declines in temperature and monsoonal precipitation during the late CIS 24.
Gd and Tb
As for the characteristics of Gd and Tb, there are some differences. The patterns below 125 mm in depth show a normal state (Figs. 4 and S2), which are similar to those recorded in Songjia Cave (Zhou et al., Reference Zhou, Wang, Zhao, Zheng, Guan, Feng and Greig2008b) and Xianglong Cave (Tan et al., Reference Tan, Shen, Cai, Lo, Cheng and An2014) in central China, and to seawaters without obvious positive anomalies (Zhao et al., Reference Zhao, Wei, Santosh, Hu, Wei, Yang, Liu, Zhang, Yang and Li2022, and references therein). However, at least in the part above 120 mm, Gd and Tb show negative and positive anomalies, respectively, which match well with the rapidly decreased δEu and lowest value of δCe (Fig. S4). It indicates, as explained above, the predominantly oxidizing environment at this time, corresponding to the mid–late period of CIS 24 (Fig. 6). In addition, petrofacies evidence from the stalagmite profile shows that the milky and yellowish materials are observed at depths below 80–125 mm; while the upper strata become gradually translucent with pure calcite (Figs. 2A and S4C), as the deposition rate slowed significantly (Fig. 2B). Therefore, the Gd and Tb disparities may be linked to epikarst weathering, changes of cave seepage source and by extension, alternations in the cave’s internal environment. Caution is required in the interpretation of these changes for understanding past environment and climate.
Correlation between REEs and paleoenvironmental changes
Previous investigations have indicated that REEs in stalagmites mainly originated from the overlying soil and surrounding rock components of karst caves (Richter et al., Reference Richter, Gotte, Niggemann and Wurth2004; Zhou et al., Reference Zhou, Chi, Lawrence, Zhao, Yan, Greig and Feng2008a, Reference Zhou, Wang, Zhao, Zheng, Guan, Feng and Greigb), and possibly by hydrological dynamics in the karst groundwater (Zhou et al., Reference Zhou, Greig, Tang, You, Yuan, Tong and Huang2012), which is also supported by our study (Figs. 4 and 5). REEs not only are incorporated into carbonate lattices via substituting for Ca2+ (Zhong and Mucci, Reference Zhong and Mucci1995; Schwinn and Markl, Reference Schwinn and Markl2005), but also as inclusions adsorbed on colloids and/or particles (Zhou et al., Reference Zhou, Chi, Lawrence, Zhao, Yan, Greig and Feng2008a; Manoj et al., Reference Manoj, Thakur and Uddandam2021). The release of REEs from soil and/or soil solution, in terms of phase, can be combined with organic ligands (e.g., humic acid and fulvic acid) and inorganic ligands (i.e., carbonates, sulfates, phosphates, etc.) via complex reactions to form complexes (Gwenzi et al., Reference Gwenzi, Mangori, Danha, Chaukura, Dunjana and Sanganyado2018). Nonetheless, climate alternations between humid–warm and dry–cold are important factors affecting the mobility of REEs in weathering crust (Ji et al., Reference Ji, Wang, Ouyang, Zhang, Sun, Liu and Zhou2004). This is supported by the REE indicators in this study, as shown by the contents, patterns, and anomalies as discussed earlier (Figs. 3 and 6; Table 2). Following the above analyses, during the period of higher temperature and accompanying additional precipitation, the leaching effect of weathering would be enhanced, leading to accelerated activity of REEs in soil and weathering crust, and concomitant transport into solution.
In contrast, REEs are prone to be fixed and preserved in minerals and soil under arid climate conditions, and not easily to transported. In addition, the mobilization of REEs in soil and weathering crust is also affected by pH level of the water or soil. In humid and warm climates, vegetation is well developed with enhanced microbial activity in soil, and the contents of organic matter and organic acid in soil increase, lowering the pH value in karst water and strengthening the activity and mobility of REEs in the soil (Fleet, Reference Fleet and Henderson1984). On the other hand, REEs in stalagmites are easily adsorbed on particles and/or colloids. During wet and warm periods, the increased organic matter and organic acids would provide more ligands (Byrne and Sholkovitz, Reference Byrne, Sholkovitz, Gschneider and Eyring1996), and the strengthened rainfall recharging the karst system would produce more transport carriers (Zhou et al., Reference Zhou, Chi, Lawrence, Zhao, Yan, Greig and Feng2008a), which are conducive to REE migration and transportation. Therefore, under humid and warm climate conditions, REE signatures are more likely to transfer into cave stalagmites through seepage water, producing increased REE contents (Richter et al., Reference Richter, Gotte, Niggemann and Wurth2004; Zhou et al., Reference Zhou, Chi, Lawrence, Zhao, Yan, Greig and Feng2008a, Reference Zhou, Wang, Zhao, Zheng, Guan, Feng and Greigb, Reference Zhou, Greig, Tang, You, Yuan, Tong and Huang2012; Hori et al., Reference Hori, Ishikawa, Nagaishi, You, Huang, Shen and Kano2014; Raza et al., Reference Raza, Sawant, Ahmad, Sarma and Babu2023). This phenomenon, in turn, serves as an indicator of past climate change.
To our knowledge, stalagmite δ18O in monsoonal China, especially in southern China, mainly indicate the signature of precipitation δ18O, reflecting the overall summer monsoon intensity on orbital–millennial timescales (Cheng et al., Reference Cheng, Edwards, Sinha, Spotl, Yi, Chen and Kelly2016, Reference Cheng, Zhang, Zhao, Li, Ning and Kathayat2019). There are two processes: (1) the ratios of precipitation δ18O between summertime with more negative values and wintertime with more positive excursions, which eventually are modulated by the intensity of summer monsoon (Wang et al., Reference Wang, Cheng, Edwards, An, Wu, Shen and Dorale2001); and (2) the Rayleigh fractionation from tropical ocean (or upstream) to downstream, as a function of water vapor transport distance (Yuan et al., Reference Yuan, Cheng, Edwards, Dykoski, Kelly, Zhang and Qing2004). Based on the relationship between ‘wind’ and ‘water’ configurations, stalagmite δ18O in northern China generally correlates with monsoonal precipitation at millennial (Dong et al., Reference Dong, Shen, Kong, Wang and Jiang2015; Ding et al., Reference Ding, Cao, Dong, Cong, Liang and Huang2024), and centennial–decadal timescales (Tan et al., Reference Tan, Cai, Cheng, Edwards, Shen, Gao and An2015, Reference Tan, Cai, Cheng, Edwards, Lan, Zhang, Li, Ma, Zhao and Gao2018b).
However, the stalagmite δ18O signal in southern China is influenced by complex factors (e.g., vapor source, atmospheric circulation, local rainfall, convection, and recycle), leading to interpretational ambiguity that is contingent upon geographic configuration. Logically, the precipitation δ18O, and thus stalagmite δ18O in southwestern China, such as in the study area, is more strongly influenced by the Indian summer monsoon due to the region’s geographic proximity (Pausata et al., Reference Pausata, Battisti, Nisancioglu and Bitz2011). For example, two stalagmite δ18O records from Shenqi Cave, located on the southeastern margin of the Tibetan Plateau, provided information on rainfall and/or its seasonality at centennial to decadal timescales (Tan et al., Reference Tan, Cai, Cheng, Edwards, Lan, Zhang, Li, Ma, Zhao and Gao2018a). In addition, recent modern monitoring from Furong Cave, located approximately 190 km from Sanxing Cave in southwestern China, indicated that the active stalagmite δ18O positively correlated with its δ13C under equilibrium fractionation, reflecting ‘amount effect’ on decadal and longer timescales (Qiu et al., Reference Qiu, Li, Chen, Huang, Wang, Wu and Xiao2021). This is further supported by evidence from elemental (Mg, Sr, Ba) and strontium isotope (87Sr/86Sr) analyses obtained from the same cave (Zhang and Li, Reference Zhang and Li2019; Li et al., Reference Li, Li, Shen, Yu, Zhang, Wu, Zhou, Chen and Zhang2021). Based on our previous work on Sanxing Cave (Jiang et al., Reference Jiang, Wang, Yang, He, Shen and Li2014, Reference Jiang, Wang, He, Hu, Li, Spötl and Shen2016, Reference Cheng, Zhang, Zhao, Li, Ning and Kathayat2019; Wang et al., Reference Wang, He and Jiang2015), we can confirm that SX15a δ18O variations are mainly regulated by the ‘mean state’ intensity of summer monsoon associated with precipitation. Our interpretation also is supported by modern meteorological observation (Jiang et al., Reference Jiang, Wang, Yang, He, Shen and Li2014, Fig. 1b), which shows that rainfall during the rainy season (May–October) accounts for 80% of the annual rainfall, corresponding to the depletion in δ18O (−8.9‰).
Between sub-stages MIS 5d and 5c, there are clearly different climatic conditions derived from stalagmite δ18O in Sanxing Cave (Jiang et al., Reference Jiang, Wang, He, Hu, Li, Spötl and Shen2016). The ΣREEs of stalagmite SX15a within the same cave also showed the distinct and rapid shifts at the 5d–5c transition phase, with an increase of 0.2 μg/g in about 250 yr (Fig. 7C), consistent with its δ18O counterpart within SX15a (Fig. 7B), and with the NGRIP ice core δ18O (Fig. 7A), indicating a potential common forcing. During MIS 5d (110.1–107.8 ka), with relatively dry and cold conditions, the SX15a δ18O excursions fall within a positive zone (Fig. 7B) and ΣREE levels are low (averaging 0.3 μg/g; Fig. 7C). This reflects a weakened Asian summer monsoon (ASM), accompanied by decreased hydrochemical recharge that would fix and preserve REEs in minerals and soil. During MIS 5c (107.6–103.4 ka), which was characterized by relatively humid and warm circumstances, δ18O shifts to be negative (Fig. 7B), corresponding to the overall high levels of ΣREEs, which peaked at 0.6 μg/g (Fig. 7C). This suggests strengthened ASM intensity and increased rainfall, enhancing hydrologic dynamics for the dissolution and mobilization of REEs.
Comparisons of regional climate and/or environment between high and low latitudes on millennial–centennial timescales. (A) NGRIP ice core δ18O (North Greenland Ice Core Project members, 2004) on the AICC2012 timescale (Veres et al., Reference Veres, Bazin, Landais and Kele2013), (B) stalagmite SX15a δ18O, and (C) ΣREE within SX15a. The abrupt changes of ASM indicated by δ18O and ΣREE records of SX15a link to the break point of NGRIP δ18O, both of which are overall synchronous marked with gray-shaded bar. NGRIP δ18O data are expressed relative to Vienna Standard Mean Ocean Water (VSMOW). The ΣREE record has suspected outliers at depths of 380 mm and 385 mm (orange points), but the relative amplitude between the two is similar to that of δ18O. Numbers (1–4) on (A, B) and 1′–4′ on (C) indicate centennial-scale subcycles within the CIS24 event.

During the CIS/GIS 24 event, the SX15a ΣREE record captured four sub-millennial-scale climate fluctuations (Fig. 7C). These fluctuations align well, within dating and sampling errors, with canonical records from stalagmite δ18O (Fig. 7B) and NGRIP δ18O (Fig. 7A). The four sub-millennial events, as indicated by ΣREE and δ18O records, took place at around 107.5 ka, 107.1 ka, 106.5 ka, and 105.9 ka. These sub-millennial events are closely linked to the warm conditions in Greenland via atmospheric circulation (Wang et al., Reference Wang, Cheng, Edwards, An, Wu, Shen and Dorale2001; Jiang et al., Reference Jiang, Wang, He, Hu, Li, Spötl and Shen2016), bringing forth a likely rapid coherence between low and high latitudes. However, the relative amplitude of ΣREE for the first sub-millennial fluctuation, at 107.7–107.4 ka, is smaller than those of the latter ones, which contrasts with the larger magnitudes recorded in SX15a δ18O (Fig. 7B) and NGRIP δ18O (Fig. 7A). The discrepancy is likely related to the low sampling resolution of REEs at an interval of 5 mm, in contrast to the 2-mm-spaced samples for δ18O, resulting in the loss of part of the signal. This is further supported by the fourth event, at 105.9–105.6 ka (Fig. 7C), where the decadal variations of ΣREE appear less distinct compared to the high-resolution SX15a δ18O and NGRIP δ18O records.
However, the millennial-scale differences of ΣREE distributions from SX15a δ18O and NGRIP δ18O are also distinct. The relatively elevated levels of ΣREEs during the early stage of the GIS/CIS 24 event (107.7–106.7 ka) correspond well with substantial increases in air temperature and ASM intensity, including during the first two sub-millennia (Fig. 7). Subsequently, ΣREE values rapidly shift from 0.52 μg/g to 0.15 μg/g (Fig. 7C), while the ΣHREE levels drop from 0.26 μg/g to 0.07 μg/g (Fig. S5C), diverging from the SX15a δ18O and NGRIP δ18O trends. Since 106.7 ka, the Greenland temperature has displayed a slight drop (Fig. 7A), and the ASM demonstrated instability with temporary deterioration (Fig. 7B), potentially contributing to the drop of SX15a ΣREE levels. In addition, the microenvironment of the overlying cave soil may have played an important role. As discussed previously, δCe and δEu illustrate obvious differences between the early and late CIS 24 periods, plausibly associated with changes of soil-redox conditions. Specifically, the high ΣREE levels during the early period of CIS 24 may reflect suboxic conditions and increased adsorption of colloids and particles in the parent solution likely reflect large water recharge. This ultimately leads to an accumulation of REEs preserved in stalagmites.
For the latter part of CIS 24, characterized by a slightly and unstably dry–cold climate, the reduction microenvironment was limited and/or the oxidation conditions were enhanced, which resulted in more REEs being retained in soil and minerals, but less accumulation in stalagmites. Furthermore, there were some differences between the ΣHREE and ΣLREE behaviors during late CIS 24 epoch (Fig. S5). The ΣLREE values displayed only a relatively small decline (< 0.1 μg/g) from early to late CIS 24 (Fig. S5D), in contrast to the 0.2 μg/g decline for ΣHREEs (Fig. S5C). Previous studies have shown Fe oxyhydroxide preferentially adsorbing HREEs under weakly alkaline conditions (Surya Prakash et al., Reference Surya Prakash, Ray, Paropkari, Mudholkar, Satyanarayanan, Sreenivas and Chandrasekharam2012; Zhao et al., Reference Zhao, Wei, Li, Yang, Zhang, Somerville and Santosh2021). Therefore, more HREEs would be adsorbed onto Mn–Fe (oxyhydr)oxide complexes during the enhanced oxidation environment, as indicated by lower levels of δCe and δEu (Figs. 6 and S4), during CIS 24. HREEs become more trapped in the soil, while the amount that reaches the cave stalagmite is reduced.
The overall coherent relationships between the ΣREEs and δ18O within the SX15a stalagmite of Sanxing Cave likely support the previous interpretation of stalagmite REEs as indicators of ancient rainfall and associated hydrodynamics (Richter et al., Reference Richter, Gotte, Niggemann and Wurth2004; Zhou et al., Reference Zhou, Wang, Zhao, Zheng, Guan, Feng and Greig2008b; Hori et al., Reference Hori, Ishikawa, Nagaishi, You, Huang, Shen and Kano2014; Tan et al., Reference Tan, Shen, Cai, Lo, Cheng and An2014; Raza et al., Reference Raza, Sawant, Ahmad, Sarma and Babu2023). It further indicates that Chinese stalagmite δ18O, in turn, can reflect the intensity of ASM and associated overall rainfall/humidity conditions. This is corroborated by local hydrological indicators such as REEs, which reflect different aspects of ASM dynamics. However, as discussed above, the controlling factors influencing REEs are complicated by geography, warranting more attention and further investigation.
Conclusions
The REE contents in stalagmite SX15a from Sanxing Cave, southwestern China, were determined using ICP-SF-MS, spanning from 110.1–103.3 ka. This analysis provides insights into provenance and redox conditions associated with regional climate and/or local hydrochemical processes. The REE patterns of stalagmite SX15a indicate consistent features across different time periods, suggesting stable provenance and transportation pathways of REEs during the stalagmite formation in Sanxing Cave. The REE signals are predominantly modulated by the soil and host-rock dissolution in phases of colloids and/or particles and substitutions incorporated into lattices. HREE enrichment was observed for (Gd/Yb)N and (La/Sm)N, which range from 0.019 to 0.627 (∼0.254 average) and from 0.435 to 0.741 (∼0.510 average), respectively. The δCe values range from 0.004 to 0.057 with a mean of 0.01, indicating an obvious negative anomaly; while Eu displays a positive anomaly characterized by δEu centered at 20.55. The ΣREE varied significantly around MIS 5d and 5c, synchronous with its δ18O counterpart and with NGRIP ice core δ18O. Higher levels correspond to the relatively wet–warm climate of MIS 5c, whereas lower levels coincide with the dry–cold conditions of MIS 5d. In the MIS 5d/5c transition period, both ΣREE and δ18O showed a rapid shift, mirrored with that of NGRIP δ18O. Similarities among them are also evident in the four sub-millennial fluctuations within the GIS/CIS 24 event, highlighting the significant role of atmospheric general circulation in rapidly connecting climates across high and low latitudes. The rapid decrease of ΣREE, however, diverged from the SX15a δ18O and NGRIP δ18O behavior during late CIS 24. This may be related to changes in redox microenvironment, where enhanced oxidation conditions under the slightly and unstably dry and cold climate of late CIS 24 led to increased retention of REEs in soil and minerals, but less in the stalagmite. We therefore suggest that the REE variations in the stalagmite from Sanxing Cave serve as valid tracers of local supergene processes, hydrodynamics, and ecology, and exhibit sensitive responds to climate change. Given the complex controlling factors involved, further attention and more detailed studies are warranted.
Supplementary material
The supplementary material for this article can be found at https://doi.org/10.1017/qua.2025.11.
Acknowledgments
The authors would like to thank research assistant Yi-Chi Chen of National Taiwan University for her help in processing the rare earth element test. This work was jointly funded by the National Natural Science Foundation of China (42377440 to X.J., 42402196 to W.H., 42361011 to G.L.), the Science and Technology Research Project of Education Department of Jiangxi Province of China (GJJ211638 to W.H.), and the Natural Science Foundation of Jiangxi Province of China (20232BAB213087 to W.H.). U–Th dating was supported by grants from the National Science and Technology Council (NSTC), Taiwan (111-2116-M-002-022-MY3 and 111-2926-I-002-510-G to C.-C.S.), the Higher Education Sprout Project of the Ministry of Education, Taiwan (112L901001 to C.-C.S.), and the National Taiwan University (112L894202 to C.-C.S.).