I. INTRODUCTION
Nanoscale materials have unique properties compared with both macroscopic bulk materials and individual atoms or molecules. Research in nanoscience focuses on the fundamental study and manipulation of materials to design, fabricate, and characterize structures on the nanometer scale. The ultimate goal is to develop materials and devices that will overcome the existing technological limitations and even create new and novel functionalities. In this respect, the ability to manipulate and measure matter at the nanometer level is making it possible to synthesize a new generation of materials with enhanced mechanicalReference Meyers, Mishra and Benson1, opticalReference Kelly, Coronado, Zhao and Schatz2, plasmonic,Reference Xia and Halas3, Reference Maier, Kik and Atwater4 magnetic,Reference Leslie-Pelecky and Rieke5–Reference Kittel7 and magnetoplasmonicReference González-Díaz, García-Martín, García-Martín, Cebollada, Armelles, Sepílveda, Alaverdyan and Káll8 properties. Nanostructure devices can be based on tailoring these properties starting, at the molecular levelReference Drexler9, Reference Drexler and Foster10, in the structures comprising three-dimensional nanometer scale componentsReference Gleiter11, or they can be based on nanostructured surfaces with lateral features and/or ultrathin films of nanometer scale thickness.Reference Inomata and Saito12–Reference Shtanski, Kulinich, Levashov and Moore14 Because of the partial realization of some of these objectives and the vast potential for future applications, it has captured the attention and imagination of researchers in every area of science.
The focus of this article is to review self-organization due to pulsed laser induced dewetting with examples of robust synthesis of metallic materials with different dewetting nanomorphologies, including holes, polygons, and particles. The size and spatial arrangements of these features can lead to various interesting applications. For example, Ag films and nanostructures have strong plasmonic activity and consequently are very useful in the chemical detection of species via surface enhanced Raman scattering (SERS).Reference Quinten, Leitner, Krenn and Aussenegg15, Reference Willets and Van Duyne16 It is known that the magnitude of the localized field enhancement leading to an increase in Raman scattering is very sensitive to the roughness or asymmetry (aspect ratio) of the nanostructures.Reference Fleischmann, Hendra and MacQuillan17 Therefore, controlling the morphology and nanostructure characteristics of metals like Ag in a reliable and cost-effective manner is very important toward further improving the sensitivity and selectivity of SERS detection. Likewise, present research on magnetic devices is concentrated on reducing the component size to achieve high density. Nanosized magnetic structures are important for many applications, such as in nonvolatile and high speed magnetic random access memories,Reference Chou, Krauss and Kong18, Reference New, Pease and White19 high density magnetic data storage,Reference Krauss, Fischer and Chou20–Reference Todorovic, Schuttz, Wong and Scherer22 optoelectronicsReference Salerno, Krenn, Lamprecht, Schider, Ditlbacher, Felidj, Leitner and Aussenegg23 and biological applications.Reference Molday and Mackenzie24, Reference Jordan, Scholz, Wust, Schirra, Schiestel, Schmidt and Felix25
Toward this end, the spontaneous formation of patterns of well-defined structures by self-assembly and/or self-organization is a fundamental and technologically relevant topic. Various materials systems show self-organizing characteristics: atoms rearrange in a predictable manner to form specific crystals, epitaxially strained thin films break into quantum dots,Reference Ross, Tersoff and Tromp26 and biological systems show characteristic patterns and length scales.Reference Kondo and Asal27 The processes involved in these systems possess some very attractive features from the perspective of manufacturing processes, namely, they are repeatable and cost effective. Another important characteristic is that such spontaneous processes can encompass a wide range of length (and time) scales, from nanometers such as from thin film dewettingReference Favazza, Kalyanaraman and Sureshkumar28 to hundreds of kilometers, as seen in geographical structures.Reference Ashton, Brad Murray and Arnault29 Therefore, the study of self-organizing systems is of tremendous importance and will likely play an important role in the realization of various nano- and microtechnologies.
One such process is dewetting, where an initially smooth film on a partially wettable substrate undergoes morphological changes to reduce the free energy of the film–substrate–ambient system. One particular phenomenon that has captured the attention of theorists and experimentalists over the past 50 years is spontaneous dewetting leading to predictable morphologies and length scales.Reference Vrij30, Reference Vrij and Overbeek31 From a theoretical perspective this spontaneous or self-organizing process is intriguing as it sheds light on how an unstable system selects a pathway for the reduction in energy. From a practical perspective this process is robust, i.e., it produces the same predictable length scales and morphologies, and hence is attractive as a manufacturing process. The spontaneity arises because there is no need to overcome an energy barrier, much like in phase separation by spinodal decomposition. Whereas dewetting dynamics leading to particle formation have been studied in detail in room temperature polymer liquid films,Reference Reiter32–Reference Sharma and Ruckenstein38 studying dewetting in metals, semiconductors, and ceramics is challenging because of the high melting point of these materials. Achieving the robust length scales through dewetting of spinodally unstable films in the solid state via conventional thermal annealing is complicated because various surface processes including metal–substrate chemical interactions and metal diffusion into the substrate can influence dewetting.Reference Pretorius, Harris and Nicolet39, Reference Ho, Nguyen, Chang, Machesney and Geiss40 Furthermore, dewetting in the solid state is also not a cost-effective and practical approach because the time scales of solid-state mass transport processes are quite large, making dewetting a slow process.Reference Favazza, Kalyanaraman and Sureshkumar41 Therefore, it is necessary to consider alternate techniques to raise the temperature in a controllable but rapid manner such that the solid film can be melted and subsequently undergo morphological changes due to dewetting. Two such techniques are ion irradiationReference Hu, Cahill and Averback42, Reference Hu, Cahill and Averback43 and pulsed laser heating.Reference Bischof, Reimmuth, Boneberg, Herminghaus, Palberg and Leiderer44 In the mid-1990s, it was shown that when a nanosecond laser pulse was used to melt thin metal films (Au, Cu, and Ni) deposited on SiO2 surfaces with a thin Cr metal buffer layer, results yielded evidence for dewetting with characteristics similar to that for spinodally unstable systems.Reference Bischof, Reimmuth, Boneberg, Herminghaus, Palberg and Leiderer44, Reference Herminghaus, Jacobs, Mecke, Bischof, Fery, Ibn-Elhaj and Schlagowski45 In the past few years, tremendous progress has been made toward understanding this dewetting pattern formation in metal films following nanosecond pulsed laser irradiationReference Favazza, Kalyanaraman and Sureshkumar28, Reference Bischof, Reimmuth, Boneberg, Herminghaus, Palberg and Leiderer44–Reference Trice, Favazza, Thomas, Garcia, Kalyanaraman and Sureshkumar50 and toward the synthesis of novel magnetic materials.Reference Krishna, Miller, Longstreth-Spoor, Nussinov, Gangopadhyay and Kalyanaraman51, Reference Krishna, Strader, Gangopadhyay and Kalyanaraman52 The remainder of this review is dedicated to discussing the current state of pulsed laser dewetting of ultrathin metallic films on nonwetting substrates.
II. DEWETTING THEORY
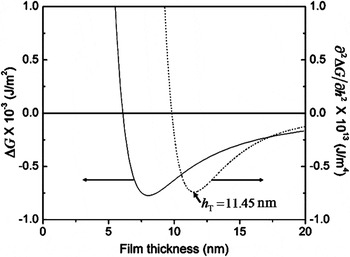
Based on the findings from studies in the past 50 years on the dewetting of thin polymer films, it is evident that dewetting is a practical processing technique. These studies have uncovered several features that are very relevant to nanomanufacturing strategies. The most important is that thermodynamically unstable polymer film–substrate systems show evidence for spontaneous dewetting with well-defined intermediate and final morphologies and length scales. For film–substrate systems that show this effect, there is a strong resemblance between the shape of the free energy as a function of film thickness to the composition dependent behavior in binary systems showing spinodal phase segregation.Reference Cahn53 In polymer films and metal films on inert amorphous substrates such as SiO2 (of relevance to the experimental results to be discussed later in this article), the commonly observed volume free energy term arises from intermolecular dispersion forces. The atomic origin of this intermolecular force is the van der Waals interaction between nonpolar atoms in which the interaction energy varies as 1/h 6, where h is the spacing between the particles. The extension of this pointlike interaction energy to describe the free energy of interaction between planar interfaces is achieved by a pairwise addition of the van der Waals interaction. This results in an energy per unit area expressed as  , where A is the Hamaker coefficient, which determines the sign and magnitude of interaction between the substrate–film and film–vacuum interface. The Hamaker coefficient A can be calculated through a relation of the frequency-dependent dielectric coefficients of the different media, which is summed over the entire frequency regime and is proportional to (ε1−ε2)(ε2−ε3), where ε1, ε2 and ε3 are the dielectric functions of the substrate, film, and vacuum, respectively.Reference Israelachvili54, Reference Parsegians55 From the Hamaker relation, it is seen that the interaction free energy is attractive when the film has a larger (or smaller) dielectric than both the substrate and the vacuum (or vapor). In polymer liquids and metal films on dielectric substrates like SiO2 in a gaseous or vacuum medium, the free energy is attractive. It is more important that, for films in the thickness regime of 1–100 nm, for which gravitational energy is negligible, the curvature of the free energy is negative, i.e., d 2G/dh 2 < 0, as shown in Fig.1Reference Krishna, Sachan, Strader, Favazza, Khenner and Kalyanaraman56. This unstable regime strongly resembles the free energy curvature found within the spinodal regime of binary phase segregating systems.
Plot of the  free energy ΔG and (…) free energy curvature (∂2ΔG)/∂h 2, as a function of film thickness for Ag on SiO2. The thickness regime with negative curvature corresponds to the spinodal dewetting regime. In addition, the transition thickness h T, which corresponds to the minimum in the curvature, differentiates regions with different dewetting morphology (from Ref. 56).

Another important finding from dewetting studies of unstable films is the progression of the morphology from an initially smooth liquid film to the final droplet state. This occurs with intermediate states that have well-defined length scales and complex morphologies. Generally, two different intermediate morphologies are seen before the final particulate state: the film breaks by the formation of holes followed by polygonal structures or through the formation of bicontinuous structures.Reference Reiter32–Reference Thiele, Velarde and Neuffer35 In this dewetting instability regime, which is typically found for films with thickness 1 ≤ h ≤ 100 nm, the formation of holes or bicontinuous structures occurs spontaneously and characteristic length scales emerge, because the subsequent dewetting dynamics are characterized by a narrow spread of preferential or fastest growing length scales.Reference Vrij30, Reference Vrij and Overbeek31 As shown theoretically, the dynamics leads to the selection of characteristic patterning length scales λ that vary with film thickness as λ∝h 2,Reference Vrij30, Reference Sharma and Ruckenstein38, Reference Sharma57, Reference Seemann, Herminghaus and Jacobs58 which is known as classical spinodal dewetting behavior. This has been observed experimentally by several authors, verifying the existence of a spontaneous, self-organizing, spinodal-like process for polymericReference Reiter32, Reference Seemann, Herminghaus and Jacobs58 as well as metallic films.Reference Favazza, Kalyanaraman and Sureshkumar28, Reference Herminghaus, Jacobs, Mecke, Bischof, Fery, Ibn-Elhaj and Schlagowski45 However, the fluid dynamics for even the simplest dewetting scenario is a highly nonlinear process. Although this can be solved by many numerical techniques,Reference Sharma and Khanna36, Reference Becker, Grun, Seeman, Mantz, Jacobs, Mecke and Blossey59, Reference Trice, Kalyanaraman, Sureshkumar, Postek and Allgair60 a linear analysis is often employed to achieve physical insights into the dewetting process. An alternate approach to quantitatively evaluate dewetting is by the energy rate (ER) approach. Fluid flow pathways can be analyzed through thermodynamic considerations, in which the rate of conversion of useful internal energy to external energy loss via heat, such as by viscous dissipation, is used to quantify the behavior.Reference de Gennes, Brochard-Wyart and Quere61 Such an approach can provide meaningful insight into the nature of fluid flow as well as the energy pathway for dewetting instabilities. Specifically, the thermodynamic or ER formulation can be applied to the case of dewetting, where film thickness dependent Marangoni or thermocapillary forces are also present. Such a situation has been observed in the melting of thin metallic films by nanosecond pulsed lasers.Reference Trice, Favazza, Thomas, Garcia, Kalyanaraman and Sureshkumar50, Reference Krishna, Shirato, Favazza and Kalyanaraman62
A. ER approach to dewetting self-organization
In the ER approach, the rate of free energy decrease due to film thickness fluctuations is balanced with the rate of energy loss due to viscous flow, i.e., viscous dissipation.Reference de Gennes63 This leads to an analytical description of the dewetting process without any need for linearization. The ER and linear stability approach show identical results for classical dewetting. Here, we first estimate the viscous dissipation for the simple case of an incompressible liquid thin film undergoing one-dimensional flow using the Navier–Stokes equation within the lubrication approximation. A complete analysis is provided in Ref.Reference Kondic64. In the lubrication approximation the average or unperturbed thickness h 0 of the film is much smaller than the in-plane dimension, x, the result of which is that the only velocity change of importance occurs along the thickness direction. Furthermore, because of the small thickness of the film, inertial effects can be neglected and so the flow is dominated by viscous effects. Using the above approximations, the velocity v as a function of height z is

Typical boundary conditions used to analyze the classical dewetting instability are the no-slip condition at the film–substrate, so v(h = 0) = 0, and a stress-free boundary condition at the top film surface. The no-slip condition results in b = 0. At the top surface, one may introduce an h -dependent Marangoni effect by equating the shear stress to the surface tension gradient:

where γ(h) is the h -dependent surface tension of the film–vapor interface, |γh| = |dγ/dh| is the magnitude of the height coefficient of surface tension, and dh/dx = h′ is the thickness/height gradient along the flow direction, with all quantities evaluated at the average film thickness h 0. From this, the rate of energy loss due to viscous fluid flow, i.e., the viscous dissipation per unit volume  , occurring in the film is obtained from the followingReference Shirato, Krishna and Kalyanaraman65:

For the case of classical dewetting, i.e., in which Marangoni forces are absent (γh = 0), the viscous dissipation per unit volume will be

where the superscript C denotes classical.
Next, one can evaluate the rate of thermodynamic free energy change ΔF for fluctuations or perturbations to the initial height of the film. Because we are primarily concerned with the dewetting instability, we will use the classical approach proposed by Vrij in which the film–vapor surface energy competes with the attractive dispersion energy. Film height perturbations will increase the top film surface area, and so the surface tension increases the overall thermodynamic free energy of the film. By contrast, the long-range attractive dispersion energy varies as A/2πh 4(=Π″), where A is the Hamaker coefficient with negative sign, leading to an overall decrease in thermodynamic free energy. As Vrij showed, it is the free energy decrease resulting from competition between these two energy terms that drives the dewetting instability. Here we evaluate the rate of this free energy change by expressing the height perturbations as Fourier components of type

where the perturbation has an amplitude of ∈, a characteristic temporal decay rate σ, and a corresponding wave vector k. It is important to note here that the ensuing analysis also works if a sinusoidal height perturbation of type h(x, t) = h 0eσt cos kx is chosen. In this work we explore the solution for the classical problem, without a thermocapillary or Marangoni effect50,62, thus the surface tension derivative with respect to the film height is zero, i.e., γh = dγ/dh = 0. In this case, the resulting change in free energy will be

Therefore, the rate of change in the free energy per unit area can be calculated at any position x (see Ref. 31) as

The first term in the expression on the right-hand side is the rate of increase of surface tension energy, and the second term is the rate of change in energy from the dispersive interaction.
B. Dispersion relation based on ER approach
Based on the functional forms of viscous dissipation and rate of free energy change, the dispersion relation can be obtained by equating the two quantities (by appropriately accounting for the dimensional values). The total viscous dissipation per unit area  for the liquid film is obtained by integrating over the film thickness as follows:

The next step in evaluating this integral is to relate the pressure gradient to the film height through a volume conservation argument. Volume conservation requires that the rate of change of film height ∂h/∂t be related to the flux of liquid flow J(x) as ∂h/∂t = −∇•J(x). To evaluate this we used the thin film lubrication approximation in which flux can be written in terms of the height-averaged liquid velocity <v> as [64]

from which we can express the volume conservation equation as

By rearranging terms we attain the desired relation for the pressure gradient as follows:

where we have made use of Eq. (4). Using this expression in Eq. (7), the total dissipation is

Then, equating Eq. (11) with the rate of decrease of free energy, Eq. (6),  , and expressing the result in terms of σ, we get the dispersion relation from the ER approach:

from which the classical dewetting length scale Λc can be expressed as

This result shows that the ER approach gives similar results for the length scale of the classical dewetting instability as the linear stability analysis approach.Reference Vrij30
III. PULSED LASER ASSISTED SELF-ORGANIZATION OF METAL FILMS
The first pulsed laser dewetting experiment was performed in the mid-1990s by Bischof and coworkers.Reference Bischof, Reimmuth, Boneberg, Herminghaus, Palberg and Leiderer44, Reference Herminghaus, Jacobs, Mecke, Bischof, Fery, Ibn-Elhaj and Schlagowski45 They studied the dewetting of thin Au, Cu, and Ni liquid films on fused silica substrates, where a single laser pulse with a width of 7 ns with energy sufficient to melt the film was utilized to capture dewetting. The change in film morphology was investigated following irradiation by a single laser pulse for various laser energies above the film’s melt threshold. Because the resolidification occurred at extremely fast rates (∼1011 K/s), any film dewetting during the liquid phase was essentially quenched-in following the laser pulse. Therefore, it was possible to characterize the dewetting morphology by performing scanning electron microscopy (SEM) after laser irradiation. Their investigations revealed two distinctly different modes of the dewetting characteristics. For lower laser energies, heterogeneous nucleation of “dry” circular patches with a random spatial distribution was observed. In contrast, for large laser energies, the resulting surface deformation showed characteristic wave lengths Λ that varied with the initial film thickness as Λ ∝ h 2, thus confirming the spinodal nature of metal film dewetting. Following this preliminary work, the study of dewetting pattern formation and self-organization leading to spatially ordered nanoscale patterns under irradiation by multiple pulses of nanosecond laser light of metal films was pursued by other groups.Reference Favazza, Kalyanaraman and Sureshkumar28, Reference Henley, Carey and Silva46–Reference Favazza, Trice, Kalyanaraman and Sureshkumars49, Reference Trice, Thomas, Favazza, Sureshkumar and Kalyanaraman66 These studies have helped determine unambiguously that pattern formation is primarily due to various liquid-phase instabilities, including spinodal dewetting instability,Reference Favazza, Kalyanaraman and Sureshkumar28, Reference Favazza, Trice, Gangopadhyay, Garcia, Sureshkumar and Kalyanaraman47, Reference Favazza, Trice, Krishna, Kalyanaraman and Sureshkumar48 thermocapillary or Marangoni flow,Reference Favazza, Trice, Kalyanaraman and Sureshkumars49 and Rayleigh-like instabilities that break up a cylindrical column of liquid into droplets. These experiments confirmed that under each nanosecond laser pulse, the film can melt and undergo morphological changes prior to solidification. It was also verified that solid-state deformation mechanisms such as surface or volume diffusion has no appreciable effect on the film morphology.Reference Favazza, Kalyanaraman and Sureshkumar41 Hence, film morphology evolved in a step by step fashion under a series of pulses with the deformation occurring entirely in the liquid phase. These results clearly suggested that control in terms of “quenching-in” a desired nanoscale structure with characteristic morphology and/or length scale is possible, thus enabling a practical cost-effective nanomanufacturing process. In the subsequent sections we detail some of the experimental aspects of this work, including the patterning length scale and morphology as a function of film thickness.
A. Dewetting of Ag films on SiO2
The key test to confirm the spinodal nature of dewetting is the λ ∝ h 2 relation between the experimentally observed length scale and film thickness. This is because the dewetting morphology can progress via three pathways.Reference de Gennes, Brochard-Wyart and Quere61 (i) In homogeneous nucleation and growth, holes appear spontaneously at random locations and times on the surface. Because of the inherent randomness, no characteristic length scale is expected to be present in this type of dewetting.Reference Stange and Evans34 (ii) In heterogeneous nucleation and growth, which is primarily attributable to defects, impurities, or other experimentally imposed heterogeneities, a characteristic length scale could appear at the early stages of dewetting due to well-defined nucleation sites. For instance, in ion-irradiation induced dewetting, the average molten zone of an ion imposes a characteristic length scale in dewetting.Reference Hu, Cahill and Averback43 However, this length scale need not be dependent on film thickness. (iii) In the spinodal dewetting instability, the resulting patterns are characterized by a well-defined length scale in the hole spacing and/or size of λ ∝ h 2.Reference Reiter67 Therefore, measurement of the length scales versus film thickness during the morphological evolution is one way to confirm the spinodal instability. Here we present results for Ag films on SiO2 substrates.Reference Trice, Favazza, Thomas, Garcia, Kalyanaraman and Sureshkumar50
Silver films with thickness from ∼2 to 20 nm were deposited in high vacuum (∼1 × 10⁻⁸ Torr) at a rate of ∼0.3 nm/min by pulsed laser deposition at room temperature onto commercially obtained, optical quality, SiO2/Si wafers consisting of a 400-nm thickness thermally grown oxide layer on polished Si(100) wafers.Reference Favazza, Trice, Krishna, Kalyanaraman and Sureshkumar48 For every film thickness, the surface roughness was measured via atomic force microscopy (AFM), and an upper limit of 0.5 ± 0.2 nm was established for the average root mean square (rms) roughness over the entire thickness range. As we discuss shortly, roughness can be used as a tuning parameter for the dewetting length scales. Following the deposition, the films were irradiated in a vacuum by a varying number of pulses n from a 266-nm ultraviolet laser having a pulse length τp of 9 ns. Irradiation was at normal incidence by an unfocused laser beam with an area of 1 × 1 mm2 at a repetition rate of 50 Hz. Under these vacuum deposition and irradiation conditions, the film surface was never exposed to air and hence no role of oxygen or an oxide layer was expected. The dewetting morphology was investigated as a function of film thickness h and the number of pulses n, which typically ranged between 10 and 10,500 pulses, for irradiation at laser energies at or just above the melt threshold of the films. It was shown earlier that the melt threshold energy is a function of h.Reference Trice, Thomas, Favazza, Sureshkumar and Kalyanaraman66 For each thickness the melt threshold was determined by a visible roughening of the metal film surface, as detected under high-resolution SEM within the longest time scale of the experiment (i.e., after 10,500 laser pulses).Reference Favazza, Trice, Gangopadhyay, Garcia, Sureshkumar and Kalyanaraman47 The range of E used for the thickness regime investigated here was 60 ≤ E ≤ 120 mJ/cm2. For this irradiation condition, the heating and cooling rate of the metal film was on the order of 1010 K/s with a total heating plus cooling time per pulse of ∼100 ns, which was much smaller than the spacing between pulses of 20 ms. Consequently, as was quantitatively shown earlier,Reference Favazza, Kalyanaraman and Sureshkumar41 negligible contribution to the morphology evolution was expected from processes in the solid state. Hence, any morphology changes occurred primarily during the liquid phase following each pulse. Energy dispersive spectrometres measurements confirmed that the laser irradiation did not result in substantial evaporation of the Ag, even after the longest irradiation experiments of 10,500 pulses.
1. Length scale versus film thickness
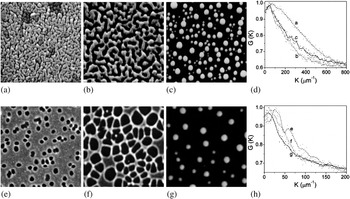
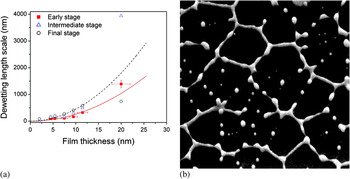
The characteristic length scale associated with spinodal dewetting is established at the very early stages of film deformation.Reference Herminghaus, Jacobs, Mecke, Bischof, Fery, Ibn-Elhaj and Schlagowski45 The early stage undulations, which occur prior to the appearance of large height variations in the film, are extremely difficult to capture experimentally. However, the subsequent morphology, which is a result of ripening of the initial undulations, forms as dewetting progresses and has length scales directly related to the initial length scale. Therefore, as shown by many authors, the final nanoparticle length scale can be used as a measure of the thickness-dependent behavior.Reference Favazza, Kalyanaraman and Sureshkumar28, Reference Reiter32 Here, the length scales were measured at different stages of the dewetting process as a function of film thickness. Figures. 2(a–c) show SEM images of the progression of the morphology for the 4.5-nm film, where as Figs. 2(e–g) show the same for the 11.5-nm film as a function 10,100, and 10,500 laser pulses. Figures 2 (d) and (h) are the radial distribution functions (RDFs) for each stage for the 4.5-and 11.5-nm films, respectively. The important information from this series of images is that the morphology evolution for this film (and all films between 2 and 9.5 nm in thickness) is represented by asymmetric undulations or a bicontinuous type structure, as seen in Figs. 2(a–c). However, for the 11.5-nm film (and all studied films from 11.5-to 20-nm thickness), regular holes are clearly visible, as seen in Figs. 2(e–g). From the position of the peaks in such RDF measurements, it was possible to generate the characteristic length scale present in the pattern at each stage. The result of measuring the length scales from these progressions is provided in Fig. 3(a). The early stage behavior (10 pulses) is shown by the solid squares, the intermediate stage (100 pulses) is shown by open triangles, and the final nanoparticle state is shown by open circles. One important observation from this measurement is that no dramatic change in length scale is seen when the morphology changes from the bicontinuous to the hole structures, i.e., between 9 and 11 nm. This strengthens the argument that both morphologies can arise for spinodal dewetting of Ag. Because the characteristic length scale for spinodal dewetting is known to vary as λsp∝h 2, the trend line of h 2 was plotted for the early stage (solid line) and nanoparticle stage (dotted line) data sets. The early stage dewetting agrees reasonably well with the spinodal trend over the regime investigated, confirming a previously reported result for Ag, based on the behavior of the nanoparticle state.Reference Krishna, Shirato, Favazza and Kalyanaraman62 An important observation can be made on the apparent deviation of the intermediate and final stage length scales for the thickest film investigated, i.e., the 20-nm film. The nanoparticle length appears to be much smaller than the trend (dotted line), whereas the intermediate state appears to be much larger. This can be understood as the drop in the nanoparticle length scale is due to the nearest neighbor interparticle spacing being dominated by a Rayleigh-like break-up of the arms of the polygon, as shown in Fig. 3(b).Reference Reiter67 In contrast, particles in the 11.5-nm film form at the vertex of the polygons formed during the dewetting stage [Figs. 2 (g)]. A similar argument, based on a change in the feature shape being measured, is likely to explain the intermediate state behavior. As shown in Figs. 2(e–g), the progression of the hole morphology is through merging of the holes into polygons, whose size (diameter) will be dependent upon the number of holes from which it was formed. It is quite likely that the large increase in length scale for the intermediate state of the 20-nm film is because the measured length scale is for polygons formed from numerous holes.
(a–c) SEM images (1.5 × 1.5 μm2) of the progression of dewetting in a 4.5-nm thickness Ag film with an increasing number of laser pulses (10, 100, 10,500). (d) Plot of the RDF for each stage of dewetting. The peak position in the RDF was used to estimate the characteristic length scales. (e–g) Progression (3 × 3 μm2) of dewetting in a 11.5-nm thickness Ag film with an increasing number of laser pulses (10, 100, 10,500). (h) plot of the RDF for each stage. The letters in plots (d) and (h) indicate the RDFs for the corresponding SEM images (from Ref. Reference Krishna, Sachan, Strader, Favazza, Khenner and Kalyanaraman56).

(a) Plot of the characteristic length scale for various stages of progression as a function of the film thickness (h). The early stage behavior is shown by the solid squares, the intermediate stage is shown by open triangles, and the final nanoparticle state is shown by open circles. Trend lines with h 2 variation for the early stage and (- - -) nanoparticle stage data are also shown. For clarity, the error bars for the intermediate and final state are not shown. (b) SEM image (15 × 15 μm2) of the intermediate stage to nanoparticle stage transition for a 20-nm film showing that the break-up of arms of the polygons is via a Rayleigh-type process, leading to multiple nanoparticles in each arm (from Ref. Reference Krishna, Sachan, Strader, Favazza, Khenner and Kalyanaraman56).

2. Morphology versus film thickness
These results provide a strong case for Ag dewetting via the spinodal process. However, one of the puzzling aspects is the distinct change in dewetting morphology at a characteristic film thickness. This behavior has been observed previously for polymer dewetting where, below a transition thickness h T, the intermediate stage dewetting morphology consists of bicontinuous structures, whereas above it consists of regularly sized holes.Reference Xie, Karim, Douglas, Han and Weiss68, Reference Seemann, Herminghaus and Jacobs69 This change in morphology has been attributed to the form of the intermolecular forces influencing dewetting.Reference Sharma and Khanna36 Specifically, for ultrathin films, with thickness between 1 and 20 nm, the film thickness-dependent intermolecular forces are made up of a long-range attractive component and a shorter-range repulsive component. The transition thickness can be identified from the thermodynamic free energy of the system and, as shown by Sharma and Khanna,Reference Sharma and Khanna36 is located at the minimum in the curvature of the free energy. Consequently, the appearance of bicontinuous structures is correlated with films whose initial thicknesses lie to the left of the curvature minimum, whereas the formation of holes occurs in films with thicknesses to the right of the minimum. In polymers the magnitude of h T is found to be on the order of a few nanometers. More importantly, knowledge of this transition can help guide the controlled fabrication of materials with different morphologies and length scales. We analyzed the behavior of Ag on SiO2 by evaluating the details of the intermolecular interactions.
The intermolecular interaction free energy of a uniform thin film can be realized by first describing the disjoining pressure acting on a film. Consider a liquid film of height h on top of a flat substrate. The thickness dependent disjoining pressure, Π(h), can be expressed by adding a long-range attractive (van der Waals interaction) and a short-range repulsive interaction between the various interfaces formed as a result of having the film on a substrate. The repulsive term typically consists of two parts: (i) a Lennard–Jones type repulsion,Reference Mitlin70 which appears because of the electron cloud interaction, and (ii) an electrostatic force, which is a result of electric layers forming at the liquid–substrate interface.
The total disjoining pressure, by considering a long-range attraction, a short-range repulsion expressed as a Lennard–Jones type form,Reference Mitlin70 and the electrostatic forces,Reference Sharma and Khanna36, Reference Mitlin70 is given by

Here A is the Hamaker coefficient, which has a negative value in Joules; h c is the critical length at minimum Π(h); Sp is the spreading coefficient, which is related to the magnitude of electrostatic part of the disjoining pressure; and l is a correlation (or Debye) length. Using Eq. (14), the free energy density (energy/area) of a uniform film can be written as

where h c is defined as

and h T (the transition thickness) is calculated from the minima in free energy curvature, which is given as

Figure. 1 shows the free energy change and free energy curvature for Ag on SiO2. A minimum in the free energy curvature occurs at 11.45 nm for a correlation length l value corresponding to 1 nm.Reference Sharma57 This suggests that in Ag the transition thickness h T ≤ 11.45 nm, which is consistent with the experimental results. Similar behavior has also been found for Co and other films. Therefore, one can conclude that the morphology of dewetting can also be predicted by evaluating the form of the interaction potential.
B. Dewetting of Co on SiO2: Role of film roughness on dewetting
It is relatively straightforward to control the mean film thickness, but it is more difficult to systematically control the film roughness, which is strongly dependent on various experimental parameters, including substrate roughness, deposition rate, and surface temperature. For this reason, it is important to explore the behavior of the dewetting instability as a function of film roughness. Thus, we discuss the role of surface roughness based on the pulsed laser induced dewetting behavior of Co films on SiO2 substrates. The key result is that the rms surface roughness (R rms) of the film can be used as an experimental parameter to tune nanoparticle characteristics, including size and interparticle spacing.
Cobalt films of thicknesses ranging from 5 < h < 10 nm were deposited onto optically smooth SiO2/Si substrates under high vacuum conditions. The thermally grown oxide layer of 400-nm thickness had a rms roughness value of R rms < 0.2 nm. The surface roughness of the Co films was created by electron beam evaporation in the following two-step process. An initial Co layer of thickness varying from ~1 to 3 nm was deposited at an elevated temperature of 565 K, which is known to lead to films with larger roughness.Reference Maissel and Glang71 After the high temperature deposition, the film was then allowed to cool to room temperature following which a second layer of Co with thickness varying from ~4 to 7 nm was deposited. The deposition rate for both cases was ~1.2 nm/min, and the deposition time was used to control the film thickness. With this approach, films with various combinations of average thickness, h av, between 5 < h av < 10 nm, and fractional rms roughness, F rms =R rms/h av×100, between ~3 and 28%, were achieved. Two sets of samples were investigated for their dewetting characteristics. In one set, the F rms was a fixed fraction (21.5%) for films between 5 < h av < 10 nm. In the second set, for a fixed film thickness of h av = 7.3 ± 0.4 nm, the F rms was varied between 2.9 < F rms < 28.2%, where the lower number corresponded to the value for the smoothest film, which was achieved by room temperature deposition. Once both layers of Co were deposited, the resulting film was irradiated by a nanosecond pulsed ultraviolet laser beam with a spatially uniform intensity profile. The laser source was an Nd:YAG laser with output at its fourth harmonic at 266-nm wavelength, a 9-ns pulse width, and a 50-Hz repetition rate. The films were irradiated for 2 min (6000 pulses) at normal incidence with laser fluencies that exceeded the minimum laser fluency required to melt the film, but sufficiently low to maintain material conservation and prevent significant evaporation.Reference Favazza, Trice, Gangopadhyay, Garcia, Sureshkumar and Kalyanaraman47 This time was sufficient to create the final dewetting state of nanoparticles, which were then characterized via SEM. AFM measurements of the unirradiated region of the film were used to measure the rms roughness. The samples were also investigated by energy dispersive spectrometres to verify the thickness of the deposited film as well as to confirm that the irradiated regions did not lose substantial material.Reference Favazza, Trice, Gangopadhyay, Garcia, Sureshkumar and Kalyanaraman47
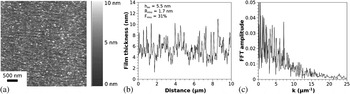
Films created through the two-step process were much rougher than similar films deposited entirely at room temperature. The AFM image of the surface of a rough Co film (average height-5.5 nm) is shown in Fig. 4(a). Figure. 4(b) is a line scan from the AFM image depicting the surface roughness. From this, and similar line scans taken from up to four different regions of the surface, the averaged rms roughness was calculated to be 1.7 ± 0.3 nm, from which F rms was calculated to be 31% for this film. Figure 4(c) shows the fast Fourier transform (FFT) of the surface line scan shown in Fig. 4(b). The important feature to note from this FFT is the absence of any characteristic length scale in the surface roughness. This implied that there was no inherent spatial order or dominant wave length present on the surface of the film prior to the laser irradiation.
(a) AFM image of 5.5-nm Co film with surface roughness R rms = 1.7nm, which corresponds to a fractional roughness of F rms = 31%. (b) Line scan from the AFM image showing the surface roughness profile. This and similar line scans were used to calculate the roughness. (c) FFT of the line scan in image (b) confirmed that the film surface did not have a dominant roughness length scale.

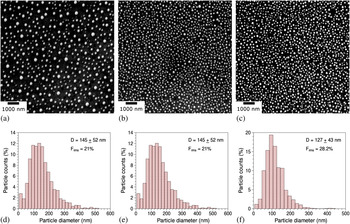
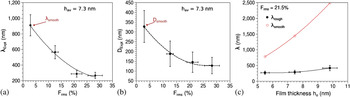
Figures 5 (a–c) show SEM images of the final nanoparticle array for the films with average thickness of 7.3 nm. As is evident from the images, which are on the same scale, the nanoparticles in Fig. 5(c), which correspond to Frms of 28%, are more closely spaced than in Fig. 5(a), which correspond to the film with Frms of 12.6%. One previously observed spinodal dewetting characteristic of nanoparticle arrays is the presence of short-range order (SRO) in the interparticle spacing.Reference Favazza, Trice, Gangopadhyay, Garcia, Sureshkumar and Kalyanaraman47 The characteristic length scale λrough that defined the SRO for the rough films was measured from the RDFs. This λrough is shown in Fig. 6(a) as a function of increasing F rms for the 7.3-nm Co film. A clear systematic decrease in the interparticle spacing with increasing roughness can be seen. As mentioned in Sec. III. A, it is generally accepted that the spontaneous dewetting by self-organization leads to characteristic nearest neighbor interparticle spacing. In contrast, random nucleation, such as via homogeneous nucleation, will not lead to a characteristic spacing because of the random location of nucleation sites. In this roughness dependent study, we observed a characteristic length scale for the particles and hence attribute this to dewetting instability rather then a nucleation process. The magnitude of the length scale decrease is large, as judged by comparing it to the spacing obtained for a smooth Co film, λsmooth, which corresponds to the data point at ~3% F rms. The reduction in length scale for this film height was approximately 3.5 times the smooth case. Figures. 5(d–f) show histograms of the nanoparticle size distribution calculated from the SEM images Figs. 5(a–c). The monodisperse characteristic is evident. The average nanoparticle diameter estimated from these histograms is plotted in Fig. 6(b) as a function of F rms. As in the case of the length scale behavior, a monotonous decrease in the particle diameter with increasing roughness can be seen. The comparison to the diameter obtained for a smooth Co film, D smooth, which is marked on the figure, implied a reduction in diameter of up to 2.6 for the maximum F rms investigated here. Figure. 6(c) plots the SRO length scale variation with the average film thickness for a fixed F rms of 21.5% (shown by solid symbols), as well as is the SRO length scale for films of comparable average thickness but having a smooth surface (i.e. F rms < 3%), as measured by us previously.Reference Favazza, Trice, Krishna, Kalyanaraman and Sureshkumar48 A substantial drop in length scale is observed over the entire thickness investigated suggesting that roughness influences dewetting over a large range of film thicknesses.
(a–c) SEM micrographs showing the final, stable array of Co nanoparticles created from a 7.3-nm Co film with increasing F rms (from left to right = 12.6, 21, and 28.2%). (d–f) Histogram of nanoparticle size corresponding to each of the roughnesses, depicting a monodisperse size distribution with decreasing average size for increasing roughness.

(a) Plot of the nearest neighbor interparticle spacing for a 7.3-nm thickness Co film as a function of increasing fractional roughness. The data point labeled as λsmooth corresponds to the spinodal dewetting spacing observed for the smoothest film. The dashed line is a guide to the eye. (b) Plot of the average nanoparticle diameter for a 7.3-nm thickness Co film as a function of increasing fractional roughness. The data point labeled as D smooth corresponds to the spinodal dewetting diameter observed for the smoothest film. The dashed line is a guide to the eye. (c) Plot of the nearest neighbor nanoparticle spacing for Co films with fixed fractional roughness of 21.5% as a function of increasing thickness (solid symbols) compared to the spinodal dewetting spacing for smooth Co films (open circles). The solid line is a fit to the smooth data and is of type  . The dashed line for the rough data is a guide to the eye (from Ref. 72).

Although the role of roughness on dewetting is not completely clear, the results presented here provide a very important clue toward a future theoretical understanding. First, it is generally accepted that confirmation of spinodal dewetting requires either the exact details of the dewetting morphology,Reference Seemann, Herminghaus and Jacobs69 or the establishing of a final nanoparticulate array with SRO.Reference Reiter32 Here we have primarily resorted to the latter evidence. Second, the existing and successful theory of spinodal dewetting, as proposed by Vrij,Reference Vrij30 is based on the idea that the characteristic length scales are selected from those that reduce the thermodynamic free energy of the initially unstable energy state of the film.Reference Vrij and Overbeek31 In other words, the initial state of the film is smooth, and its free energy change is evaluated for surface perturbations with small amplitude but long wave length (much greater than the film thickness), from which a lower limit for the characteristic length scale is established, as confirmed by earlier work.Reference Trice, Favazza, Thomas, Garcia, Kalyanaraman and Sureshkumar50, Reference Krishna, Shirato, Favazza and Kalyanaraman62 In the observations presented here, the initial state of the film cannot be considered as smooth because the surface roughness has large amplitudes, but with no definite length scale. Therefore, it is possible that the role of the roughness could likely be understood by evaluating how long wave length surface perturbations superimposed on shorter but large amplitude surface fluctuations can influence thermodynamic free energy changes.
C. Novel self-organization in metal films due to nanosecond pulsed laser irradiation
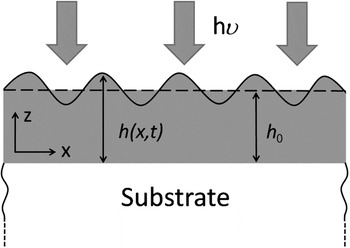
Typically, pulsed laser dewetting of ultrathin metal films (h < 9 nm) on SiO2 substrate can be spinodally dewetted by utilizing laser irradiation to form nanoparticle arrays with spatial order. However, when the range of film thicknesses investigated is broadened, for example, between 1 and 25 nm,Reference Trice, Favazza, Thomas, Garcia, Kalyanaraman and Sureshkumar50 the dewetting of metallic liquid films under nanosecond laser melting show classical spinodal behavior as well as novel dewetting behavior in which the length scale and its trend with film thickness is substantially modified because of the nanosecond laser heating. This latter result is primarily a consequence of nanoscale effects resulting from the laser–film optical interactions and resulting thermal behavior. Essentially, a transient intrinsic thermal gradient develops along the liquid surface due the strong thickness-dependent nanosecond laser heating of such nanoscopic metal film.Reference Trice, Favazza, Thomas, Garcia, Kalyanaraman and Sureshkumar50, Reference Trice, Thomas, Favazza, Sureshkumar and Kalyanaraman66 This thickness dependence arises from three effects (Fig. 7). First, the skin depth of 266-nm wave length ultraviolet light in metals typically ranges from 3 to 12 nm, which is the typical range of film thickness investigated. Consequently, the intensity of light absorbed will be a function of the film of thickness h0 and can be expressed as  where I 0 is the incident light intensity and ∝(λ) is the wave length dependent absorption coefficient in the metal film. Second, the effective reflectivity of light from the surface of the metal film on the SiO2 substrate is also strongly thickness dependent. This can be understood physically by noting that at zero film thickness the reflectivity will be that of the SiO2 substrate (which is practically zero for ultraviolet light) while it will be the value of the bulk metal (which is much greater than zero) for a very thick film. From quantitative calculations based on evaluating the Fresnel coefficients for such metal/ SiO2 bilayer systems, the general nature of the thickness-dependent reflectivity for metals can be found as R(h 0) = r 0(1−exp(−arh 0)), where ar and r 0 are materials-dependent parameters.Reference Yaws73 Third, the effective mass of the material heated M(h 0) is also a strong function of film thickness for the following reason. Because of the large thermal conductivity of metals, any heat generated within the nanoscopic metal film due to optical absorption will diffuse into the underlying SiO2 substrate. Consequently, the effective mass of material heated will include the thermal mass of the film and an effective thermal mass of the substrate estimated from the length scale of thermal diffusion occurring within the substrate in the nanosecond time scales of the experiment. Therefore, the heated mass will be
 , where the subscript m and s denote metal and substrate and ρ and Cp are respective values of density and specific heat,
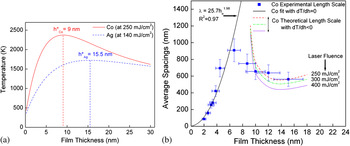
 is the substrate thermal diffusivity, and τ is the nanosecond time scale of laser heating. Consequently, energy balance shows that the temperature rise will be qualitatively given by ΔT (h 0) = I(h 0) (1−R(h 0))τ/M(h 0). As can be noted, in this function, I increases with increasing thickness while (1 - R) and 1/M decrease with increasing thickness. As a result, a nonmonotonic variation in temperature with film height h 0 can be expected for any given laser intensity and at a critical film thickness h* the temperature rise will actually be a maximum. Further, the position of this h* will depend strongly on the laser energy density, which controls the rate at which the film gets heated and hence effects the time scale τ. We have estimated the T versus h 0 behavior using a previously developed heating model based on one-dimensional heat transport into the substrate, i.e., a localized heat, absorption and heat transfer.Reference Trice, Thomas, Favazza, Sureshkumar and Kalyanaraman66 In this model the film temperature is uniform in a direction perpendicular to the film thickness, and the model has accurately predicted the thickness-dependent laser energy density required to melt the films.Reference Trice, Thomas, Favazza, Sureshkumar and Kalyanaraman66 In Figure 8(a) provides representative T versus h 0 plots for Ag and Co films evaluated from this model for laser energy densities of 140 and 250 mJ/cm2, respectively. As is evident, a nonmonotonic behavior with a critical h* is present for both films. Based on this behavior, transient temperature differences can exist along the plane of the liquid film, thus leading to intrinsic thermocapillary forces that could contribute to the patterning process.Reference Trice, Favazza, Thomas, Garcia, Kalyanaraman and Sureshkumar50 This gradient can be understood as follows: within a single laser pulse the film melts at some fraction of the pulse time and therefore the liquid continues to interact with the pulse. Subsequently, height fluctuations of the liquid surface due to capillary waves interact with the laser light to produce local thickness-dependent temperatures, hence the temperature gradients along the liquid film surface. It is this gradient that subsequently influences dewetting, as we show next using the ER model.
Schematic illustrating laser heating of ultrathin liquid films. A liquid metal film of initial height h 0 undergoes surface height fluctuations due to capillary waves. This nonuniform height couples to the incident laser light and results in a local height-dependent temperature (from Ref. 62).

(a) Film temperature, calculated using a local heating model, for Ag and Co metal films on SiO2 as a function of thickness h 0 following heating by a 9-ns ultraviolet laser of 266-nm wave length of energy density 140 and 250 mJ/cm 2, respectively. A nonmonotonic change in T with h 0 is evident as is the critical thickness h* at which the sign of the gradient Th changes. Consequently, this T versus h 0 behavior results in a positive surface temperature gradient T h for the perturbed film (shown in Fig. 7), whose initial thickness h 0 > h* and negative gradients for perturbed films whose h 0 > h*. This intrinsic thermal gradient can substantially modify the length scale of dewetting from its classical values. 50 (b) Experimental length scales (solid squares), best fit without thermal gradients (solid line), and trends for dewetting with Th < 0 (dashed/dotted lines) for dewetting of Co on SiO2. Co dewetting for 2 ≤ h 0 ≤ 7 follows the classical behavior, but it is strongly modified by intrinsic thermal gradients, leading to a substantial decrease in length scale over the classical values for 9 ≤ h 0 ≤ 15 nm. The theoretical trends from the energy transfer model estimated for various laser energy densities (dashed color online dotted lines) captures the experimental observations reasonably well (from Ref. 62).

1. Dewetting with thickness-dependent surface temperature
Here we provide the ER approach to understand the role of the in-plane surface thermal gradient generated by the laser heating process. The temperature gradient along the plane of the film, dT/dx, generated by the nanoscale heating effect, can have a positive or negative sign, depending on the initial film thickness h 0 [Fig. 8 (a)]. With this the boundary condition describing the h -dependent Marangoni effect can be rewritten in the form of a thermocapillary effect as follows:

where γT = dγ/dT is the temperature coefficient of surface tension, Th = dT/dh is the film height-dependent temperature, and h′ = dh/dx. Given that all metals have a negative value of γT , we have expressed the boundary condition in a more conventional form using γT = | −γT | . We can evaluate the length scale using the ER approach based on evaluating the viscous dissipation per unit area  which is

where TC is thermocapillary.
Applying the procedure of volume conservationReference Krishna, Shirato, Favazza and Kalyanaraman62 presented earlier, we get

The pressure gradient along the x direction can now be obtained by integrating Eq. (20) as follows:

Then, on substituting the above relation for the pressure gradient into Eq. 19, we get the total viscous dissipation:

Finally, equating Eq. (22) with the rate of decrease of free energy, Eq. (6), and rearranging the equation in terms of σ, we get an analytical dispersion expression for thermocapillary dewetting as

The solution to this quadratic equation in σ can be shown to be Reference Krishna, Shirato, Favazza and Kalyanaraman62

A comparison of this length scale with the classical value represented by Eq. (13) shows that intrinsic thermal gradients will modify the characteristic length scale. Moreover, the length scale could decrease or increase, depending on the magnitude and sign of the gradient Th . From Fig. 8 (a) it is clear that for liquid films whose starting thickness h 0 > h*, the surface temperature gradient between two points on the perturbed surface will have Th > 0. Conversely, for films where h 0 > h*, the sign of the surface temperature gradient will be negative, i.e., Th < 0. In this context, when Th < 0 (noting that A < 0 and γT < 0 is generally true for all materials and the metals evaluated here) the characteristic length scale should decrease in comparison to the classical value. By contrast, for Th > 0, the length scale should increase compared to its classical value.
2. Novel dewetting in Co
Figure 8 (b) shows the experimentally observed dewetting length scale behavior for Co on SiO2. For films up to ~7 nm, the experiment is consistent with classical spinodal behavior, above that, a dramatic difference in length scale and trend from the h 2 behavior is evident. To understand this the time scale of thermal diffusion must be compared to a relevant experimental time scale, which is the time to melt, because it is at this point that the thermal gradient on the liquid surface will contribute to the patterning process. From experimental observations and thermal modeling,Reference Trice, Thomas, Favazza, Sureshkumar and Kalyanaraman66 this time to melt is determined by the laser energy density and typically varies between 1 ns and ~t p/2, where t p is the Gaussian laser pulse width of 9 ns. Based on this the relevant thermal smoothing length scale  for times between 1 and 4.5 ns lies between 328 and 697 nm for a known Co thermal diffusivity of
 m2/s. Therefore, from Fig. 8 (b), strong thermal gradient effects on dewetting for films having thicknesses from 2 to ~7 nm will be unlikely. As seen by the best fit (solid line) of the experimental data ranging from 2 to 7 nm, the observed behavior follows the classical trend. For the best fit, a value of γ co = 1.88 J − m−2 was used and it results in a value of 1.98 for the exponent of h 0 and a Hamaker coefficient value of A = −1.4 × 10⁻¹⁸ J. Conversely, for films with h 0 > 7 nm, the intrinsic thermal gradients should play some role on the dewetting length scale as
 . As seen in Fig. 8 (b), the experimental data deviate substantially from the classical trend for films with ho > 7 nm. The length scale actually decreases with increasing h0 in striking contrast to the classical behavior. To quantitatively evaluate the experimental results, the sign and magnitude of Th for films in this thickness regime from curves, such as shown in Fig. 8 (a), were estimated. The sign and magnitude of Th for various values of the laser energy density ranging from 250 to 400 mJ/cm2 was calculated. For these energies, the various thicknesses reach their melting point in time scales ranging from 4.5 to ∼1 ns. From this calculation it was determined that the magnitude of the thermal gradient Th ranged between 109 ≤ ThK ≤ 5 × 10¹⁰ K/m and the sign was negative, i.e., Th < 0. Based on this and noting that
 J/m2K,Reference Lu and Jiang74 we utilized Eq. (24) to estimate the characteristic length scales. This theory curve is shown by the dashed/dotted lines in Fig. 8 (b). It is evident that the experimentally observed behavior for the dewetting length scales for h0 > 7 nm can be reasonably well described by invoking the intrinsic thermal gradients resulting from the nanosecond laser heating. It is important that this result suggests that the rich dewetting behavior that is observed experimentally following nanosecond laser melting of thin metal films can also be explained by the principle of equating the rate of free energy change to the minimum rate of viscous energy loss in the system.
IV. SUMMARY
Self-organization via dewetting in ultrathin films has received attention because of its potential application as a nanomanufacturing process and because of the fundamental interplay between energy and dynamics. In a practical sense, dewetting is a simple, low cost, robust, and reliable route to create surface nanostructures. It results in a variety of complex structures with the ability to control size, shape, and spacing. In a scientific sense, the correlation between the temporal behavior of the free energy of the thin film system with energy loss mechanisms during fluid flow (viscous dissipation) is a fundamental principle underlying spontaneous self-organization. The dewetting in thin metal films on inert substrates was observed to follow the spinodal dewetting mechanism and, in certain instances, was modified by intrinsic thermocapillary forces. An ER theory was developed to understand the characteristics of dewetting in single layer metal films. This model is based on the principle of equating the rate of change of free energy to the viscous dissipation during liquid flow. The characteristic length scales of spontaneous dewetting were accurately described by this model. The experimental observations of thickness-dependent dewetting length scales in single layer Ag metal on SiO2 substrate was correctly explained by the ER theory, where the length scale showed a parabolic dependence on the initial film thickness (λ ∝ h 2). Furthermore, investigations showed that the dewetting morphology changed between holes to bicontinuous structures at a critical thickness. The transition thickness of this morphology change can be correlated to the position of the minima in the free energy curvature for the metal films.
The manipulation of spinodal dewetting length scales, outside of its intrinsic dependence on film thicknesses, can also be achieved by controlling the film roughness. The nanoparticle size and interparticle spacing decreased with increasing roughness for a constant average film thickness. Similarly, the size and spacing were substantially lower for films with a constant fractional roughness, in comparison to the smooth films, for average thicknesses ranging from ~5 to 10 nm. These observations suggest that the spinodal dewetting process leading to characteristic nanoscale patterns and length scales may not be fundamentally changed in rough metal films. This is particularly useful because it implies that roughness may be used as an experimental parameter to further control the length scales of dewetting, which is a robust pathway for the nanomanufacturing of metallic nanostructures. A novel nonclassical patterning behavior in the dewetting of ultrathin metal films can be observed under fast thermal processing by a pulsed laser. This nonclassical behavior results in a completely different length scale behavior with film thickness, as compared to that for spinodal dewetting. For Co, the characteristic length scale decreases with increasing thickness for films with thickness h above a critical value. The origin of this behavior is the intrinsic thermal gradient that develops along the film–vacuum interface due to the strong h and t dependence of laser heating of ultrathin films. The ER model was also successful at explaining this novel dewetting behavior, which occurs because of the presence of intrinsic thermocapillary forces generated by the nanosecond laser heating process.
In conclusion, the basic mechanisms of pulsed laser induced dewetting of metal films are well understood and can be applied to cost-effective nanomanufacturing of metallic surfaces for applications in sensing, energy harvesting, and information processing. However, additional significant work must be performed to elucidate many finer details of this process, including the full nonlinear evolution of morphology, the underlying reason for the appearance of specific dewetting morphologies, and the behavior of metals on partially wetting or reactive substrates.
ACKNOWLEDGMENTS
The authors acknowledge support from the National Science Foundation (CAREER Grant DMI- 0449258, Grant NSF-CMMI-0855949, Grant NSF-DMR-0856707) and the Center for Materials Innovation at Washington University. The third author also acknowledges discussions with Dr. Trice, and Dr. Strader and Prof. Garcia, Prof. Sureshkumar, and Prof. Khenner.