1. INTRODUCTION
In areas of design, engineering, science, and innovation, sketching plays an important role in generating, communicating, and evolving ideas (Ullman et al., Reference Ullman, Wood and Craig1990; Goldschmidt, Reference Goldschmidt1991; Schutze et al., Reference Schutze, Sachse and Römer2003; van der Lugt, Reference Van der Lugt2005; Ainsworth et al., Reference Ainsworth, Prain and Tytler2011). In early-stage design, these sketches are often used to assess idea quality, and creativity is often an important consideration. This research attempts to better understand factors affecting the perceived creativity of an idea, building upon a recent study that found the clarity of a concept sketch influences the perceived creativity of the idea the sketch portrays (Kudrowitz & Wallace, Reference Kudrowitz and Wallace2010). Specifically, this paper seeks to answer: how does the sketch quality of early-phase product ideas affect their perceived creativity?
An understanding of how sketch quality affects perceived creativity of an idea may provide insight on how designers, engineers, and innovators can more effectively present their product ideas; this insight may also be applied to other disciplines that involve communication of creative works.
2. BACKGROUND
Idea visualization and sketching are considered to be a vitally important form of communication in the realms of engineering, design, science, and innovation (Ullman et al., Reference Ullman, Wood and Craig1990; Goldschmidt, Reference Goldschmidt1991; Schutze et al., Reference Schutze, Sachse and Römer2003; van der Lugt, Reference Van der Lugt2005; Ainsworth et al., Reference Ainsworth, Prain and Tytler2011). Sketches are made to refine one's thoughts, to share ideas, and to evaluate the merit of concepts. Evaluation is based on a number of attributes, but when dealing with innovation in the form of new products, many researchers agree that creativity is an important criterion (Amabile, Reference Amabile1982; Besemer, Reference Bessemer1998; Christiaans, Reference Christiaans2002; Horn & Salvendy, Reference Horn and Salvendy2009). As industry in the United States is shifting its core competence from analytics to creativity and imagination, some would say that creativity is the most important criterion (Nussbaum et al., Reference Nussbaum, Berner and Brady2005).
Many studies have explored how to generate more creative ideas; some have found that having more ideas is correlated with having more creative ideas (Diehl & Strobe, Reference Diehl and Stroebe1987; Rietzchel et al., Reference Rietzschel, Nijstad and Stroebe2006; Kudrowitz & Wallace, Reference Kudrowitz and Wallace2010). However, in addition to the creative merit of an idea in itself, the presentation of the idea may also affect the perceived creativity.
2.1. Sketching in idea generation
Sketching in design, engineering, science, and innovation often initiates the formation an idea in brainstorming processes. IDEO, a leader in the business of product design consultancy, is known for helping to develop hundreds of cutting-edge products. IDEO describes a successful brainstorming session as one that produces over 100 ideas per hour; virtually every surface of the room should be covered with sketches of ideas (Kelly, Reference Kelly2001). In brainstorming sessions, it is typical and encouraged to have participants from a variety of backgrounds, which include individuals without traditional design training (Kelly, Reference Kelly2001). An initial down selection of the ideas is sometimes made with the participants of the session.
The sketches made in a brainstorm session are generally quick line drawings, meant to convey the idea to other participants in the session. Research suggests that sketching is critical to conceptual design practice (Goldschmidt, Reference Goldschmidt1991, Reference Goldschmidt2006; Lipson & Shpitalni, Reference Lipson and Shpitalni2000; van der Lugt, Reference Van der Lugt2005). As a person sketches, he or she will extract new meaning from his or her sketch in progress, which allows for the concept to evolve in different directions and to be built upon or reinterpreted (Goldschmidt, Reference Goldschmidt1991). Similarly, other research suggests that as one sketches ideas, his or her concepts become more refined and can lead to a variety of novel ideas (Fish & Scrivener, Reference Fish and Scrivener1990). More specifically, Goel describes two ways in which sketches help to advance ideas: lateral transformations, in which ideas transform into new ideas, and vertical transformations, in which ideas become more refined versions of the same idea (Reference Goel1995).
Because sketching is a central tool in early stage ideation, it is valuable to better understand how the quality of the sketch might influence our perception of the merits of an idea.
2.2. Taxonomies of drawings in engineering and design
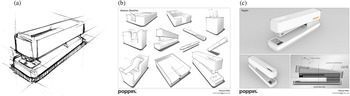
Sketches evolve through three stages: explorative, explanative, and persuasive (Olofsson & Sjolen, Reference Olofsson and Sjolen2005). A similar taxonomy was presented by Ferguson: thinking sketch, talking sketch and prescriptive sketch (1992).
Thinking sketches (or explorative sketches) are a means of personal communication and tend to be the genesis of a product concept. These sketches are used to quickly document an idea either for one's own personal use in a design notebook or during a brainstorming session to communicate a concept. These sketches typically do not have any shading and are constructed using few loosely constructed lines.
Explanative sketches (which are a form of talking sketches) typically portray multiple variations of a concept and may focus on certain details, features or uses. Sketches like these can be shown to a client or collaborators to get feedback before a final concept/embodiment is chosen. A designer could also make or edit these sketches when discussing an idea with a client or collaborator. The concept is still vague at this stage of design, but a certain direction is being explored. These drawings can be more refined than doodles and are much cleaner in line work. Rendering is used sparingly if at all.
Persuasive sketches (which are a form of prescriptive sketches) imply that a concept has been selected and drawings are made to communicate certain elements. This category would include renderings with tone, a variety of views, and a means of depicting scale and interaction. On the engineering side, this could include part drawings, photorealistic CAD models, and drawings for manufacture.
In this taxonomy, it is important to note that the sketch reflects the state of the design (Tovey et al., 2002). In other words, early sketches are unstructured, ambiguous, and vague to allow for creative exploration; as the design process progresses, both the design and the sketches become more detailed and refined.
Notice in Figure 1 that the sketches become more realistic and defined by increasing the amount of rendering and detail. This is the basis of another drawing taxonomy defined by McGown et al. (Reference McGown, Green and Rodgers1998). In this classification, sketches are rated on a complexity scale of level 1 through level 5. Level 1 describes minimal monochromatic line drawings with no rendering or annotation. As the drawing becomes more detailed, rendered, and annotated, the level rating becomes higher.
Explorative Sketch (a), Explanative Sketch (b), and Persuasive Sketch (c) (courtesy of Michael Miller, Industrial Designer). [A color version of this figure can be viewed online at http://journals.cambridge.org/aie]

These existing progressive taxonomies describe the flow of sketches as they become more refined and detailed throughout a design process. In this study we look at a perpendicular axis of quality within a particular fixed level of detail (i.e., how well are the sketches drawn at a given stage in the design process).
In this study we focus on early stage design sketches, specifically those from brainstorming sessions. Depending on the taxonomy, they could be called thinking sketches, exploratory sketches, or low-complexity level sketches.
2.3. Sketching and creative design
There is limited research on the importance of sketching in the early stages of design. The following is a brief summary of studies that have discussed relationships between sketching and creativity.
Some studies have found a positive correlation between the number of sketches made during a design process and quality of the design outcome (Schutze et al., Reference Schutze, Sachse and Römer2003; Song & Agogino, Reference Song and Agogino2004) and one found no significant correlation (Yang & Cham, Reference Yang and Cham2007). Another study found that students using a hybrid (digital/handwritten) design notebook, as opposed to solely digital or solely handwritten, had more sketches and more detailed sketches and also had better design outcomes (Oehlberg et al., Reference Oehlberg, Lau and Agogino2009). The general finding that more sketches lead to better design outcomes is not surprising as sketching is an aid for analysis, short-term memory, communication, and documentation (Schutze et al., Reference Schutze, Sachse and Römer2003).
A few studies have found correlations between sketching ability and artistic creativity suggesting that people who are good at drawing are also creative (Chan & Chan, Reference Chan and Chan2007; Chan & Zhou, Reference Chan and Zhao2010). It has also been posited that drawing training in itself makes people more creative (Chan & Zhao, Reference Chan and Zhao2010). Daniel Pink suggests that the ability to uncover hidden relationships can be further developed by learning how to draw (Pink, Reference Pink2005). Few studies, if any, have explored how the quality or type of sketch influences the perception of the idea.
2.4. Aesthetics and perceived creativity
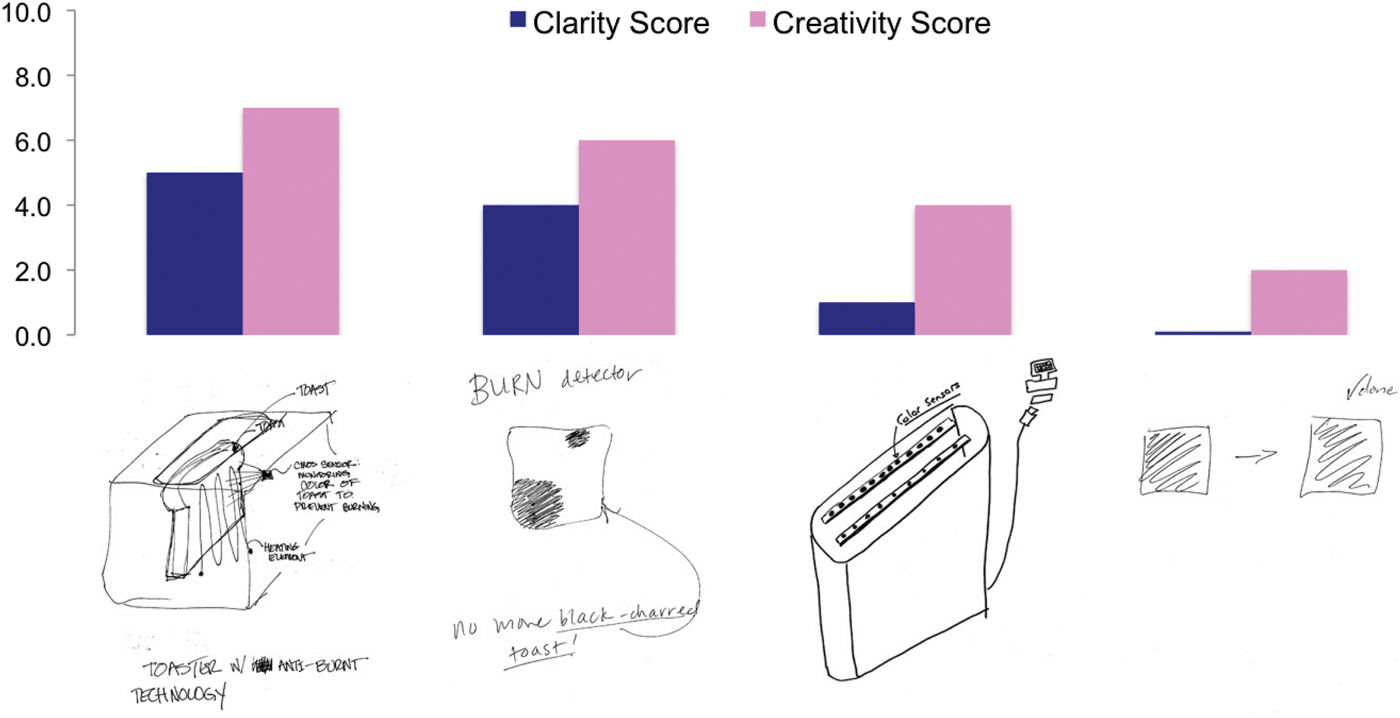
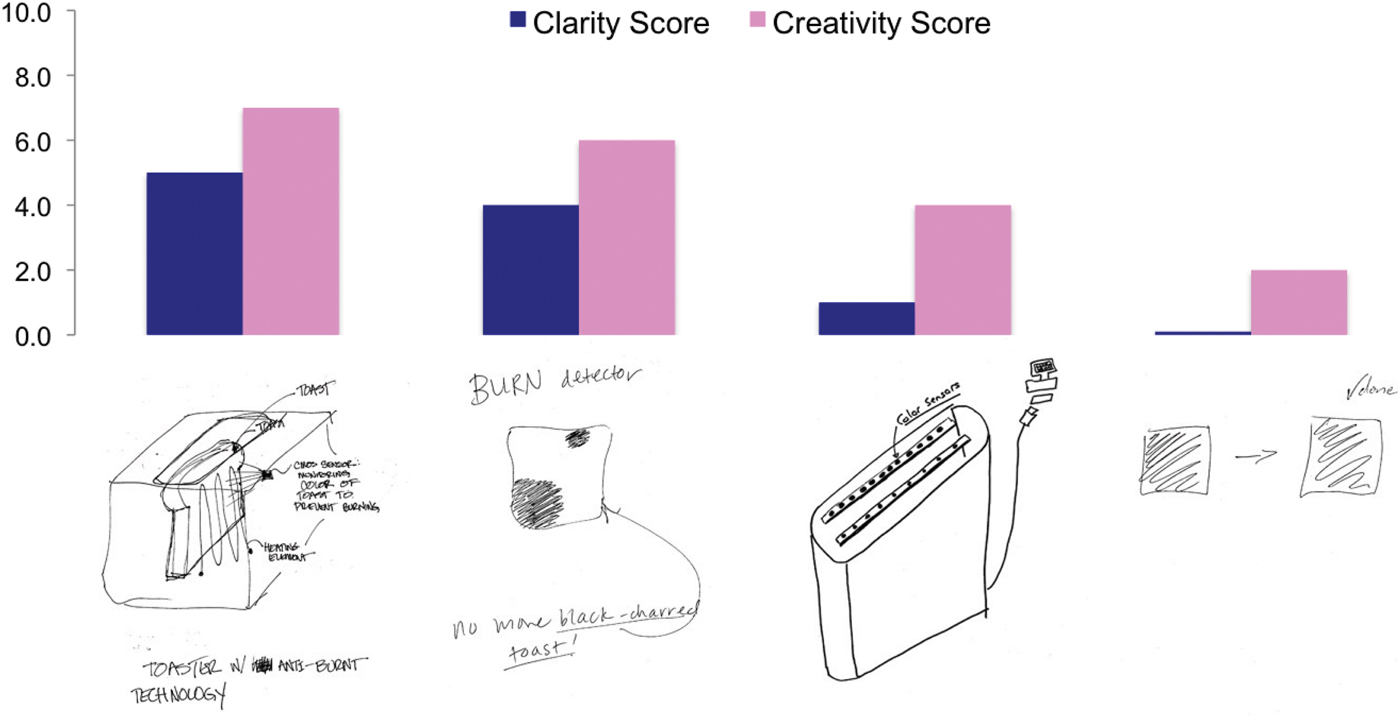
In a prior study evaluating product idea creativity, the clarity rating of a sketch was moderately correlated with the subjective evaluation of an idea's creativity (Kudrowitz & Wallace, Reference Kudrowitz and Wallace2010). In this same study, when comparing different sketches of the same general idea, the sketches that had higher clarity scores also had higher creativity scores. This can be seen in Figure 2, which depicts concept sketches for a toaster that optically detects if the toast is burning. Although all of the sketches represent the same idea, the sketches that had higher clarity scores also had higher creativity scores. In this study, the participants were not specifically asked to draw a certain idea with a certain level of detail; therefore, sketches of the same idea are represented very differently with varied levels of detail.
Creativity and clarity scores for four optical burn detecting toaster sketches (Kudrowitz and Wallace, Reference Kudrowitz and Wallace2010). [A color version of this figure can be viewed online at http://journals.cambridge.org/aie]
A few studies have also considered the effect of aesthetics on the perception of existing products (i.e., artifacts, not sketches). In a study evaluating prototypes of telephone booths and computer cabinets, ratings of attractiveness were highly correlated with ratings of creativity (Christiaans, Reference Christiaans2002). In another study involving the evaluations of existing lamps and chairs online, the category of affect, which included attractiveness, was found to be the strongest indicator of willingness to purchase (Horn & Salvendy, Reference Horn and Salvendy2009). If aesthetics affects the evaluation of the final product or prototype, it is reasonable to assume that aesthetics has an effect on the evaluation of the initial ideas. Based off of these prior works, we hypothesize that ideas sketched with higher quality will be perceived as the more creative ideas.
2.5. Evaluating creativity
This study follows Amabile's consensual definition of creativity, which states that a product idea is creative if a group of independent reviewers subjectively agree it is creative (Reference Amabile1982). If reviewers of ideas are not given a definition for creativity, they then use their own subjective definition to evaluate the ideas. Amabile found that when dealing with common objects such as toasters, anyone may legitimately be considered an appropriate judge of creativity (Reference Amabile1982).
Essentially, laymen are legitimate experts on judging creativity when dealing with general, commonplace products such as toasters. Online reviewers are likely to own toasters, and given their adaption of contemporary Internet services such as the one used in this study, it is probable that these laymen are also adapters (if not simply aware) of contemporary consumer goods. This process, described in Section 3.3, is akin to an online focus group and can reach more people with less effort (Sawhney et al., Reference Sawhney, Verona and Prandelli2005).
2.6. Evaluating quality of sketch
In this study, we describe sketch quality as a combination of mastery in line-work execution, correctness of perspective, and appropriateness or realism of proportions. The level of detail was maintained as a constant in this work, because additional details might imply differing design features for the same concept. In addition, only line drawings are considered. Several authors also provide detailed descriptions of elements that comprise sketch quality (Alvarez, Reference Alvarez2004; Olofsson & Sjolen, Reference Olofsson and Sjolen2005; Eissen & Steur, Reference Eissen and Steur2007).
In this study the majority of the sketches are “complexity level 2,” as defined by McGown et al. (Reference McGown, Green and Rodgers1998). Complexity level 2 indicates that the sketch is a monochrome line drawing with no shading; however, level 2 sketches may include different line densities made by varying pressures of a single medium. Complexity level 2 may also include a few brief annotations and motion arrows.
Line quality, as shown in Figure 3, can be described as a low amount of wiggle or tremor and a low amount of hash marks (short lines used to approximate a shape). These types of lines are perceived as sloppy. Construction lines, however, are helpful as they allow for structuring a drawing.
Examples of line work that are: clean, with tremor, and with hash marks (left to right).

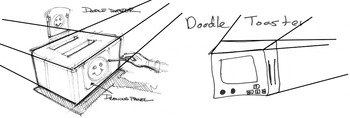
Correctness of two-point perspective, as shown in Figure 4, can be described as the technical execution of perspective: having lines converge to a set of vanishing points, having vertical lines drawn vertically, having circular shapes drawn with correct ellipses, and so forth. A sketch becomes distorted when perspective is poorly executed. Shading and shadows should be placed correctly, if used.
Toaster sketches with correct 2-point perspective and incorrect 2-point perspective. Notice that lines converge in correct 2-point perspective.

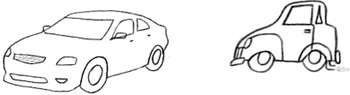
Proportion, as shown in Figure 5, addresses the relative size of different features/dimensions within and object, and between different objects. Good proportions realistically reflect the intended artifacts. Items that have thickness are actually drawn with thickness. If an item is intended to fit into another item, it should appear that it could fit inside. Things that are intended to be symmetric are drawn symmetrically. Rounding corners may make a sketch look more realistic, but overly round corners will make it look unrealistic and cartoonlike. Line quality, perspective, and proportions are all technical skills that are taught in schools of design.
Car sketches with correct proportions and incorrect proportions.

Figure 6 presents six sketches of the same toaster idea drawn with decreasing quality of sketch. This order was independently agreed upon by two product designers with an extensive background in this area.
Horizontal toaster concept sketched with decreasing levels of quality (line work, perspective, proportions).

3. EXPERIMENT
This paper explores the relationship between the quality of a product-idea sketch and how others perceive the creativity of the idea portrayed by the sketch.
Four different product ideas were each drawn by individuals with varying levels of drawing ability: an industrial designer with many years of sketching training and experience, an engineering graduate student with limited sketching experience, an engineering student with no sketching experience, and a group of middle school students with limited to no sketching training. This produced a variety of sketches of the same set of ideas with similar levels of detail, but with varying levels of quality. Twenty-four sets of ideas were arranged so that each set presented the same four ideas, but each idea in the set was drawn with a different level of quality. Three hundred sixty individuals independently evaluated the ideas in these sets on their creativity using an online survey.
3.1. Selecting toaster concepts
Toasters were chosen as the general theme, building upon work by Kudrowitz and Wallace (Reference Kudrowitz and Wallace2010) that also used toasters as a representative consumer product. A group of 10 toaster ideas were chosen from this original study to represent a wide range of creativity. The written descriptions of these 10 toaster ideas can be found in Appendix A.
To clearly represent a range of product-idea creativity, we asked three product designers to independently rank the 10 ideas (based on word descriptions). Out of the 10 concepts, the product designers ranked 5 of them in the same order based on idea creativity. The other 5 ideas were discarded for this experiment.
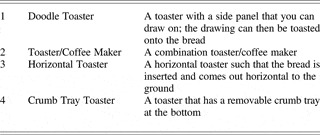
The descriptions of the selected five toaster ideas were then posted online, and 100 laymen evaluated the creativity of the ideas using Amazon Mechanical Turk (this service is described in Section 3.3). For a majority of the 100 laymen, four of the five ideas fell in the same order as the experts'. A fifth idea was perhaps harder to understand in words, so the scores for that particular idea were ambiguous. This fifth idea was discarded. Thus, four toaster ideas with a well-accepted creativity rank order was derived. All three product design experts and the majority of the 100 laymen agreed upon the creativty rank order for the four ideas, as listed in Table 1, in order of most creative to least creative.
The final four toaster ideas used in the sketching experiment

Note: Ideas are listed from 1, most creative, to 4, least creative.
3.2. Creating toaster sketches
Over 20 individuals with varying levels of sketching ability were independently asked to sketch the four toaster ideas based on the written descriptions of the ideas. All sketches were made using the same drawing tools, and all individuals were given the same prompt (as described in Appendix B).
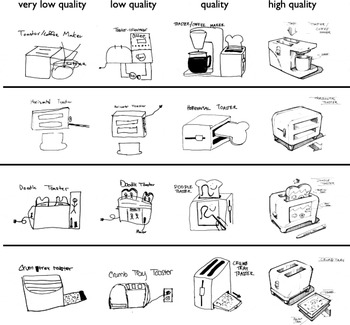
From the sets of sketches produced, two product designers evaluated the sketches on line quality, proportions, and perspective. Sketches were discarded if they included more detail or creative elements than presented in the descriptions. From this, four sets of each idea were chosen to represent a good variety in quality of sketch. The chosen sketches were made by: an industrial designer with many years of sketching training and experience (high quality sketches), an engineering graduate student with limited sketching experience (quality sketches), an engineering student with no sketching experience (very low quality toaster/coffee maker sketch), and a class of middle school students with limited to no sketching training (creating the rest of the low quality/very low quality sketches). The four toaster sketches of different quality for each toaster idea are shown in Figure 7.
Four toaster concepts drawn at four levels of sketch quality.

3.3. Evaluating the creativity of sketched ideas
This study utilized Amazon Mechanical Turk, a web-based service (http://www.mturk.com) that allows any user to post tasks for any other user to complete for a small monetary payment. Users of each survey are unique, as they cannot repeat the experiment. A recent study revealed that Mechanical Turk is a reliable source of experimental data and that the population of Mechanical Turk is at least as representative of the US Population as traditional subject pools (Paolacci et al., Reference Paolacci, Chandler and Ipeirotis2010). Paolacci's recent study portrayed that Mechanical Turk workers were 75% female, had an average age of 34.3, and a median age of 29. Although no demographic information was taken from participants of our surveys, one can assume a similar demographic to the one described in Paollaci's work.
All sketches were digitized, sized to similar scale, and presented in a survey using Amazon Mechanical Turk. The four different ideas were displayed in sketch format, and reviewers were asked to rank the ideas from most creative to least creative.
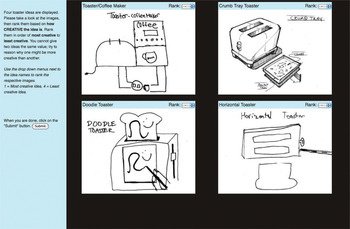
A baseline test that displayed the four ideas with the same sketch quality was first conducted with 200 people and completed in 2 days. In a second test, 24 sets of the sketches were arranged so that each set presented the same four toaster concepts, but different combinations of sketch quality. An example is shown in Figure 8. Online reviewers ranked the creativity of the sketched toaster ideas. Each reviewer received one of the 24 sets at random.
The survey as it appeared to survey-takers on Amazon Mechanical Turk. Details of the prompt are described in Appendix C. [A color version of this figure can be viewed online at http://journals.cambridge.org/aie]

The survey was made with the expectation to again use Amabile's consensual definition of creativity to assess the creativity of the ideas. In this case, reviewers ranked the four ideas based on their subjective assessment of the ideas' creativity. No mention was made to quality or clarity of the sketches, so reviewers were not explicitly asked to take this into account when ranking the ideas.
Each reviewer was paid $0.10 for completing the survey. In total, 360 different reviewers rated each sketch and the survey was completed in 7 days. All reviewers started and completed the exercise in full.
4. RESULTS
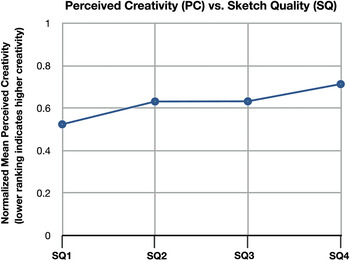
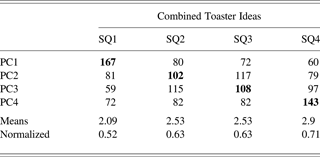
Over all four toaster concepts, the highest quality sketches were more likely to be rated as most creative, with a normalized average creativity rating at 0.52. The lowest quality sketches were more likely to be rated as least creative, with a normalized average creativity rating at 0.71. Note that in this case, a lower numerical score indicates a higher creativity, since participants were informed that “1” was the highest creativity rank, and “4” was the lowest creativity rank. The normalized score, 0–1, is relative to the lowest possible ranking (4).
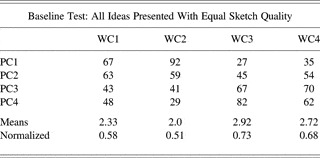
In Figure 9, it can be observed that the creativity rank has a positive correlation with sketch quality. The data are shown in Table 2. The creativity rank was obtained by taking the scores of all the high quality sketches and averaging them together, then all scores of the quality sketches and averaging them together, and so forth. Table 2 also shows that the modes of the scores correspond to the sketch quality: a majority of the participants who saw a high quality sketch rated that idea as most creative, and a majority of the participants who saw a very low quality sketch rated that idea as least creative. Thus, regardless of the idea, it can be seen that sketch quality strongly correlates with perceived creativity compared to the baseline results (p > 0.001). The data of the baseline test are shown in Table 3, and will be discussed later.
The perceived creativity of the ideas is plotted against sketch quality. Lower ranking corresponds to higher creativity. [A color version of this figure can be viewed online at http://journals.cambridge.org/aie]

A consolidation of all toaster ideas
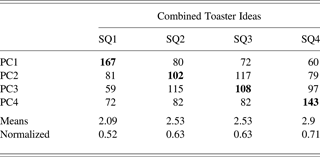
Note: The numbers in the matrix indicate how many people gave a particular creativity rank (PC) to that particular sketch quality (SQ). For example, 167 people ranked the highest quality sketches (SQ1) as the most creative (PC1) ideas. The numbers in “Means” indicate the average score given to that sketch, given perceived creativity scores of 1–4. Note the mode for all of the sketch qualities indicates that there is a positive correlation between sketch quality and perceived creativity. Sketch quality (SQ): SQ1, high quality sketch (industrial designer); SQ2, quality sketch; SQ3, low quality sketch; SQ4, very low quality sketch (no sketching training). Perceived creativity (PC): PC1, ranked 1, most creative; PC2, ranked 2; PC3, ranked 3; PC4, ranked 4, least creative. Written creativity (WC): WC1, doodle toaster; WC2, toaster coffeee maker; WC3, horizontal toaster; WC4, crumb tray toaster.
Baseline test showing data of the number of participants who ranked a particular idea a particular creativity ranking

The high quality sketches were on average 2.3 times more likely to be ranked as the most creative idea when compared to sketch of the same idea drawn with lower quality. Lowest quality sketches were on average 2.4 times more likely to be ranked as the least creative idea when compared to the high quality sketch of the same idea. The sketches that were defined as “quality” and “low quality sketches” were generally ranked second or third more often, which continues to follow the trend of the other sketches.
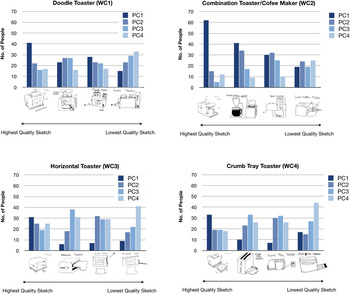
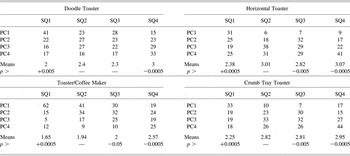
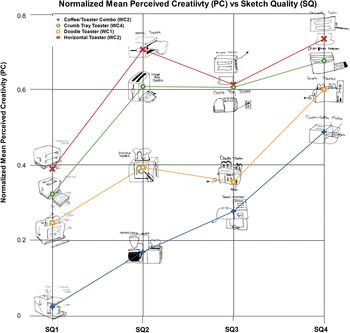
Analyzing the four toaster concepts separately, it was observed that the varying sketch quality affected the perceived creativity for each concept significantly (p > 0.005 for the Doodle Toaster, and p > 0.001 for all other toasters). The high quality sketches made by the industrial designer had a significant positive effect on the perceived creativity of all ideas (p > 0.005 for the Doodle Toaster, and p > 0.0005 for all other ideas). The lowest quality sketches had a significant negative effect on the perceived creativity of the ideas (p > 0.0005 for all ideas). The data from the individual sketches is displayed in Table 4. Figure 10 provides a visual of the data.
Data of separate toaster concepts' perceived creativity against sketch quality. Perceived creativity is judged by the number of people who gave the sketch a particular rank; the data follows the trend that a higher sketch quality positively correlates with higher perceived creativity. [A color version of this figure can be viewed online at http://journals.cambridge.org/aie]

Raw data showing the number of participants ranking the creativity for each of the ideas

Note: Means are the average creativity ranking scores for each sketch quality, and p values indicate the significance of each score. No score indicates the score was not significant, and the sign of the score indicates whether the sketch had a positive or negative effect on perceived creativity.
Figure 11 provides a detailed view of the 12 sketches plotted by the mean scores. Again, the lower left corner of the graph indicates a higher creativity and a higher sketch quality, whereas the upper right corner indicates a lower creativity and a lower sketch quality.
Mapping of each sketch's average creativity against the combined quality sketch's average creativity and fit line. [A color version of this figure can be viewed online at http://journals.cambridge.org/aie]

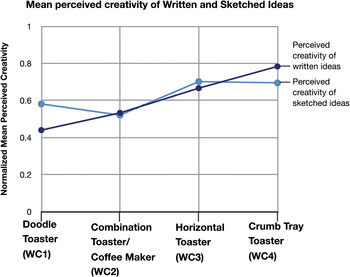
The baseline test also provides significant results when compared against the original ranking of creativity defined using written descriptions of the ideas (Fig. 12). The average creativity of the written ideas was ranked Doodle > Coffee Maker > Horizontal > Crumb Tray. The average creativity of the sketched ideas was ranked Coffee Maker > Doodle > Crumb Tray > Horizontal. This difference is quite significant (p > 0.001).
Creativity of the ideas presented in a sketch vs. creativity of ideas presented in a written description. [A color version of this figure can be viewed online at http://journals.cambridge.org/aie]

5. DISCUSSION
The findings support our hypothesis and add to the prior work (Kudrowitz & Wallace, Reference Kudrowitz and Wallace2010), demonstrating that the presentation of the sketch affects the perceived creativity of the idea. In this prior study, sketches of the same idea were represented very differently, had various levels of detail, and were evaluated based on clarity. With no control of how the ideas are represented, it is difficult to determine what factors are actually influcing the perceived creativity. Our new study focused on quality of sketch (line work, perspective, and proportions) and attempts to control level of detail. This study also compares written versus visual descriptions of the same idea.
As observed, there was a significant impact on perceived creativity when varying sketch quality, regardless of the idea; the highest quality sketches (SQ1) positively impacted the perceived creativity of the idea, and the lowest quality sketches (SQ4) negatively impacted the perceived creativity of the idea. The low quality sketch (SQ3) also negatively impacted the perceived creativity, but to a lesser significance, which is as expected. This suggests that realistic proportions, correct perspective, and line quality are factors that influence the perceived creativity of an idea.
A possible explanation for this finding is that ideas for products presented with high quality sketches may be more grounded in reality, as it is closer to the way we see the physical world around us. As high quality sketches of products need less interpretation to be understood as products, one can then focus on analyzing the creativity of the idea itself, rather than attempting to interpret the sketch in a meaningful way. It also might be easier for the reviewer to imagine what the product would be like to use or exist in their own environment. Another possible explanation is that we simply prefer and value things that are aesthetically pleasing and in this case the quality of the sketch overpowers the quality of the idea.
However, this finding does not suggest that higher quality sketches are always preferred. According to Tovey et al.'s suggestions (2002), sketches that are of high quality as defined in this experiment can limit the exploration and evolution of the idea. More advanced visualizations like computer-aided design (CAD) models may make the idea appear to be farther along the design process than it actually is. Although it may be important for initial sketches to be exploratory and less refined, the idea can benefit from having high line quality, technically correct perspective, and appropriate proportions.
This study underscores the importance of presenting sketches in a similar quality and style in order to compare ideas without biasing results from differing sketch qualities. This especially applies to group idea generation sessions, where multiple people are contributing different ideas and sketches. The creativity of an idea can be considered as an important factor in the success of ideas (Nussbaum et al., Reference Nussbaum, Berner and Brady2005), and thus our results suggest that higher quality sketches will be more likely to be chosen over lower quality sketches. The sketch variability could be a confounding factor and should be explored in further studies. This also applies when asking for people's preferences in market research studies.
This study suggests that the presentation of an idea is important in evaluating its creativity. Ultimately, the effort put into a high-quality sketch may positively effect the evaluation of the idea. Oppositely, creative ideas that have poor line quality, incorrect perspective or unrealistic proportions may be overlooked in favor of those ideas with better sketch quality, regardless of the creative merit of the idea in itself. The visual presentation of an idea can be viewed as a form of storytelling. Design presentations are more successful when using narrative, as opposed to pure exposition (Morton & O'Brien, Reference Morton and O'Brien2005). Storytelling is a means of connecting with and absorbing an audience. Although in this study the level of detail in the drawings was controlled, a well-made drawing can connect with an audience. It is possible that a reviewer is more likely to imagine themselves using the conceptual product when the idea is sketched with more realism and style.
Sketching skills (and stortytelling skills) are not commonly taught to engineering or science students in the United States (Yang & Chan, Reference Yang and Cham2007; Ainsworth et al., Reference Ainsworth, Prain and Tytler2011). Drawing should be recognized alongside writing, reading and talking in science and engineering education (Ainsworth et al., Reference Ainsworth, Prain and Tytler2011). The findings support the inclusion of sketching in curricula not only for designers but also for engineers and innovators so that sketching ability can be elevated to a consistent level and biases caused by differing sketch quality can be reduced. As the capabilities of technology continue to expand, it may be beneficial to explore new ways of integrating technology into concept sketching and idea refinement.
It is also interesting to note the significant change of creativity rank order when comparing the presentation of written ideas against the sketched ideas (p > 0.001). It is hypothesized that the unexpected correlation may have been due to a bias in the order in which the ideas were presented in the survey. The survey always presented the Coffee Maker/Toaster idea at the top left, followed by the Crumb Tray Toaster, the Doodle Toaster, and the Horizontal Toaster. Survey takers may have been biased by seeing the first two ideas at the top of the page, which may account for the ideas being more creative than the bottom two, respectively. Future experiments may be improved by randomizing the order in which the ideas are presented on the screen.
However, it can also be hypothesized that this may not have been caused by any error at all; using sketching instead of writing as a medium to convey an idea may impact the perceived creativity of the idea by itself. For example, it is possible that a Coffee Maker/Toaster seems more creative when comparing a sketch of the concept to other sketches, and a Horizontal Toaster seems less creative when a sketch is provided against other sketches. This can imply that the nature of the medium causes the content to be processed differently, and may also imply that the interpretation of “creativity” differs across different media.
6. CONCLUSIONS
It was observed that varying sketch quality impacts perceived creativity (p > 0.001) and that higher sketch quality correlates with a higher perceived creativity (p > 0.005). Over all four toaster concepts used in this study, the highest quality sketches had a normalized average creativity rating at 0.52, with lower scores representing high creativty. The poorest quality sketches had a normalized average creativity rating at 0.71.
The high quality sketches were on average 2.3 times more likely to be ranked as the most creative idea when compared to sketches of the same idea drawn with lower quality. Lowest quality sketches were on average 2.4 times more likely to be ranked the least creative idea when compared to high quality sketches of the same idea.
The results imply that line quality, correct perspective and realistic proportions are factors of a sketch that can influence the perceived creativity of an idea. This underscores the importance of selecting similar quality sketches when comparing ideas, and it also suggests possible implications for group brainstorming where wider level of sketching skills may be present.
The findings also support the inclusion of sketch training in curricula for designers, engineers, and innovators, so that sketching ability can be elevated to a consistent level and biases caused by differing sketch quality can be reduced. To further explore these ideas, the experiments in this study could be repeated with target populations such as students, designers, and engineers in order to obtain a more concrete understanding of how sketch training affects these populations.
Finally, this study focused on the quality of sketches (line work, perspective and proportions) at a prescribed level of detail. Further studies could explore of the influence of level of detail. Specifically, how the amount of detail, rendering and refinement affects perceptions of creativity. It is possible that ideas that have greater rendering and realism are easier to envision as a real product, but are also less open to interpretation. A simliar study could be conducted that replaces the quality of sketch with stages in a design process (e.g. the same four ideas each presented as a rough sketch, a CAD model, an early stage mockup, and an alpha prototype).
As storytelling has been found to affect the success of oral deisgn presentations (Morton & O'Brien, Reference Morton and O'Brien2005), it would be interesting to explore the effects of adding narrative elements to concept sketches. It might be hypothesized that concept sketches that are more simliar to storyboards and comics are a more persuasive form of presentation.
Barry Kudrowitz is the Director of Graduate Product Design Studies at the University of Minnesota. He received his PhD from the Mechanical Engineering Department at MIT in 2010 studying humor, creativity, and idea generation. Barry codesigned a Nerf toy that is currently on the market, an elevator simulator that is in operation at the International Spy Museum in Washington DC, and a ketchup dispensing robot that was featured on the Martha Stewart and Conan O'Brien shows. Barry received the Goodwin Medal for Conspicuously Effective Teaching (2009) and the Carl G. Sontheimer Prize for Creativity and Innovation in Design (2010).
Paula Te graduated from MIT in June 2011 with a BS in mechanical engineering. Over her undergraduate career, she developed a strong interest in product design and user experience design. During her studies, she worked with a team of students to create and design a water bottle washing and filling station designed to make it easy to clean, refill and reuse water bottles. She has also worked as a product designer at American Innovative, designing two products for parents now on the market. Paula currently works as an Information Architect at Siegel + Gale.
David Wallace joined the MIT Mechanical Engineering Faculty in 1994 and is the Codirector of the MIT Computer-Aided Design Laboratory. Having a background in both industrial design and mechanical engineering, he teaches graduate and undergraduate product design courses that center on designing and prototyping innovative products. He has received several teaching awards and is a MacVicar faculty fellow, the highest teaching honor at MIT. Professor Wallace was also the content director, challenge director, and animation designer for an award-winning national public television program called Design Squad, which is intended to motivate and inspire youths to pursue technical innovation career paths.
APPENDIX A
The following is the original list of 10 toaster ideas. In the experiment, experts and nonexperts ranked the creativity of these written ideas; out of the 10 ideas, 4 of the ideas were ranked consistently. The 4 ideas were used in the final experiment.
• A toaster with an opening underneath and raised feet such that when the toast is finished, the toast can fall down onto a plate below.
• A horizontal toaster such that the bread is inserted and comes out horizontal to the ground.
• A toaster with a side panel that you can draw on; the drawing can then be toasted on to the bread.
• A toaster that has a removable crumb tray at the bottom.
• A combination toaster/coffee maker.
• A toaster built flush into the kitchen countertop.
• A clear toaster that allows you to see the toasting process.
• A toaster with a countdown digital timer indicating how much time is left until the toast is ready.
• A toaster that has enough slots for toasting a whole loaf of bread.
• A toaster that toasts bread as it moves through heating elements on a horizontal conveyor belt.
APPENDIX B
The following prompt was supplied to the participants providing the sketches for this experiment.
• Each of the sketches should be done on 8.5 × 11 in. paper using only a fine-point black Sharpie, and the paper should be horizontally positioned (wider than it is tall).
• At the top of the page, please write the title of the toaster (given above) in large letters.
• There should only be one toaster on the paper (not multiple views of the same toaster, etc.); remember to draw large.
• You may annotate the sketch if desired, but try to say as much as possible using the sketch.
• The description of the concept must be accurately reflected in the sketch; please don't add extra features.
• Feel free to sketch as fast or as slow as you want, as long as you spend no more than 15 minutes on each sketch.
APPENDIX C
In the online survey provided in Amazon Mechanical Turk, reviewers received the following prompt before ranking the four presented toaster concepts:
Four toaster ideas are displayed. Please take a look at the images, then rank them based on how CREATIVE the idea is. Rank them in order of most creative to least creative. You cannot give two ideas the same value; try to reason why one might be more creative than another. Use the drop down menus next to the idea names to rank the respective images. 1 = Most creative Idea, 4 = Least creative Idea.