


I. Introduction
As climate change accelerates, financial institutions play an increasingly important role in shifting our economy to a low-carbon future. Professional asset managers are incorporating sustainability considerations into their investment processes.Footnote 1 There is a growing literature exploring how financial institutions manage climate risk. Although much has been written about the green investing practices of mutual funds (Ceccarelli, Ramelli, and Wagner (Reference Ceccarelli, Ramelli and Wagner2021), Ceccarelli, Evans, Glossner, Homanen, and Luu (Reference Ceccarelli, Evans, Glossner, Homanen and Luu2023), Choi, Gao, Jiang, and Zhang (Reference Choi, Gao, Jiang and Zhang2023), and Kim and Yoon (Reference Kim and Yoon2023)), venture capital funds (Barber, Morse, and Yasuda (Reference Barber, Morse and Yasuda2021)), and university endowments (Aragon, Jiang, Joenväärä, and Tiu (Reference Aragon, Jiang, Joenväärä and Tiu2025a)), relatively limited research examines how hedge funds, among the most sophisticated investors, react to climate change and incorporate sustainability into their investment processes.
We argue that the hedge fund industry provides an important setting to study green investing for three reasons. First, hedge funds face fewer trading constraints and can use complex strategies with lower transparency and regulatory oversight. This flexibility may allow hedge funds to incorporate green investing into both return generation and risk management, providing downside protection and reducing portfolio drawdowns. Second, unlike “ESG-motivated” investors, hedge funds are profit-oriented arbitrageurs with strong performance incentives.Footnote 2 They are more likely to be “ESG-aware” investors who uncover and incorporate sustainability information that is financially relevant but overlooked by other investors (Pedersen, Fitzgibbons, and Pomorski (Reference Pedersen, Fitzgibbons and Pomorski2021)). Third, hedge funds help improve market efficiency by identifying and capitalizing on market anomalies (Cao, Lo, Liang, and Petrasek (Reference Cao, Lo, Liang and Petrasek2018b)). If environmental factors affect firm performance but are not fully reflected in prices (Lindsey, Pruitt, and Schiller (Reference Lindsey, Pruitt and Schiller2022)), hedge funds can trade on such mispricing and help price these factors more accurately (Cao, Chen, Goetzmann, and Liang (Reference Cao, Chen, Goetzmann and Liang2018a)).
In this article, we aim to answer the following questions. First, how does green investing impact hedge fund performance and risk, especially during adverse market conditions? Second, do hedge funds possess specialized green investment skills? Third, is there heterogeneity in the effects of fund greenness across hedge fund investment strategies? Finally, how do investors respond to green hedge funds?
Our study extends the literature on sustainable investing and investment funds by providing new evidence from the hedge fund industry. First, we show that fund-level greenness is associated with higher returns, which contributes to the debate on the financial consequences of sustainable investment. Second, we document that greener hedge funds exhibit lower risk, particularly in adverse states. This finding is consistent with the interpretation that hedge fund greenness relates not only to stronger fund performance but also to a more resilient risk profile. Third, we show that return and risk benefits operate differently across investment strategies. The performance effect is greatest among directional funds, whereas the risk-reduction effect is most pronounced among nondirectional funds. Fourth, we identify green investment skill as a distinct dimension of managerial skill and show that green hedge fund managers possess such skill through both green stock selection and green factor timing. Lastly, we propose a new fund-level, return-based measure of green exposure, the green beta, which can be estimated even when holdings data are limited and naturally incorporates both long and short positions.
We start our analysis by introducing green beta, a return-based measure of hedge fund greenness that captures a fund’s green exposure. We estimate each hedge fund’s green beta by estimating its return exposure to a green factor developed by Pástor, Stambaugh, and Taylor (Reference Pástor, Stambaugh and Taylor2022).Footnote 3 Next, we study the relation between green beta and fund performance. Our analyses reveal that green beta positively predicts hedge funds’ excess returns and 7-factor alphas. The observed outperformance of greener hedge funds underscores the notion that hedge funds can “do well by doing good” (Bénabou and Tirole (Reference Bénabou and Tirole2010)).Footnote 4 However, we do not find significant outperformance when using green-factor-adjusted alpha, suggesting that the outperformance of greener hedge funds partly reflects compensation for their exposure to the green premium.
In terms of fund risk, we document that greener hedge funds exhibit lower total risk and tail risk. When decomposing total risk into systematic and idiosyncratic components, we find reductions in both risk components. Our result suggests that rather than merely representing exposure to a rewarded factor, greenness in hedge funds may act as a form of climate-related risk mitigation or insurance. Further analysis across strategies reveals meaningful heterogeneity in how green beta relates to fund return and risk. The performance effect is greatest among directional funds, whereas the risk-reduction effect is most pronounced among nondirectional funds.
Going beyond unconditional performance and risk, we next test whether green hedge funds exhibit more favorable performance and risk profiles during adverse periods. Specifically, we examine two adverse periods: market downturns and climate-specific stress states. In both settings, greener funds display stronger conditional performance and lower risks. This evidence has profound implications for investors seeking portfolio resilience.
We next investigate whether managers of greener hedge funds exhibit green investment skills. We show that managers of these funds demonstrate better stock-picking skills and green factor-timing skills. Finally, we shift our focus to examine whether hedge fund investors recognize and reward green investing practices. We show that greener funds tend to attract greater investor flows, particularly after the 2015 Paris Agreement. However, these incremental flows are concentrated only among funds with strong performance. Additionally, we find that investor flows toward green hedge funds increase after climate news shocks.
Our article contributes to several strands of literature. First, we complement research on climate change and the investment fund industry. Prior studies examine green investing by mutual funds, venture capital funds, and university endowments, but evidence on hedge funds remains limited (see, e.g., Alok, Kumar, and Wermers (Reference Alok, Kumar and Wermers2020), Barber et al. (Reference Barber, Morse and Yasuda2021), Ceccarelli et al. (Reference Ceccarelli, Ramelli and Wagner2021), Alekseev, Giglio, Maingi, Selgrad, and Stroebel (Reference Alekseev, Giglio, Maingi, Selgrad and Stroebel2022), and Aragon et al. (Reference Aragon, Jiang, Joenväärä and Tiu2025a)). Focusing on the hedge fund industry allows us to contribute to the broader debate on the financial implications of sustainable investing. Some studies document return–nonpecuniary benefit tradeoffs (Riedl and Smeets (Reference Riedl and Smeets2017), Barber et al. (Reference Barber, Morse and Yasuda2021), Gibson, Glossner, Krueger, Matos, and Steffen (Reference Gibson, Glossner, Krueger, Matos and Steffen2022), Liang, Sun, and Teo (Reference Liang, Sun and Teo2022), and Kim and Yoon (Reference Kim and Yoon2023)), whereas others find no performance sacrifice and improved portfolio Sharpe ratios (Pedersen et al. (Reference Pedersen, Fitzgibbons and Pomorski2021), Lindsey et al. (Reference Lindsey, Pruitt and Schiller2022)). We show that fund-level greenness is associated with increased performance. However, our results should be interpreted in light of the green-factor-adjusted alpha findings, which suggest that the outperformance of greener hedge funds partly reflects compensation for their exposure to the green premium.
Second, we contribute to the literature on the risk implications of sustainable investing. Prior research primarily emphasizes the return consequences of sustainable investing, with less attention to its risk effects. The few studies that examine risk often argue that sustainable investment may entail costs, such as reduced diversification and higher return volatility (Ceccarelli et al. (Reference Ceccarelli, Ramelli and Wagner2021), Aragon et al. (Reference Aragon, Jiang, Joenväärä and Tiu2025a)). In contrast, we provide new evidence that greener hedge funds are associated with lower risk, particularly during adverse market conditions. These findings highlight a potential role of sustainable investing in enhancing portfolio resilience.
Third, our study identifies green investment skills as an additional dimension of hedge fund managerial skill. Prior studies document hedge fund managers’ skills in areas such as volatility timing, liquidity management, macroeconomic uncertainty, sentiment trading, and political sensitivity (Chen and Liang (Reference Chen and Liang2007), Cao, Chen, Liang, and Lo (Reference Cao, Chen, Liang and Lo2013), Bali, Brown, and Caglayan (Reference Bali, Brown and Caglayan2014), Chen, Han, and Pan (Reference Chen, Han and Pan2021), and Chen, Kumar, Lu, and Singh (Reference Chen, Kumar, Lu and Singh2022)), but relatively little is known about their ability to incorporate environmental factors into investment decisions. We provide evidence that managers of greener hedge funds exhibit superior green investment skills in both green stock picking and green factor timing.
Fourth, we introduce a novel return-based measure of hedge fund greenness. Our green beta can be estimated for any fund with observable returns, including funds for which holdings-based measures are difficult to construct. The measure is transparent, uniformly applied, and does not rely on voluntary carbon disclosure. Because it is estimated at the individual fund level, it avoids the noise in firm-level metrics that aggregate multiple strategies. It also captures both long and short positions, providing a more comprehensive assessment of hedge fund green exposure.
Our article is closely related to the contemporaneous study by Aragon, Jiang, Joenväärä, and Tiu (Reference Aragon, Jiang, Joenväärä and Tiu2025b), and both studies address an underexplored area in the literature on hedge fund green investing. Our study complements their work by examining the broader performance and risk implications of green investing. In addition to documenting a positive relation between fund greenness and performance, we show that greener hedge funds have lower risk, particularly during market downturns and periods of heightened climate policy uncertainty (CPU). We also find that the benefits of green investing vary across fund investment strategies. Finally, we identify both green stock selection and green factor timing as important sources of green investment skills. Taken together, the two studies provide consistent and complementary evidence on hedge fund green investing and highlight the important role hedge funds play in this area.
This article is organized as follows: Section II describes the data and outlines the methodology for measuring hedge fund greenness. Section III presents the empirical results, followed by the robustness analysis in Section IV. Finally, Section V concludes the study.
II. Data and Methodology
In this section, we summarize the data sets used in our empirical analysis and introduce a novel method for measuring a hedge fund’s greenness, which enables us to assess a hedge fund’s exposure to green stocks at the individual fund level.
A. Data and Sample Construction
We construct a comprehensive hedge fund sample consisting of both live and defunct hedge funds from TASS, HFR, and Morningstar CISDM. The merged data set has a total of 1,963 hedge funds, of which 890 are live funds and 1,073 are dead (defunct) funds. We limit the sample to fund-month observations with at least $1 million in assets under management (AUM), and our final sample contains 66,841 fund-month observations spanning January 2012 to December 2021.Footnote 5 In addition to net-of-fee returns and AUM, we obtain a broad range of fund characteristics, including management fee, incentive fee, lock-up period, leverage, high water mark, investment strategies, inception date, fund location, and fund manager information. We categorize funds into 12 different investment strategies following Liang et al. (Reference Liang, Sun and Teo2022).
Commercial hedge fund databases suffer from two potential biases: backfilling bias and incubation bias.Footnote 6 To reduce the backfilling bias, we follow Liang et al. (Reference Liang, Sun and Teo2022) and include only hedge fund returns that were reported after the fund’s listing date in the database. In cases where databases do not provide information on listing dates, we employ Jorion and Schwarz’s (Reference Jorion and Schwarz2019) algorithm to infer the listing dates. To eliminate the incubation bias, we follow Liang et al. (Reference Liang, Sun and Teo2022) and exclude the first 24 months of return data.Footnote 7
For other data sets, hedge fund holdings data are from the Thomson Reuters CDA/Spectrum Institutional (13F) Holdings Database. Stock return data are from the Center for Research in Security Prices (CRSP), and the firms’ financial data are from Compustat. The risk factors for the Fama–French (Reference Fama and French1993) 3-factor model, the Carhart (Reference Carhart1997) 4-factor model, and the Fama–French (Reference Fama and French2015) 5-factor model are from Kenneth French’s data library. Company-level carbon risk scores are from Sustainalytics, which is a leading company in ESG research and ratings. The carbon risk score takes values between 0 and 100, where lower scores correspond to firms with lower carbon risk (green) and higher scores correspond to firms with greater carbon risk (brown). Firm green innovation data are from the United States Patent and Trademark Office (USPTO) Bulk Data Storage System.Footnote 8
B. Measure of Hedge Fund Green Beta
We construct a novel measure to capture a hedge fund’s exposure to green assets at the individual fund level and refer to this measure as green beta. Specifically, we estimate fund green beta using the following regression model:

where
$ {r}_{i,t} $
 is the return of fund i in month t over the risk-free rate.
$ {f}_{green,t} $
 is the green factor proposed in Pástor et al. (Reference Pástor, Stambaugh and Taylor2022).
$ {\beta}_g $
 is the green beta that measures fund i’s exposure to green assets. A higher (lower) green beta indicates that the fund is greener (browner) due to its greater (smaller) exposure to the green factor.
$ {f}_{j,t} $
 denotes the seven factors from Fung and Hsieh’s (Reference Fung and Hsieh2004) 7-factor model. In the main regression analysis, we use 24-month rolling windows to estimate the coefficients. The results are consistent if we change the rolling window to 12 or 18 months.
One concern is that a hedge fund’s exposure to the green factor may inherently entail exposure to the market factor, implying that the green beta could partially capture the same information as the market beta. To address this issue, we investigate the correlation between the green beta and each of the betas in the 7-factor model. As demonstrated in Table A1 in the Supplementary Material, the correlation between green beta and market beta is positive, yet the magnitude remains relatively small at 0.16. This indicates that, although some overlap exists between the information contained in the green factor and market factor, the extent to which green beta and market beta pick up similar information remains minimal. The correlations between the green beta and other betas are even smaller. As a result, the low correlations between green beta and all other betas provide no evidence that the green beta captures exposure to other risk factors.
An alternative approach to assessing a hedge fund’s exposure to the green factor is to calculate the value-weighted average portfolio carbon risk score using the stock holdings data of hedge fund firms (Liang et al. (Reference Liang, Sun and Teo2022)). We argue that our return-based green beta methodology offers several advantages over this alternative measure. First, the cross-sectional coverage of our measure surpasses that of the hedge fund firm-level carbon risk measure. Our method enables the estimation of sensitivity toward a green factor for any hedge fund with observable returns. Consequently, our approach allows for the calculation of green betas for hedge funds that lack other carbon-related measures, as well as for strategies for which constructing such metrics is inherently challenging. The estimation process is transparent and uniform across all hedge funds and does not rely on the voluntary disclosure of carbon-related information. Second, the green beta is computed at the individual fund level, whereas the carbon risk measure is determined at the hedge fund management firm-level, which is prone to higher noise as one firm may comprise multiple funds with varying strategies. Our green beta measure can be directly employed to analyze the relationship between a hedge fund’s green exposure and its performance, risk, and investor flows. Third, hedge funds may pursue decarbonization strategies by short-selling brown stocks, which is not reflected in the holdings-based measures. Our return-based approach overcomes this issue by accounting for both long and short positions and incorporating leverage, thus capturing a more comprehensive representation of the hedge fund’s efforts toward decarbonization. Nonetheless, as a robustness test, we calculate a hedge fund holdings-based carbon risk measure and substitute it for green beta in our main analysis, and the main results are consistent.
C. Summary Statistics
Table 1 presents the summary statistics of the variables used in our baseline regression. For all hedge funds in our sample, the mean of AUM is $396.773 million, the average monthly return is 0.564%, while the monthly 7-factor alpha is 0.144%. In terms of risk, the average total risk is 2.977%, whereas the tail risk averages 5.313% per month. The average monthly fund flow is 0.001%, but the variation among funds is substantial. The average age is 10.6 years. The average hedge fund green beta in our sample is −0.003, while the median is 0.015. These findings suggest that, on average, hedge funds exhibit relatively low exposure to green stocks. However, the green beta measure has a standard deviation of 1.109, indicating a considerable variation in the degree of exposure to green assets across different funds.

Table 1 Long description
The table contains 16 rows of data across 5 statistical columns: Mean, Median, Std. Dev., Min, and Max.
* A U M (U S dollar m): Mean 396.773, Median 100.000, Std. Dev. 837.313, Min 1.000, Max 5,004.000.
* Management fee (percent): Mean 1.395, Median 1.500, Std. Dev. 0.465, Min 0.000, Max 4.000.
* Incentive fee (percent): Mean 16.710, Median 20.000, Std. Dev. 6.948, Min 0.000, Max 50.000.
* High water mark (dummy): Mean 0.838, Median 1.000, Std. Dev. 0.368, Min 0.000, Max 1.000.
* Leveraged (dummy): Mean 0.638, Median 1.000, Std. Dev. 0.480, Min 0.000, Max 1.000.
* Redemption period (days): Mean 77.305, Median 90.000, Std. Dev. 77.026, Min 0.000, Max 365.000.
* Lock-up period (months): Mean 5.219, Median 0.000, Std. Dev. 7.225, Min 0.000, Max 48.000.
* Rate of return (percent): Mean 0.564, Median 0.560, Std. Dev. 3.276, Min minus 10.390, Max 11.039.
* Alpha (percent): Mean 0.144, Median 0.141, Std. Dev. 0.750, Min minus 7.919, Max 5.940.
* Fund age: Mean 10.656, Median 9.000, Std. Dev. 6.491, Min 0.000, Max 37.000.
* Flow (percent): Mean 0.001, Median 0.000, Std. Dev. 0.067, Min minus 0.252, Max 0.437.
* Total risk (percent): Mean 2.977, Median 2.513, Std. Dev. 2.029, Min 0.021, Max 26.312.
* Systematic risk (percent): Mean 2.301, Median 1.902, Std. Dev. 1.733, Min 0.017, Max 23.816.
* Idiosyncratic risk (percent): Mean 1.747, Median 1.436, Std. Dev. 1.283, Min 0.008, Max 13.316.
* Tail risk (percent): Mean 5.313, Median 4.700, Std. Dev. 3.085, Min minus 0.610, Max 10.390.
* Green beta: Mean minus 0.003, Median 0.015, Std. Dev. 1.109, Min minus 8.092, Max 11.479.
Table 2 reports the distribution of green beta among diverse hedge fund investment strategies. Long-only hedge funds exhibit the highest average green beta (0.678), followed by multi-strategy and global macro. In contrast, hedge fund strategies such as short bias, emerging markets, and sector-focused funds display the lowest green beta. These strategies may face greater challenges in integrating ESG considerations into their investment processes, as their investment objectives and portfolio construction approaches differ substantially from those of traditional long-only equity funds.

Table 2 Long description
The table contains four columns: Fund Strategy, Green Beta (Mean), Std. Dev., and No. of Obs. The data rows are as follows:
* Long only: 0.678 mean, 0.714 standard deviation, 124 observations.
* Multi-strategy: 0.111 mean, 0.738 standard deviation, 3,313 observations.
* Global macro: 0.108 mean, 1.060 standard deviation, 6,372 observations.
* Long/short equity: 0.076 mean, 1.212 standard deviation, 37,709 observations.
* Equity market neutral: minus 0.118 mean, 0.648 standard deviation, 2,575 observations.
* Event-driven: minus 0.145 mean, 0.908 standard deviation, 9,059 observations.
* C T A: minus 0.223 mean, 0.360 standard deviation, 67 observations.
* Relative value: minus 0.274 mean, 0.880 standard deviation, 6,215 observations.
* Other: minus 0.391 mean, 0.329 standard deviation, 381 observations.
* Sector: minus 0.638 mean, 0.680 standard deviation, 39 observations.
* Emerging markets: minus 0.704 mean, 1.738 standard deviation, 900 observations.
* Short bias: minus 0.710 mean, 0.754 standard deviation, 87 observations.
D. Hedge Fund Holdings and Trading Toward Green Assets
We also report descriptive evidence on hedge fund allocations and trading patterns across green and brown industries using 13F holdings data. Each year, we sort industries into terciles based on their industry-average carbon risk scores. Industries in the lowest tercile are classified as green, while those in the highest tercile are classified as brown (we omit the middle tercile for brevity). Graph A of Figure 1 shows that, over our sample period, the average portfolio weight in green industries increases from 33% to 42%, while the weight in brown industries declines from 20% to 14%.
Graph A of Figure 1 plots the trends in hedge funds’ holdings of green industry companies and brown industry companies over time. Each year, we calculate the average carbon risk score for each industry based on the carbon risk scores of its constituent companies. Industries are then sorted into terciles based on the industry’s carbon risk score. Green industries are defined as those in the lowest carbon risk tercile, while brown industries are those in the highest tercile. Green industry companies are defined as companies in the green industries. Brown industry companies are defined as companies in the brown industries. Weight is defined as the holding value of companies in each tercile divided by the total holding value of hedge funds. Graph B plots the average weight of hedge fund quarterly net purchases (total purchases minus total sales) sorted by companies’ industry. Graphs C and D plot the weight of hedge fund quarterly net purchases (total purchases minus total sales) sorted by companies’ industry. Each year, we calculate the average carbon risk score for each industry based on the carbon risk scores of its constituent companies. Industries are then sorted into three ranks based on the industry’s carbon risk score. Green industries are defined as those in the lowest carbon risk tercile, while brown industries are those in the highest tercile. Next, within each industry, companies are further sorted into three additional ranks based on their carbon risk scores. Graph C reports hedge funds’ net purchases in the green industry. Graph D reports hedge funds’ net purchases in the brown industry. The sample includes all the 13F stocks held by hedge funds from TASS, HFR, and Morningstar CISDM databases. The sample period is from 2012 to 2021.

FIGURE 1 Long description
A multi-panel figure containing four graphs labeled A through D. All graphs share a horizontal x-axis representing years from 2012 to 2021.
Graph A. Hedge Fund Holdings by Industry. The y-axis is Weight of hedge fund holdings from 0 to 0.45. A solid green line for Green industry firms shows a steady upward trend from approximately 0.33 in 2012 to 0.42 in 2021. A dashed brown line for Brown industry firms shows a gradual decline from 0.2 in 2012 to 0.14 in 2021. A vertical dashed line marks the Paris Agreement in late 2015.
Graph B. Hedge Fund Net Purchase by Industry. A bar chart with a y-axis for Weight of hedge fund net purchase from 0 to 0.3. Solid green bars for Green Industry are consistently taller than dotted brown bars for Brown Industry. Green industry purchases peak around 2020 (labeled COVID) at approximately 0.24, while brown industry purchases remain relatively flat or slightly declining between 0.1 and 0.07.
Graph C. Hedge Fund Net Purchase in the Green Industry. The y-axis ranges from 0 to 0.18. A solid green line represents Low Carbon risk firms in green industry, showing a volatile but increasing trend, peaking at 0.17 in 2019. A dashed brown line represents High Carbon risk firms in the green industry, remaining lower and more stable between 0.04 and 0.09.
Graph D. Hedge Fund Net Purchase in the Brown Industry. The y-axis ranges from 0 to 0.07. A solid green line for Low Carbon risk firms in brown industry and a dashed brown line for High Carbon risk firms in brown industry show highly volatile and overlapping trends. Both lines generally fluctuate between 0.02 and 0.05, with a notable spike for low carbon risk firms to 0.06 in 2020 followed by a sharp drop.
Next, we employ the same sorting procedure and report hedge funds’ quarterly trading patterns. Graph B of Figure 1 shows that hedge funds’ net purchases are generally higher in green industries, with notable peaks in 2015 and again in 2020 around the COVID period. At the same time, hedge funds do not fully exit brown industries. They maintain net purchases of approximately 10% of high-carbon companies each quarter. This pattern aligns with a positive-screening mechanism, in which hedge funds decarbonize their portfolios by increasing holdings of green stocks while maintaining a presence in brown industries.
Lastly, we describe hedge funds’ trading behavior at the stock level. Building on the industry greenness classification, we further sort firms within each industry into terciles based on firm-level carbon risk. This two-way double sort assigns each firm an industry label and a within-industry greenness rank. Graphs C and D of Figure 1 plot hedge funds’ net quarterly trading for each stock category as a percentage of prior-quarter holdings, separately for green-industry and brown-industry stocks. Graphs C and D of Figure 1 show an asymmetric pattern. Within green industries, hedge funds tilt their trading toward the greenest firms, whereas within brown industries, they show little differentiation across firms.
III. Empirical Results
A. Hedge Fund Greenness and Fund Performance
In this section, we examine how hedge funds’ degree of greenness, measured by the fund green beta introduced in Section II.B, affects hedge fund performance.
We start with the univariate analysis. Each month, funds are sorted into quintiles based on their green beta. We then evaluate the portfolio performance over the next month for funds in each quintile. We measure fund performance in two ways: fund excess return and Fung and Hsieh 7-factor alphas using a rolling 24-month window. Panel A of Table 3 reports the results. We observe a monotonic increase in hedge fund performance with the fund’s green beta. This initial evidence suggests that high-green-beta funds outperform their low-green-beta counterparts.

Table 3 Long description
Panel A, titled Hedge Fund Performance Sorted by Fund Green Beta, contains three columns: Green Beta, Alpha, and Excess Return. It lists five quintiles from Rank 5 (highest) to Rank 1 (lowest). Alpha values decrease from 0.240 at Rank 5 to 0.020 at Rank 1. Excess Return values decrease from 0.723 at Rank 5 to 0.376 at Rank 1. The Highest-lowest difference is 0.220 for Alpha and 0.347 for Excess Return, both significant at the 1 percent level.
Panel B, titled Hedge Fund Green Beta and Fund Performance, presents regression results with Alpha (Column 1) and Excess Return (Column 2) as dependent variables.
- Green beta: 0.074 (t-statistic 5.09) for Alpha and 0.122 (t-statistic 8.08) for Excess Return, both significant at the 1 percent level.
- log size: 0.039 for Alpha and minus 0.009 for Excess Return.
- Fund age: minus 0.017 for Alpha and minus 0.003 for Excess Return.
- Lock-up period: minus 0.000 for Alpha and 0.003 for Excess Return.
- Management fee: 0.195 for Alpha and 0.035 for Excess Return.
- Incentive fee: 0.006 for Alpha and minus 0.004 for Excess Return.
- High water mark: 0.119 for Alpha and 0.080 for Excess Return.
- Leveraged: minus 0.000 for Alpha and minus 0.019 for Excess Return.
Both models include Time F E and Strategy F E. The number of observations is 66,841 for both. R-squared is 0.108 for Alpha and 0.248 for Excess Return.
The sorting results may be driven by other factors that explain hedge fund returns. To alleviate this concern, we estimate the following regression model:

where Fund performance represents hedge fund excess return or the 7-factor alpha in the next month. Green beta is estimated from equation (1). The specification controls for standard fund characteristics. Size refers to a fund’s AUM, measured in millions of USD. Fund age measures years since the fund’s inception date. The lock-up period is measured in months. Both management and incentive fees are reported as percentages. High water mark is a dummy variable that takes the value of 1 if the hedge fund uses a high water mark, and 0 otherwise. Leveraged is a dummy variable that equals 1 if the hedge fund uses leverage, and 0 otherwise. We include strategy and time fixed effects and cluster standard errors by fund.
Panel B of Table 3 reports regression results. Across specifications, the coefficient on green beta is positive and statistically significant. Specifically, a 1-standard-deviation increase in fund green beta is associated with a 0.985% per annum (=0.074% × 1.109 × 12) increase in fund alpha and a 1.624% (=0.122% × 1.109 × 12) per annum increase in the excess return. Both coefficient estimates are significant at the 1% level. Overall, this finding provides empirical evidence that a hedge fund’s green beta positively predicts the fund’s performance.
As a robustness test, we reestimate the performance regression using a green-factor-adjusted alpha. We augment the Fung–Hsieh 7-factor model by adding the Pástor et al. (Reference Pástor, Stambaugh and Taylor2022) green factor when estimating fund alphas.Footnote 9 The coefficient on green beta becomes economically small and statistically insignificant, suggesting that part of the baseline outperformance reflects compensation for bearing green-factor exposure. Our outperformance results should be interpreted in light of the green-factor-adjusted alpha findings.
B. Hedge Fund Greenness and Fund Risk
An important and previously unexplored question in the literature is whether a hedge fund’s green beta is associated with the fund’s risk profile. We hypothesize that hedge fund greenness is linked to a more resilient risk profile. This conjecture is motivated by studies showing that stocks with lower carbon risk have lower total risk (Engle, Giglio, Kelly, Lee, and Stroebel (Reference Engle, Giglio, Kelly, Lee and Stroebel2020), Bolton and Kacperczyk (Reference Bolton and Kacperczyk2021)) and lower tail risk (Ilhan, Sautner, and Vilkov (Reference Ilhan, Sautner and Vilkov2021)). At the same time, green portfolios may be more concentrated, which can weaken diversification benefits and increase return covariance (Ceccarelli et al. (Reference Ceccarelli, Ramelli and Wagner2021)). Thus, the relation between green beta and hedge fund risk is ambiguous. Hedge funds provide a useful setting to examine this relation because their flexible strategies may shape the relation between green exposure and risk in ways that differ from traditional long-only portfolios.
To examine the relation between hedge fund green beta and fund risk, we consider four risk outcomes. Total risk is measured as the standard deviation of the fund’s monthly excess returns over a rolling window of the prior 24 months. We further decompose total risk into its systematic and idiosyncratic components. Idiosyncratic risk is measured as the standard deviation of the residuals from the fund’s factor model used to estimate alpha. Systematic risk is then measured as the component of total risk attributable to common factors, computed from the variance decomposition between total and idiosyncratic risk.Footnote 10 Finally, tail risk is measured as the fund’s 2-year 95% value-at-risk (VaR). We estimate the following regression model:

where Fund risk represents total risk, systematic risk, idiosyncratic risk, or tail risk (VaR), as defined previously. Green beta is estimated from equation (1). The specification includes the same set of control variables for fund characteristics as in equation (2). We include strategy and time fixed effects and cluster standard errors by fund.
Table 4 reports the regression results. Across all specifications, the coefficient on green beta is negative, indicating that greener hedge funds exhibit lower risk after controlling for observable fund characteristics and fixed effects. Specifically, a 1-standard-deviation increase in fund green beta is associated with a monthly decrease of 0.083% in total risk, 0.069% in systematic risk, 0.074% in idiosyncratic risk, and 0.134% in tail risk (VaR).Footnote 11 The economic magnitude is greatest for tail risk, consistent with climate risk being especially concentrated in the left tail.Footnote 12 At the same time, we find that greener hedge funds exhibit significantly lower total risk. When we decompose total risk into systematic and idiosyncratic components, we find that both channels contribute to the overall risk reduction. Among the other control variables, fund size is negatively correlated with all types of risk, while the lock-up period is positively related to all risk measures.

Table 4 Long description
The table consists of four columns representing dependent variables: 1 Total Risk, 2 Systematic Risk, 3 Idiosyncratic Risk, and 4 Tail Risk.
Key findings for the independent variable Green beta across the columns are:
* Total Risk: -0.075 with a t-statistic of -2.23 (significant at 5 percent).
* Systematic Risk: -0.062 with a t-statistic of -1.88 (significant at 10 percent).
* Idiosyncratic Risk: -0.067 with a t-statistic of -2.11 (significant at 5 percent).
* Tail Risk: -0.121 with a t-statistic of -2.16 (significant at 5 percent).
Control variables include:
* log size: Negative coefficients across all columns, significant at 1 percent.
* Fund age: Positive for Systematic and Tail Risk, negative for Idiosyncratic Risk.
* Lock-up period: Positive coefficients across all columns, significant at 5 or 10 percent.
* Management fee: Positive and significant at 1 percent for Idiosyncratic Risk only.
* Incentive fee: Negative and significant for Systematic Risk; positive and significant for Idiosyncratic Risk.
* High water mark and Leveraged: No statistically significant coefficients.
Model statistics at the bottom indicate:
* Time F E and Strategy F E are included (Yes) for all models.
* Number of observations: 66,841 for all columns.
* R-squared values: 0.249 for Total Risk, 0.261 for Systematic Risk, 0.152 for Idiosyncratic Risk, and 0.245 for Tail Risk.
To summarize, this section provides empirical evidence that a hedge fund’s green beta is associated not only with improved fund performance but also with lower fund risk. The risk reduction shows up in overall volatility and downside risk, and reflects declines in both systematic and idiosyncratic components. Overall, the evidence suggests that green exposure is associated with a more favorable risk–return profile.
C. Hedge Fund Greenness and Conditional Performance and Risk
Moving beyond unconditional performance and risk, we next test whether greener hedge funds exhibit more favorable conditional performance and risk profiles during adverse periods. Prior research shows that socially favorable assets may provide resilience when markets face broad or climate-related stress (Albuquerque, Koskinen, Yang, and Zhang (Reference Albuquerque, Koskinen, Yang and Zhang2020), Pástor and Vorsatz (Reference Pástor and Vorsatz2020), Pástor et al. (Reference Pástor, Stambaugh and Taylor2022)). If green characteristics capture a form of climate risk hedging or reflect managers’ ability to anticipate regulatory and transition risk, their advantages should be most pronounced in adverse market states rather than in normal times. Motivated by this intuition, we examine whether greener hedge funds exhibit stronger conditional performance and lower risk across two types of adverse states: market downturns and climate-related stress periods.
1. Market Downturns
First, we test whether greener hedge funds perform better in market downturns and exhibit more favorable conditional risk outcomes. Following Baur and Lucey (Reference Baur and Lucey2010) and Baur and McDermott (Reference Baur and McDermott2010), we define market crash months as months when the S&P 500 return falls within the bottom 1% of its distribution over the prior 30 years.Footnote 13 As a robustness check, we alternatively define market downturns using NBER recession months, and our results are consistent.Footnote 14 We modify equations (2) and (3) and estimate the following regression:

where the dependent variable is either the fund performance measure used in equation (2) or the fund risk measure used in equation (3). Green beta is estimated from equation (1). Market crash is a dummy variable that equals 1 in months classified as market crash months (as defined previously), and 0 otherwise. The specification includes the same set of control variables for fund characteristics as in equation (2). We include strategy and time fixed effects and cluster standard errors by fund. The standalone Market crash variable is absorbed with time fixed effects included.
Panel A of Table 5 reports the results. Columns 1 and 2 focus on performance. The interaction between Green beta and Market crash is positive and statistically significant, suggesting that greener funds perform better during market downturns. On an annualized basis, a 1-standard-deviation increase in fund green beta during market crash months translates into 2.502% (=0.188% × 1.109 × 12) higher excess returns and 1.464% (=0.110% × 1.109 × 12) higher alpha, implying a meaningful improvement in conditional performance. The coefficient on fund green beta remains positive across specifications, consistent with greener funds performing better on average, while the interaction shows that this relation strengthens specifically in bad states.

Table 5 Long description
The table is divided into two panels, each with 6 columns. Columns 1 and 2 measure Performance (Alpha and Excess Return). Columns 3 through 6 measure Risk (Total, Systematic, Idiosyncratic, and Tail Risk).
Panel A: Hedge Fund Performance and Risk During Market Downturns.
* Green beta times Market crash: Shows positive significant coefficients for Alpha (0.110) and Excess Return (0.188), and negative significant coefficients for Systematic Risk (-0.179) and Tail Risk (-0.253).
* Green beta: Positive significant coefficients for Alpha (0.074) and Excess Return (0.121); negative significant coefficients for Total Risk (-0.091), Idiosyncratic Risk (-0.068), and Tail Risk (-0.120).
* Control variables include log size, Fund age, Lock-up period, Management fee, Incentive fee, High water mark, and Leveraged status.
* Fixed Effects (F E) for Time and Strategy are included. Number of observations is 66,841.
Panel B: Hedge Fund Performance and Risk During Climate-Related Stress States.
* Green beta times High C P U: Shows positive significant coefficients for Alpha (0.068) and Excess Return (0.160). It shows negative significant coefficients across all risk categories: Total Risk (-0.292), Systematic Risk (-0.216), Idiosyncratic Risk (-0.178), and Tail Risk (-0.196).
* Green beta: Positive significant coefficients for Alpha (0.058) and Excess Return (0.084).
* Control variables and Fixed Effects remain consistent with Panel A. Number of observations is 66,841. R-squared values range from 0.110 to 0.264.
Columns 3 to 6 report the risk results. The interaction is negative and statistically significant for systematic risk and tail risk, indicating that greener funds are associated with lower market-wide exposure and downside risk. Economically, in crash months, a 1-standard-deviation increase in fund green beta is associated with an additional 0.199% reduction in systematic risk and an additional 0.281% reduction in tail risk.Footnote 15 Relative to the sample means of these variables, these effects correspond to reductions of approximately 8.6% and 5.3%, respectively.Footnote 16 This pattern suggests that, during market downturns, the association between green beta and risk reduction may operate through the systematic and downside-risk channels more directly. One possible interpretation is that market stress primarily amplifies aggregate and tail-related risk, and greener funds appear relatively better insulated. However, idiosyncratic risk reflects fund-specific shocks that are not directly linked to market-wide conditions, which limits the scope for green exposure to provide hedging benefits along this dimension. Similarly, total risk also incorporates idiosyncratic volatility, thereby attenuating the overall effect.
2. Climate-Related Stress Periods
Second, we examine whether green exposure is associated with more favorable performance and risk outcomes during climate-related stress states. Climate policy has become more uncertain in recent years as governments adjust their climate agendas and political priorities shift. Gavriilidis, Känzig, Raghavan, and Stock (Reference Gavriilidis, Känzig, Raghavan and Stock2026) develop a CPU index to capture uncertainty related to climate policy. Using this index, we construct a climate-stress dummy variable to identify periods of high CPU by sorting the CPU index into quintiles over its 30-year distribution and defining high-CPU months as those in the top quintile.Footnote 17 Specifically, High CPU is a dummy variable that equals 1 in months with high CPU, and 0 otherwise. Next, we rerun equation (4) and replace the Market crash dummy variable with the High CPU dummy variable.
Panel B of Table 5 reports the results. Columns 1 and 2 focus on fund performance and show that the interaction between Green beta and High CPU is positive and statistically significant, indicating that greener funds achieve stronger conditional performance during periods of elevated CPU. On an annualized basis, these estimates translate into approximately 2.129% higher excess returns and 0.905% higher alpha. Columns 3 to 6 focus on fund risk and show that the interaction is negative and statistically significant across all four risk measures. Economically, in high-CPU months, a 1-standard-deviation increase in fund green beta is associated with an additional reduction of 0.324% in total risk, 0.240% in systematic risk, 0.197% in idiosyncratic risk, and 0.217% in tail risk. Relative to the sample means of these variables, these effects correspond to reductions of approximately 10.9%, 10.4%, 11.3%, and 4.1%, respectively. The economic magnitudes suggest a meaningful association between green exposure and risk reduction. The results also show that the relation between green exposure and lower risk extends beyond a single risk component during periods of elevated CPU. While market crashes primarily amplify systematic and downside risk, CPU constitutes a persistent, policy-driven shock that influences both market-wide and fund-specific risk. Consistent with this view, exposure to greener firms appears to be associated with lower risk across multiple dimensions during high-CPU periods.
Overall, the evidence suggests that greener hedge funds exhibit greater portfolio resilience in adverse states, achieving superior relative performance and lower risk during market downturns and climate-related stress periods.Footnote 18
D. Hedge Fund Greenness and Green Investment Skills
Having established that greener hedge funds are associated with better performance and lower risk, we next investigate whether managers of these funds exhibit green investment skills. In this section, we explore two potential channels underlying the performance of green hedge funds: green stock-picking skills and green factor-timing skills. These mechanisms are not mutually exclusive.
1. Green Stock-Picking Skills
We begin by assessing whether managers of greener funds exhibit superior general stock-picking skills. To test this conjecture, we follow Kacperczyk, Nieuwerburgh, and Veldkamp (Reference Kacperczyk, Nieuwerburgh and Veldkamp2014) and utilize hedge fund holdings data from hedge funds’ 13F filings. Specifically, we measure hedge fund managers’ general stock-picking skills as follows:

where
$ {w}_{k,t}^j $
 is hedge fund management firm j’s portfolio weight in stock k at the start of quarter t and
$ {w}_{k,t}^m $
 is the market weight in stock k. The covariance of stock k’s return,
$ {R}^k $
 , with the market return,
$ {R}^m $
 , divided by the variance of the market return is
$ {\beta}_k $
 . N is the number of companies in the portfolio. A fund with a better stock-picking ability holds a larger fraction of a company during periods when that company’s realized stock return is high.
Since stock-picking skills are captured at the hedge fund management firm level, we aggregate individual fund green beta and other control variables to the hedge fund management firm level using both equal-weighted and value-weighted methods. We then regress the stock-picking skill variable on the aggregated green beta of hedge fund management firms and other firm-level characteristics using the following model:

where Stock-picking skill is estimated from the regression equation (5), and Green beta is estimated from the regression equation (1). The coefficient
$ {\beta}_1 $
 captures the relation between a fund’s green beta and the fund managers’ stock-picking skills. A positive and statistically significant
$ {\beta}_1 $
 indicates that a hedge fund with a higher green beta demonstrates better stock-picking skills. We include strategy and time fixed effects and cluster standard errors by hedge fund management firm.Footnote
19 Panel A of Table 6 reports the regression results. The coefficient of the variable of interest is positive and statistically significant across all specifications, indicating that higher green beta is associated with stronger stock-picking ability.

Table 6 Long description
The table is divided into two panels.
Panel A: Hedge Fund Management Firm Green Beta and General Stock-Picking Skills.
This panel has four columns. Columns 1 and 2 use Equal-Weighted Firm Green Beta, while columns 3 and 4 use Value-Weighted Firm Green Beta.
- Green beta: Coefficients are 0.079 (t-stat 2.52), 0.077 (t-stat 2.42), 0.071 (t-stat 2.26), and 0.070 (t-stat 2.21), all significant at the 5% level.
- Control variables include log(size), Fund age, Lock-up period, Management fee, Incentive fee, High water mark, and Leveraged. Most are not statistically significant.
- Fixed Effects: All columns include Time F E and Strategy F E.
- Number of observations: 7,461 for all columns.
- R-squared: Ranges from 0.027 to 0.029.
Panel B: Green Hedge Fund Overweight and Company Sustainability Potential.
This panel has six columns. Columns 1 to 3 show Delta Carbon Risk at 1, 3, and 5 years. Columns 4 to 6 show Delta Green Patent at 1, 3, and 5 years.
- Overweight: For Delta Carbon Risk, coefficients are -1.193, -4.885 (significant at 1%), and -6.373 (significant at 1%). For Delta Green Patent, coefficients are 15.774, 81.574 (significant at 10%), and 74.641 (significant at 10%).
- Control variables include B M ratio, Return, log(size), and R O A.
- Fixed Effects: All columns include Time F E and Industry F E.
- Number of observations: Decreases from 2,127 (column 1) to 843 (column 6).
- R-squared: Increases from 0.048 to 0.190 across the columns.
Next, we explore whether these managers apply their stock-picking skills to identify better green stocks. Specifically, we examine whether the managers can identify companies possessing sustainability-related information not yet discovered by the market. We analyze this information across two dimensions: carbon risk reduction and green innovation. We estimate the following regression model:

where
$ \Delta Firm\hskip0.4em {Sustainability\ Potential}_{k,n} $
 represents the change in company k’s carbon risk score or change in the number of green patents the company issues n years from year t. We let n take the values of 1, 3, and 5 years.
$ {Overweight}_{k,t} $
 is defined as the difference between firm k’s weight in the aggregate portfolio of green hedge funds and its weight in the overall market portfolio. Green hedge funds are defined as funds in the top quintile of green beta. A positive value of
$ {Overweight}_{k,t} $
 indicates that green hedge funds allocate disproportionately more to firm k than the market does, while a negative value indicates underweighting. We control for a company’s book-to-market ratio, return, logarithm of asset size, and return on assets ratio. We also control for year and industry fixed effects and cluster standard errors at the company level.
Panel B of Table 6 tabulates the regression results. We observe that green hedge funds are inclined to favor companies poised for future carbon risk reduction or an increase in green innovation. Specifically, a 10% overweight by green hedge funds is associated with a reduction in carbon risk by 48.85% in the short term (3 years) and 63.73% in the longer term (5 years). Additionally, these companies generate, on average, 8.16 (3 consecutive years) to 7.46 (5 consecutive years) more green patents. These findings imply that companies selected by green hedge funds hold sustainability-related information that has not yet been fully reflected in market prices, making it challenging for other investors to precisely evaluate their future potential in carbon reduction or green innovation. We show that green hedge fund managers are able to identify these companies whose green attributes are undervalued by the market. As a result, these positions may benefit when the market eventually incorporates this information. This edge is derived from managers’ deep understanding and exploitation of the companies’ underrecognized sustainability-related information and demonstrates hedge fund managers’ sophisticated investment skills.
Our findings align with Ceccarelli et al. (Reference Ceccarelli, Evans, Glossner, Homanen and Luu2023), who show that “proactive” fund managers generate private information about firms’ ESG characteristics and trade on this information to improve fund performance. These findings highlight hedge funds’ specialized investment acumen in green investing.Footnote 20
2. Green Factor-Timing Skills
We next examine whether green hedge funds have superior green factor-timing skills. Prior hedge fund studies provide evidence of timing skills in market returns, volatility, liquidity, and macroeconomic uncertainty (see, e.g., Chen (Reference Chen2007), Chen and Liang (Reference Chen and Liang2007), Cao et al. (Reference Cao, Chen, Liang and Lo2013), Bali et al. (Reference Bali, Brown and Caglayan2014)). In our analysis, we focus on funds’ green factor-timing skills and examine whether hedge funds can anticipate shifts in the green factor and adjust their asset allocation accordingly. Specifically, we test two conjectures. First, we investigate whether green hedge fund managers possess better green factor-timing skills. Second, we test whether these green factor-timing skills are associated with stronger fund performance.
We develop a green factor-timing model based on the market timing model of Henriksson and Merton (Reference Henriksson and Merton1981) and the sentiment timing model of Chen et al. (Reference Chen, Han and Pan2021). Specifically, for each hedge fund, we perform the following regression using data from a 24-month backward-looking rolling windowFootnote 21:

where
$ {r}_{i,t} $
 is the excess return on fund i in month t,
$ {f}_{green,t} $
 is the green factor,
$ {GMB}_t $
 is the green-minus-brown stock portfolio return from Pástor et al. (Reference Pástor, Stambaugh and Taylor2022), and
I
(.) is a dummy variable equal to 1 when
$ {GMB}_t $
 is greater than its time series mean, and 0 otherwise. The coefficient γ in regression equation (8) captures the fund manager’s green factor-timing ability. A manager with such skill dynamically adjusts the fund’s exposure to the green factor and increases the fund’s green factor exposure when the return of green assets is large, leading to a positive γ.
Next, to test whether green hedge fund managers possess better green factor-timing skills, we regress the green factor-timing skill variable γ on fund green beta and control for other characteristics in the following regression model:

where Green factor-timing skill is estimated from regression equation (8) and Green beta is estimated from regression equation (1). The coefficient
$ {\beta}_1 $
 captures the relation between a fund’s green beta and fund managers’ green factor-timing skills. A positive and significant
$ {\beta}_1 $
 indicates that a hedge fund with a higher green beta demonstrates more effective green factor-timing ability. The specification includes the same set of control variables for fund characteristics as in equation (2). We include strategy and time fixed effects and cluster standard errors by fund.
Panel A of Table 7 reports the regression results of equation (9). We find a positive and statistically significant association between green factor-timing ability and a fund’s green beta, indicating a strong link between fund greenness and the manager’s ability to time the green factor. Funds with higher exposure to green assets are better able to adjust that exposure in response to favorable conditions for green assets. Our findings reveal that although funds with higher green beta have larger allocations to green stocks, their green exposure is not constant over time. Instead, they adjust green exposure dynamically in response to changes in green-factor returns.

Table 7 Long description
Panel A, titled Green Factor-Timing Skills and Fund Green Beta, uses Green Factor-Timing Skills as the dependent variable across three columns.
* Green beta shows positive coefficients of 0.112, 0.110, and 0.123, all significant at the 5 percent level.
* log size shows positive coefficients of 0.066 and 0.065, significant at the 5 percent level.
* Fund age shows negative coefficients of minus 0.014, significant at the 1 percent level.
* Other variables like Lock-up period, Management fee, and Incentive fee show negative but non-significant coefficients.
* Fixed Effects F E include Time and Strategy for columns 1 and 2, and Strategy-time for column 3.
* R-squared values range from 0.049 to 0.086.
Panel B, titled Green Factor-Timing Skills and Fund Performance, uses Alpha in columns 1 and 2, and Excess Return in columns 3 and 4 as dependent variables.
* Green factor-timing skill shows positive coefficients ranging from 0.027 to 0.035, all significant at the 1 percent level.
* Green beta shows positive coefficients ranging from 0.064 to 0.145, all significant at the 1 percent level.
* log size is positive and significant across all columns.
* Fund age is negative and significant for Alpha but less significant for Excess Return.
* Management fee is positive and significant for Alpha (0.199 and 0.200) but non-significant for Excess Return.
* Fixed Effects F E vary by column, with R-squared values ranging from 0.116 to 0.309.
Finally, to investigate whether a manager’s green factor-timing skills are associated with better fund performance, we regress one-month-ahead fund performance (excess return or alpha) on the green factor-timing coefficient estimated from equation (8). Panel B of Table 7 reports the regression results. Across all models, the coefficients on green factor-timing skills are positive and statistically significant. Meanwhile, fund green beta continues to exhibit a strong relation with fund performance. Consistent with our second conjecture, we find that the green factor-timing coefficient is positively associated with subsequent hedge fund performance.
Taken together, we document that green hedge fund managers exhibit exceptional green investment skills. They demonstrate the ability to identify green companies whose sustainability potential is not fully recognized by the market. They also effectively adjust their green exposure to time the green factor. Both green stock-picking and green factor-timing skills are associated with superior performance.
E. Investment Strategy Heterogeneity
We explore heterogeneity in our findings across hedge fund investment strategies. Following Bali et al. (Reference Bali, Brown and Caglayan2014), we group funds into three broad strategy groups: directional, semidirectional, and nondirectional. Directional funds (long-only, CTA, emerging markets, sector, and global macro) take explicit market exposure, making them best positioned to incorporate green investing by tilting directly toward (or away from) green (brown) assets.Footnote 22 Semidirectional funds (long/short equity, event-driven, and multi-strategy) balance long and short positions, enabling them to overweight green firms while shorting brown firms. Nondirectional funds (relative value and equity market neutral) aim to eliminate market risk. Their green exposure is therefore more indirect, typically arising from arbitrage opportunities or relative mispricing rather than broad shifts in green asset demand.
We first examine heterogeneity in fund performance and risk across hedge fund strategy groups. Panel A of Table 8 reports the performance results. We observe a positive relation between green beta and fund performance. Specifically, green beta is positively and significantly related to alpha across directional, semidirectional, and nondirectional funds. Its positive relation with excess returns appears in directional and semidirectional funds but not in nondirectional funds, indicating that the performance effect is greatest for directional and semidirectional strategies and weaker for nondirectional funds. Panel B reports the risk results. We find that the negative relationship between green beta and risk is primarily concentrated among nondirectional funds, where higher green beta is associated with significantly lower total, systematic, idiosyncratic, and tail risk. By design, nondirectional funds employ arbitrage and market-neutral strategies that seek to minimize exposure to broad market movements. As a result, green exposure may be particularly valuable in these portfolios, contributing to risk reduction and enhancing overall portfolio stability.Footnote 23

Table 8 Long description
The table is divided into four panels (A through D). All panels include fund controls, Time F E, and Strategy F E.
Panel A: Hedge Fund Performance.
- Directional: Alpha is 0.175 (t-stat 4.39) and Excess Return is 0.102 (t-stat 2.37).
- Semidirectional: Alpha is 0.059 (t-stat 3.66) and Excess Return is 0.133 (t-stat 7.66).
- Nondirectional: Alpha is 0.112 (t-stat 3.01) and Excess Return is 0.056 (t-stat 1.33).
Panel B: Hedge Fund Risk.
- Directional: Total Risk is -0.101, Sys-Risk is -0.085, Idio-Risk is -0.055, and Tail Risk is -0.224.
- Semidirectional: Total Risk is -0.029, Sys-Risk is -0.012, Idio-Risk is -0.028, and Tail Risk is -0.007.
- Nondirectional: Significant negative correlations across all risks: Total Risk -0.770 (t-stat -7.17), Sys-Risk -0.563 (t-stat -7.05), Idio-Risk -0.528 (t-stat -7.04), and Tail Risk -1.206 (t-stat -7.17).
Panel C: Hedge Fund Stock-Picking Skills (E W and V W).
- Directional: E W is 0.327 (t-stat 7.20) and V W is 0.293 (t-stat 4.18).
- Semidirectional: E W is 0.029 and V W is 0.024.
- Nondirectional: E W is 0.075 and V W is 0.083.
Panel D: Hedge Fund Green Factor-Timing Skills.
- Directional: -0.038 (t-stat -0.30).
- Semidirectional: 0.157 (t-stat 2.69).
- Nondirectional: 0.032 (t-stat 0.51).
We also test the differences in the coefficients across the three strategy groups using Wald tests based on seemingly unrelated estimation (SUEST).Footnote 24 For performance, the alpha coefficient is significantly larger for directional funds than for semidirectional funds, while most other pairwise differences are not statistically significant. For risk, the coefficient on green beta is significantly more negative for nondirectional funds than for the other two strategy groups across all four risk measures. Overall, the results suggest that green beta is associated with superior overall fund outcomes, but the mechanisms differ by investment strategy: performance improvements are greatest among directional funds, whereas risk mitigation is most pronounced among nondirectional funds.
We next examine whether hedge funds’ green investment skills vary across different strategy groups. First, for stock-picking skills, we reestimate equation (6) within each strategy group and report the results in Panel C of Table 8. We find that stock-picking skills are more pronounced among directional funds. For directional funds, the coefficient on green beta is positive and statistically significant in both the equal-weighted and value-weighted specifications. In contrast, the corresponding coefficients for semidirectional and nondirectional funds are not statistically significant in either specification. We then reestimate equation (8) within each strategy group and report the results in Panel D of Table 8. We observe a different pattern for green factor-timing skills. In the within-group tests, only the semidirectional funds exhibit a statistically significant positive association between fund green beta and green factor-timing skills. We apply the same SUEST-based Wald tests to examine the difference between coefficients. For stock-picking skills, the coefficient on green beta is significantly larger for directional funds than for the other two groups. For factor-timing skills, however, the pairwise coefficient differences across groups are not statistically significant.
F. Hedge Fund Greenness and Climate Concerns
We now examine how climate concerns influence the behavior of hedge fund managers. Over the past decade, climate concerns have increased substantially among financial-market participants, including hedge fund managers and investors.Footnote 25 This increasing awareness can alert fund managers to the severity and urgency of climate change and thus change their investment behavior. Hedge funds may also need to adjust their holdings so that they can hedge against climate news, particularly during periods of pronounced negative climate news sentiment. We follow Engle et al. (Reference Engle, Giglio, Kelly, Lee and Stroebel2020) to construct an index to measure climate news sentiment from major U.S. newspapers. The index is calculated as the correlation between the text content of The Wall Street Journal (WSJ) and a fixed climate change vocabulary. We measure shocks to climate news sentiment as prediction errors from AR(1) models applied to the underlying WSJ climate change news index.Footnote 26 Each month, we regress the fund greenness measure (fund-level green beta) on the WSJ climate news shock in the previous month and include other control variables.Footnote 27 Table 9 tabulates the regression results. As expected, the coefficients are positive and statistically significant, suggesting that hedge funds increase their green exposure after unexpected climate news shocks.

Table 9 Long description
The table presents regression results for Green Beta across three numbered columns: 1, 2, and 3.
* Climate news shock: The coefficient is 0.581 in column 1, 0.574 in column 2, and 0.570 in column 3. All three values are significant at the 5 percent level. The t-statistics below the coefficients are 2.28, 2.26, and 2.22 respectively.
* Fund controls: No for column 1; Yes for columns 2 and 3.
* Time F E: Yes for columns 1 and 2; No for column 3.
* Strategy F E: Yes for columns 1 and 2; No for column 3.
* Strategy-time F E: No for columns 1 and 2; Yes for column 3.
* Number of observations: 66,201 for columns 1 and 2; 66,200 for column 3.
* R-squared: 0.036 for column 1; 0.047 for column 2; 0.064 for column 3.
G. Hedge Fund Greenness and Investor Response
In this section, we study hedge fund investors’ responses to hedge funds’ green investing. Previous studies document that mutual fund investors are more tolerant of poor performance in green mutual funds (Bollen (Reference Bollen2007), Renneboog, Ter Horst, and Zhang (Reference Renneboog, Ter Horst and Zhang2011), El Ghoul and Karoui (Reference El Ghoul and Karoui2017), Pástor and Vorsatz (Reference Pástor and Vorsatz2020)). We examine whether hedge fund investors similarly prioritize environmental objectives over short-term returns or instead balance them with performance.
To estimate fund flows, we follow prior research (see, e.g., Sirri and Tufano (Reference Sirri and Tufano1998)) and measure quarterly fund flows as follows:

where
$ {TNA}_{i,t} $
 and
$ {TNA}_{i,t-1} $
 are the total net assets of hedge fund i at times t and t – 1, respectively, and
$ {R}_{i,t} $
 is the raw hedge fund return from time t – 1 to t.
1. Fund Greenness and Fund Flows
We first analyze the relationship between fund flows and hedge fund greenness using the following specification:

where the dependent variable
$ {Fund\ flow}_{i,t+1} $
 is defined in equation (10).
$ {Green\ fund}_{i,t} $
 is a dummy variable that equals 1 if the fund green beta is above the median in the previous quarter, and 0 otherwise.
$ Past\ performance\;{\mathit{\operatorname{rank}}}_{i,t} $
 is calculated as either the past 12-month fund return rank (past return rank) or alpha rank (past alpha rank).Footnote
28
$ Past\;{Flow}_{i,t} $
 is defined as fund flows in the previous quarter (quarter t). The specification includes the same set of control variables for fund characteristics as in equation (2). We include strategy and time fixed effects and cluster standard errors by fund.
Table 10 reports the regression results. Column 1 presents the full-sample estimates and shows that green hedge funds attract greater investor flows after controlling for past fund performance, past flows, and fund characteristics. Specifically, funds with above-median green beta, captured by the Green fund indicator, are associated with a 0.53% increase in investor flows. This effect is economically significant, equivalent to an inflow of $8.4 (0.53% × 396.8 × 4) million per year for an average hedge fund. To gain deeper insight into investors’ perspectives on the green investing practices of hedge funds, we split the sample into low-alpha and high-alpha funds and reestimate equation (11) within each group.Footnote 29 Columns 2 and 3 present the results. We observe that the incremental investor flows for green hedge funds documented in column 1 are concentrated in the high-alpha sample. This suggests that hedge fund investors approach green investing differently compared to other investors, such as mutual fund investors. They prioritize performance and reward green hedge funds with higher inflows only when these funds also demonstrate strong returns.Footnote 30

Table 10 Long description
A data table with three columns of results: 1 Flow Full Sample, 2 Flow Low-Alpha Funds, and 3 Flow High-Alpha Funds.
* Green fund: In the full sample, the coefficient is 0.530 with a t-statistic of 3.14, significant at the 1 percent level. In low-alpha funds, it is 0.296 with a t-statistic of 1.27. In high-alpha funds, it is 0.453 with a t-statistic of 1.95, significant at the 10 percent level.
* Past return rank: Coefficients are 0.840 for full sample, 0.824 for low-alpha, and 0.707 for high-alpha, all significant at the 1 percent level with t-statistics of 13.76, 10.63, and 8.02 respectively.
* Past flow: Coefficients are 0.283 for full sample, 0.225 for low-alpha, and 0.287 for high-alpha, all significant at the 1 percent level with t-statistics of 22.38, 13.92, and 18.79 respectively.
* Fixed Effects and Controls: Fund controls, Time F E, and Strategy F E are marked as Yes for all three columns.
* Observations: Full sample has 22,631; Low-alpha has 10,791; High-alpha has 11,840.
* R-squared: Values are 0.125 for full sample, 0.096 for low-alpha, and 0.135 for high-alpha.
2. Other Factors Affecting Green Fund Flows
We further explore other factors that shape investor flows. We first investigate investors’ attention to climate change. In recent years, hedge fund investors such as pension funds and endowments increasingly require their investments to align with their sustainability objectives and encourage hedge funds to adopt greener strategies. Following prior literature, we use the 2015 Paris Agreement as a cutoff to capture the shift in investor attention, as research shows the Paris Agreement raised societal awareness of climate change (Bolton and Kacperczyk (Reference Bolton and Kacperczyk2021)). We split the sample into a pre-Paris period (2012–2014) and a post-Paris period (2015–2021) and reestimate equation (11) in each subsample. Panel A of Table 11 reports the results. We find that the incremental investor flows are significant only for funds with high alpha in the subsample period after the 2015 Paris Agreement. However, this relationship does not exist in the pre-Paris Agreement period or for low-alpha funds. These findings confirm that hedge fund investors’ awareness of climate risk has evolved over time and, consistent with other studies, the 2015 Paris Agreement played a pivotal role. Moreover, the results reaffirm that investors are unwilling to compromise returns for green investments. They reward green hedge funds with higher inflows only when these funds can generate superior performance.

Table 11 Long description
Panel A: Fund Flows before and after the 2015 Paris Agreement. It compares Low-Alpha and High-Alpha funds across four columns. Column 1 (Pre-Paris, Low-Alpha) shows Green fund coefficient 0.168 (t-stat 0.47). Column 2 (Pre-Paris, High-Alpha) shows 0.324 (t-stat 0.85). Column 3 (Post-Paris, Low-Alpha) shows 0.319 (t-stat 1.11). Column 4 (Post-Paris, High-Alpha) shows a significant 0.582** (t-stat 2.13). Past return rank and Past flow are highly significant (***) across all columns. Observations range from 4,003 to 7,596.
Panel B: Fund Flows and Climate News Shock (Post-Paris Period). It features two columns for Flow. The interaction term ‘Green fund * Climate news shock’ is highly significant in both columns: 8.738*** (t-stat 4.39) in Column 1 and 8.547*** (t-stat 3.97) in Column 2. Green fund alone is significant at the 10% level (0.521* and 0.508*). Past return rank and Past flow remain highly significant (***). Column 1 excludes fund controls while Column 2 includes them. Observations are 7,291 and 6,314 respectively.
We next examine whether climate news shocks affect investors’ behavior. Specifically, we augment our regression analysis in equation (11) by incorporating the WSJ climate news shock, as well as the interaction between the WSJ climate news shock variable and the Green fund variable.Footnote 31 In Panel B of Table 11, we show that the coefficient of the interaction is positive and significant. This finding indicates that investors actively allocate more capital toward green hedge funds after climate news shocks.
Over the past few years, there has been a notable increase in the number of hedge funds becoming signatories to the UNPRI. Upon becoming signatories, hedge funds are obligated to demonstrate a commitment to responsible investment practices. Building on Humphrey and Li (Reference Humphrey and Li2021) and Liang et al. (Reference Liang, Sun and Teo2022), we also investigate the impact of UNPRI membership on hedge fund behavior. Using a DiD design, we find that signatories significantly increase their green asset exposure and subsequently attract more fund flows. We discuss the model and report the results in Section I and Table A7 in the Supplementary Material.
IV. Robustness
We conduct a set of robustness tests to verify that our main conclusions are not driven by specific modeling choices. First, we employ an alternative method to evaluate a hedge fund’s exposure to green assets by calculating the value-weighted average carbon risk score using stock holdings information from hedge fund management firms, following Liang et al. (Reference Liang, Sun and Teo2022). Since the carbon risk score can only be calculated at the hedge fund management firm level, we assign the same carbon risk score to each fund within the same hedge fund management firm. We reproduce the main analyses using this holdings-based carbon risk score. We report the results in Table A8 in the Supplementary Material. The results are consistent with our main findings.
Second, we construct an alternative measure of hedge fund green beta by augmenting equation (1) with additional risk factors. To address concerns that the green factor is a proxy for firm profitability or firm investment policy, we add the profitability factor (RMW) and the investment factor (CMA) from the Fama–French (Reference Fama and French2015) 5-factor model. To mitigate concerns that a correlated omitted factor may bias our estimates of green betas, we also add the value factor (HML) and momentum factor (MOM) from Carhart’s (Reference Carhart1997) 4-factor model. We then modify equation (1) by adding these factors in various combinations to reestimate green beta and repeat our baseline analyses. We report the results in Tables A9 and A10 in the Supplementary Material (columns 1 to 10), and they remain consistent.
Third, we replace the 7-factor model of Fung and Hsieh (Reference Fung and Hsieh2004) with the new 9-factor model proposed by Chen, Li, Tang, and Zhou (Reference Chen, Li, Tang and Zhou2025), which they show has superior explanatory power for hedge fund returns.Footnote 32 We modify equation (1) by replacing the 7-factor controls with the 9-factor model to estimate a new green beta and repeat our baseline analyses. We report the results in Tables A9 and A10 in the Supplementary Material (columns 11 to 12), and they remain consistent with our baseline findings.
V. Conclusion
This study examines key aspects of green investing within the hedge fund industry. We develop a return-based metric, green beta, that captures how a fund’s returns covary with the green factor and allows us to measure green exposure at the individual fund level. We find that greener hedge funds deliver stronger performance on average. More importantly, we show that green exposure is associated with lower subsequent risk. Greener funds exhibit lower total volatility, systematic risk, idiosyncratic risk, and tail risk. These risk-mitigation and outperformance effects are especially pronounced during adverse periods, such as market downturns and climate-related stress states. Our findings add nuance to the conventional view that environmentally sustainable investing necessarily comes at the expense of financial performance. We show that skilled hedge fund managers can “do well by doing good,” as green investing is associated with both stronger performance and more resilient risk profiles.
We document that return and risk channels operate differently across investment strategies. Green beta is associated with superior overall fund outcomes, but the mechanisms differ by strategy: performance improvements are greatest among directional funds, whereas risk mitigation is most pronounced among nondirectional funds.
We further show that green hedge fund managers exhibit stronger green stock-picking and green factor-timing skills. The evidence suggests that these managers can process complex sustainability information to identify undervalued green stocks and capitalize on fluctuations in the green factor. We also examine investor responses and find that greener funds attract higher investor flows, especially in the post-2015 Paris Agreement period. However, this flow effect is concentrated among high-performing funds, suggesting that hedge fund investors value sustainability while remaining strongly performance-oriented.
Finally, we find that hedge funds increase their green exposure following climate news shocks. Investor flows toward green hedge funds also increase after these events. As views on carbon risk and climate policy continue to evolve, our study provides timely evidence on how hedge funds approach green investing. Our findings highlight hedge funds’ focus on risk and performance, ability to time green factor exposure, and skill in selecting green assets that generate value.
Supplementary Material
To view supplementary material for this article, please visit http://doi.org/10.1017/S0022109026103457.


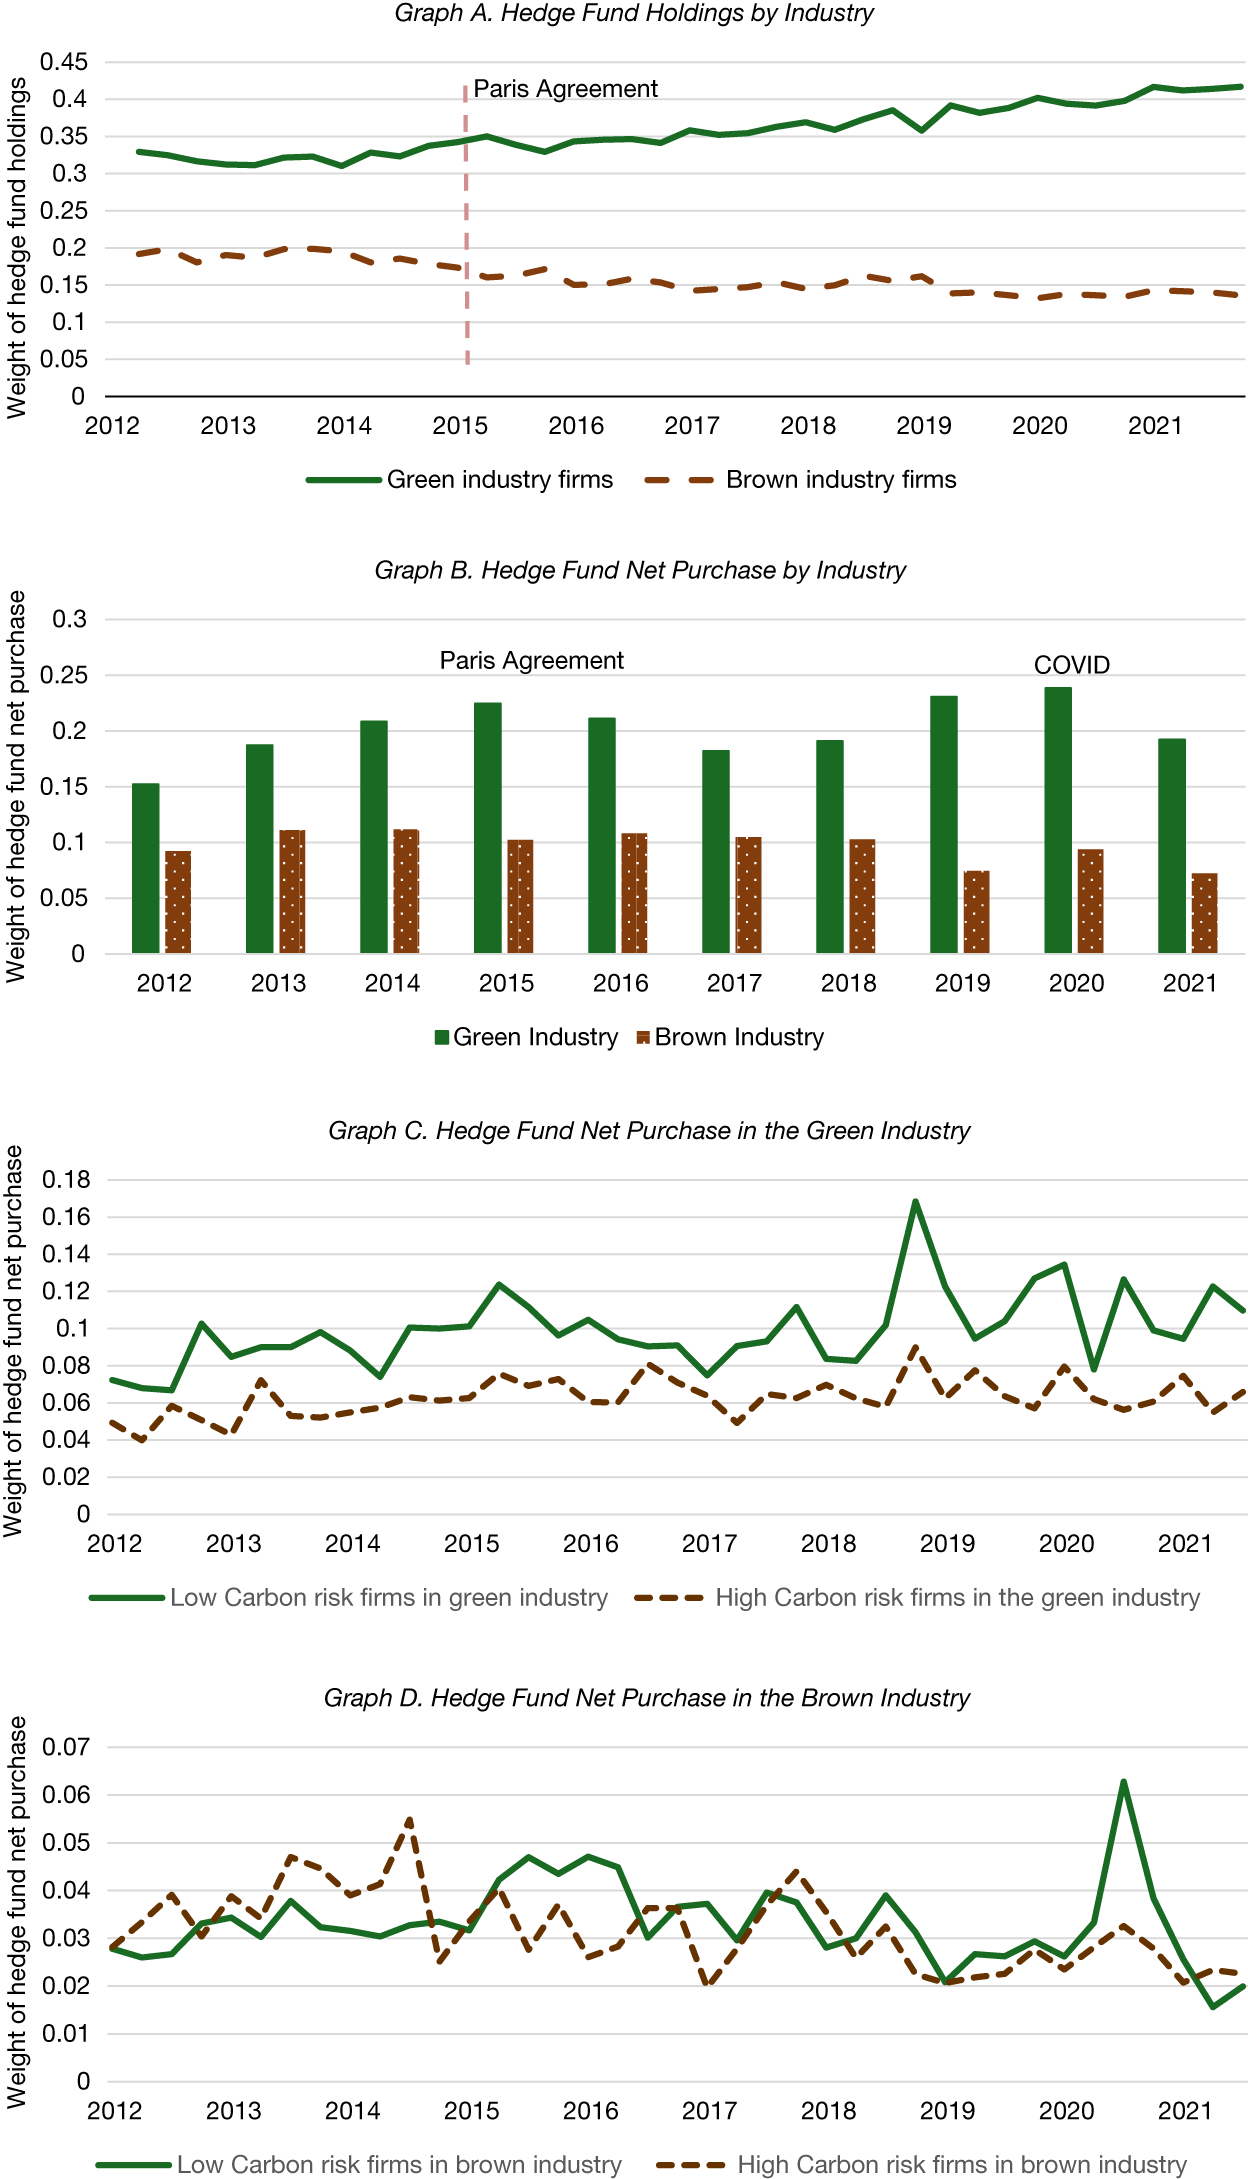


 Open access

