1. Introduction
When a drop impinges on the surface of a deep liquid, it either coalesces with the receiving liquid or splashes. In addition, impinging drops may also bounce off or float on the liquid surface. Near the transition from coalescence to splashing, different phenomena such as regular entrainment of gas bubbles along with thin high-speed jets and thick jets are found.
According to previous studies (Chapman & Critchlow Reference Chapman and Critchlow1967; Rodriguez & Mesler Reference Rodriguez and Mesler1988; Peck & Sigurdson Reference Peck and Sigurdson1994; Shankar & Kumar Reference Shankar and Kumar1995; Dooley et al. Reference Dooley, Warncke, Gharib and Tryggvason1997), coalescence is connected with the formation of a vortex ring that propagates into the receiving liquid. Immediately after the impact a crater is formed and the drop liquid spreads over its floor. Vorticity develops during crater formation and as the crater eventually recedes a vortex ring detaches from the crater. The surface of the receiving liquid quickly assumes its horizontal equilibrium position and is not otherwise disturbed. In particular, secondary droplets are not normally formed. Earlier investigators who dealt experimentally with coalescence mainly focused on the structure and evolution of the vortex ring (Rodriguez & Mesler Reference Rodriguez and Mesler1988; Peck & Sigurdson Reference Peck and Sigurdson1994; Dooley et al. Reference Dooley, Warncke, Gharib and Tryggvason1997). Chapman & Critchlow (Reference Chapman and Critchlow1967) concluded that maximum penetration was achieved for drops that were spherical on impact and oscillated from oblate to prolate so as to offset flattening of the drop by the impact. In contrast to Chapman & Critchlow (Reference Chapman and Critchlow1967), Rodriguez & Mesler (Reference Rodriguez and Mesler1988) reported that maximum penetration of a vortex ring occurred when the impacting drop was prolate at impact. Peck & Sigurdson (Reference Peck and Sigurdson1994) constructed a model of a three-dimensional vortex structure created by an impacting water drop for the range of Weber numbers of 22–25 and Froude numbers of 25–28. They investigated the structure and evolution of the vorticity. Shankar & Kumar (Reference Shankar and Kumar1995) suggested that it is the drop surface energy that generates the vortex ring. They measured the ring velocity and the diameter for a number of drop sizes and liquids.
In the case of splashing, a deep crater is produced in the receiving liquid after impact. At its rim a crown-like cylindrical liquid film is ejected out of the crater. Small droplets are normally shed from this film. Later, when the crater collapses, a liquid column rises out of its centre. The upper part of this central jet consists mainly of drop liquid. Instabilities usually cause the separation of one or more droplets from the tip of the jet. When a tip droplet later falls back into the liquid, it usually coalesces and a vortex ring is formed. At very high impact velocity, there is spray and crown formation (Engel Reference Engel1966, Reference Engel1967; Liow Reference Liow2001). The spray breaks to give numerous droplets and sometimes a large bubble becomes entrapped when the crown closes at the top. This generates an upward and inward jet, which entrains a bubble upon striking the water surface (Medwin et al. Reference Medwin, Nystuen, Jacobus, Ostwald and Snyder1992).
The study of underwater sound from the impact of rain on a water surface led to the study of bubble entrapment phenomena. Franz (Reference Franz1959) explained that the sound produced by drop impacts can be due to two different mechanisms. First, when the drop impacts the surface, a sharp pulse of sound is emitted, known as the ‘water hammer’ effect. Second, the bubbles that are entrained in the water oscillate, and this produces sound. Various measurements on rain water have been reported by Nystuen (Reference Nystuen1986) and Pumphrey, Crum & Bjørnø (Reference Pumphrey, Crum and Bjørnø1989). Pumphrey & Elmore (Reference Pumphrey and Elmore1990) described four different processes by which a bubble is entrapped when a water drop impacts the surface of deep water, namely irregular Franz-type entrainment, regular entrainment, large bubble entrainment and Mesler entrainment (Esmailizadeh & Mesler Reference Esmailizadeh and Mesler1986). A single bubble is formed during crater collapse in regular entrainment, whereas either a multitude of tiny bubbles (Mesler entrainment: Esmailizadeh & Mesler Reference Esmailizadeh and Mesler1986; Sigler & Mesler Reference Sigler and Mesler1989; Pumphrey & Elmore Reference Pumphrey and Elmore1990) or only a few individual bubbles (Thoroddsen, Etoh & Takehara Reference Thoroddsen, Etoh and Takehara2003; Thoroddsen et al. Reference Thoroddsen, Thoraval, Takehara and Etoh2012; Tuan et al. Reference Tuan, de Maleprade, Sun and Lohse2013) may be entrapped in the bulk fluid due to rupture of the thin air sheet remaining trapped between the contacting surfaces.
Experiments by Pumphrey and Crum (Elmore, Pumphrey & Crum Reference Elmore, Pumphrey and Crum1989; Prosperetti, Pumphrey & Crum Reference Prosperetti, Pumphrey and Crum1989; Pumphrey et al.
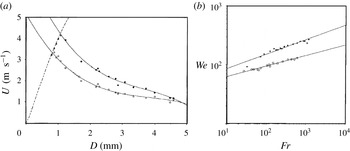
Reference Pumphrey, Crum and Bjørnø1989; Pumphrey & Elmore Reference Pumphrey and Elmore1990) showed that regular entrainment occurs only in a sharply delimited region of parameter space of drop diameter
 $D$
and impact velocity
 $U$
. In figure 1(a) the dashed line shows the terminal velocity of rain drops. To the right of this line a regular process of bubble entrainment takes place. This figure shows the original data of Pumphrey and Crum and two continuous lines obtained by a best fit to the data. Below the enclosed area the crater is too shallow to give rise to a bubble, while above it its energy is too large. Considering the drop to be spherical, Oguz & Prosperetti (Reference Oguz and Prosperetti1990, Reference Oguz and Prosperetti1991) replotted figure 1(a) in terms of
 $\mathit{Fr}$
and
 $\mathit{We}$
, where the upper bound is
 $\mathit{We}_{u}=48.3\mathit{Fr}^{0.247}$
and the lower bound is
 $\mathit{We}_{l}=41.3\mathit{Fr}^{0.179}$
. The Froude number
 $\mathit{Fr}$
and Weber number
 $\mathit{We}$
are defined by
 $\mathit{Fr}=U^{2}/gD$
and
 $\mathit{We}={\it\rho}U^{2}D/{\it\sigma}$
. Here,
 ${\it\sigma}$
is the surface tension,
 ${\it\rho}$
is the density of water and
 $g$
is the acceleration due to gravity. Oguz & Prosperetti (Reference Oguz and Prosperetti1990) argued that the upper limit was a balance between the even spread of the drop over the surface of a hemispherical cavity and a surface tension restoring force and obtained
 $\mathit{We}\sim \mathit{Fr}^{1/4}$
. They reasoned that the time to maximum growth of the crater scales proportionally to the drop diameter times the drop velocity to the third power, based on experimental observation by Pumphrey. Relating this to the time for a capillary wave formed at the bottom of the cavity to reverse its motion, they obtained the lower limit for bubble entrapment as
 $\mathit{We}\sim \mathit{Fr}^{1/5}$
. They for the first time studied numerically using the boundary-integral method the fluid dynamics of crater formation and regular bubble entrapment and tried to explain the physics behind it. They concluded that whether a bubble is entrapped or not depends on the balance between the times at which the outward motions of the crater walls become reversed at different positions.
(a) Regular entrainment domain defined by Elmore et al. (Reference Elmore, Pumphrey and Crum1989) in the drop diameter
 $D$
and impact velocity
 $U$
space. The two solid curves are cubic fits of the highest (solid circles) and lowest (open circles) impact velocities and the dashed line is the terminal velocity curve. (b) Oguz & Prosperetti (Reference Oguz and Prosperetti1990) plotted the two boundaries of the bubble region in terms of the Froude number and the Weber number.

Apart from the study of the underwater noise of rain, another group investigated the transition regimes between coalescing and splashing drops. By means of high-speed photography of normal impact of water drops on a plane water surface, the mechanisms of different flows were studied. It was shown that bubble entrapment is always accompanied by thin high-rising liquid jet formation. Although the boundaries of the region of regular bubble entrainment were determined by Pumphrey & Elmore (Reference Pumphrey and Elmore1990), the boundaries for jet formation were not determined until Rein (Reference Rein1996) showed experimentally the various transition regimes. He ordered different flows according to the Weber number, and distinguished coalescence from splashing by the presence of a vortex ring in the case of coalescence and a secondary droplet in the case of splashing, and the bubble entrapment zone was considered to be a special case of splashing. Morton, Rudman & Liow (Reference Morton, Rudman and Liow2000) performed both experimental and numerical investigations on a 2.9 mm water drop impacting on a deep water pool at velocities in the range
 $0.8{-}2.5~\text{m}~\text{s}^{-1}$
. They showed that during bubble entrapment and the growth of a thin high-speed jet, capillary waves exist. They established the criterion for bubble entrapment as capillary wave propagation down the walls of the crater at a speed greater than that of crater collapse to form a thick Rayleigh jet. The most notable observation was the presence of a vortex ring both during the coalescence regime and also during thick jet formation. The vortex ring was absent in the bubble entrapment regime.
Liow (Reference Liow2001) performed experiments with spherical water drops and obtained the transition flows between coalescence and the splashing regime, which differed from the observations of Rein (Reference Rein1996). He showed that a high-speed jet also occurs without bubble entrapment and he redefined the thin jet and bubble entrapment zones. The thin jet zone exists before and after the bubble entrapment zone. The lower limit for the formation of a thin high-speed jet coincided with the splash–vortex ring boundary given by Rodriguez & Mesler (Reference Rodriguez and Mesler1988) as
 $\mathit{We}=34.7\mathit{Fr}^{0.145}$
. Primary bubble entrapment occurs with the formation of a thin high-speed jet, and the lower limit for primary bubble entrapment was determined as
 $\mathit{We}=36.2\mathit{Fr}^{0.186}$
and the upper limit as
 $\mathit{We}=48.3\mathit{Fr}^{0.247}$
. The thin high-speed jet disappears at slightly higher
 $\mathit{We}$
, and the upper limit to the high-speed jet regime was determined as
 $\mathit{We}=54\mathit{Fr}^{0.25}$
.
Cole (Reference Cole2007) presented a comprehensive drop splash map using PIV and high-speed video techniques. He categorized the flow behaviour of liquid drop impact on a deep pool into six flow regimes. New flow behaviours such as microbubble formation from floating drops, pre-entrapment jetting, multiple primary bubble entrapment and downward jets penetrating the entrapped bubble were some of his observations. Most previous studies on bubble entrapment were made with the water–air system. Deng, Anilkumar & Wang (Reference Deng, Anilkumar and Wang2007) studied experimentally the effect of viscosity and surface tension on bubble entrapment phenomena by taking three different liquids: distilled water, silicone oil and glycerine–water mixture. They observed that the bubble entrapment results from interplay between capillary wave pinching of the impact crater and the viscous weakening of the wave, and the inviscid entrapment limits are shifted with change in viscosity. To take into account the damping effect due to viscosity, a new non-dimensional number, the capillary number (
 $\mathit{Ca}=({\it\mu}U)/{\it\sigma}$
, where
 ${\it\mu}$
is the viscosity), was introduced. They showed that there was no further bubble entrapment for
 $\mathit{Ca}>0.6$
.
In this work, we used a coupled level set and volume of fluid method (CLSVOF) to find the answers to the following questions. (a) Under what conditions do the thin jet and thick jet regimes occur? (b) How does the crater shape determine the jet characteristics? (c) What are the transition regimes from coalescence to splashing? (d) When do we see vortex ring formation? Three basic dimensionless numbers are used to describe the phenomena, the Froude number
 $\mathit{Fr}$
, the Weber number
 $\mathit{We}$
and the Reynolds number
 $\mathit{Re}$
, defined by
 $\mathit{Fr}=U^{2}/gD$
,
 $\mathit{We}={\it\rho}U^{2}D/{\it\sigma}$
and
 $\mathit{Re}={\it\rho}UD/{\it\mu}$
, where
 ${\it\mu}$
is the viscosity of water. In an air–water system, the viscosity is low so the controlling parameters are
 $\mathit{Fr}$
and
 $\mathit{We}$
. To take into account other liquid properties,
 $\mathit{Ca}$
is changed to obtain the regime map. The drop size ranges from 1 to 3 mm and the impact velocity ranges from 1 to
 $4~\text{m}~\text{s}^{-1}$
. Except in figure 7, for all other results the drop diameter is kept fixed at 3 mm. The value of
 $\mathit{Fr}$
is changed by changing the impact velocity. For a particular
 $\mathit{Fr}$
,
 $\mathit{We}$
is changed by changing the surface tension. We varied them in the ranges
 $\mathit{Fr}=25{-}600$
and
 $\mathit{We}=50{-}300$
. Thus, to relate the non-dimensional values with a specific liquid, our results represent an air–water system with constant drop size at different temperature and pressure.
The remainder of the paper is arranged as follows. The computational domain and numerical method are explained in § 2. In § 3, our results are validated with previous experimental results. The results of the transition from coalescence to the long jet regime are shown and discussed in § 4. Finally, we draw conclusions on the various aspects of the process in § 5.
2. Computational domain and numerical method
Complete numerical simulation of the processes is performed for incompressible flow which is described in axisymmetric coordinates. The computational domain used for this study has been described previously (Ray, Biswas & Sharma Reference Ray, Biswas and Sharma2010, Reference Ray, Biswas and Sharma2012), where a liquid drop impacts on a deep liquid pool. Here, the size of the domain is different. The computational domain is
 $7D\times 14D$
with the depth of water as
 $7.2D$
. This large domain is used to capture the crater, entrapped bubble, jet and secondary drop dynamics. The drop is placed at
 $0.02D$
from the flat interface, where
 $D$
is the initial drop diameter. The computational domain is discretized on a
 $350\times 700$
mesh and the time step is
 ${\rm\Delta}t=10^{-6}~\text{s}$
. At the initial stage, the pool surface is assumed to be flat and motionless. The drop is assumed to be spherical and travelling at impact velocity
 $U$
.
The mass and momentum conservation equations for incompressible Newtonian fluids for the liquid and air phases are given by
 $$\begin{eqnarray}\displaystyle & \boldsymbol{{\rm\nabla}}\boldsymbol{\cdot }\boldsymbol{V}=0, & \displaystyle\end{eqnarray}$$
 $$\begin{eqnarray}\displaystyle & \displaystyle {\it\rho}\left(\frac{\partial \boldsymbol{V}}{\partial t}+\boldsymbol{{\rm\nabla}}\boldsymbol{\cdot }\boldsymbol{V}\boldsymbol{V}\right)=-\boldsymbol{{\rm\nabla}}P+{\it\rho}\boldsymbol{g}+\boldsymbol{{\rm\nabla}}\boldsymbol{\cdot }[{\it\mu}(\boldsymbol{{\rm\nabla}}\boldsymbol{V}+(\boldsymbol{{\rm\nabla}}\boldsymbol{V})^{\text{T}})]+f_{sv}, & \displaystyle\end{eqnarray}$$
 $\boldsymbol{V}$
is the velocity vector,
 $P$
is the pressure and
 $f_{sv}$
is the surface tension force per unit volume.
At the interface, the modified momentum equation incorporating the surface tension force due to Brackbill, Kothe & Zemach (Reference Brackbill, Kothe and Zemach1992) becomes
 $$\begin{eqnarray}{\it\rho}\left(\frac{\partial \boldsymbol{V}}{\partial t}+\boldsymbol{{\rm\nabla}}\boldsymbol{\cdot }\boldsymbol{V}\boldsymbol{V}\right)=-\boldsymbol{{\rm\nabla}}P+{\it\rho}\boldsymbol{g}+\boldsymbol{{\rm\nabla}}\boldsymbol{\cdot }[{\it\mu}(\boldsymbol{{\rm\nabla}}\boldsymbol{V}+(\boldsymbol{{\rm\nabla}}\boldsymbol{V})^{\text{T}})]+{\it\sigma}{\it\kappa}\boldsymbol{n}{\it\delta}_{s},\end{eqnarray}$$
where
 ${\it\sigma}$
is the surface tension force,
 $\boldsymbol{n}$
is the unit normal vector at the interface,
 ${\it\kappa}$
is the mean curvature of the interface and
 ${\it\delta}_{s}$
is the interface delta function. Since there is no concentration or temperature gradient, the surface tension force is constant and therefore the tangential surface tension force is neglected.
The level-set function chosen here is maintained as the signed distance from the interface close to the interface. Hence, near the interface,
 $$\begin{eqnarray}{\it\phi}(\boldsymbol{r},t)\left\{\begin{array}{@{}l@{}}=-d~\text{in the gas region},\quad \\ =0~\text{at the interface},\quad \\ =+d~\text{in the liquid region},\quad \end{array}\right.\end{eqnarray}$$
where
 $d=d(\boldsymbol{r})$
is the shortest distance of the interface from point
 $\boldsymbol{r}$
. From such a representation of the interface, the unit normal vector
 $\boldsymbol{n}$
and the mean curvature
 ${\it\kappa}$
are simply
 $$\begin{eqnarray}\boldsymbol{n}=\frac{\boldsymbol{{\rm\nabla}}{\it\phi}}{|\boldsymbol{{\rm\nabla}}{\it\phi}|}\end{eqnarray}$$
and
 $$\begin{eqnarray}{\it\kappa}=-\boldsymbol{{\rm\nabla}}\boldsymbol{\cdot }\boldsymbol{n}=-\boldsymbol{{\rm\nabla}}\boldsymbol{\cdot }\frac{\boldsymbol{{\rm\nabla}}{\it\phi}}{|\boldsymbol{{\rm\nabla}}{\it\phi}|}.\end{eqnarray}$$
Using the level-set formulation due to Chang et al. (Reference Chang, Hou, Merriman and Osher1996), the momentum equation for incompressible two-phase flow becomes
 $$\begin{eqnarray}{\it\rho}({\it\phi})\left(\frac{\partial \boldsymbol{V}}{\partial t}+\boldsymbol{{\rm\nabla}}\boldsymbol{\cdot }\boldsymbol{V}\boldsymbol{V}\right)=-\boldsymbol{{\rm\nabla}}P+{\it\rho}({\it\phi})\boldsymbol{g}+\boldsymbol{{\rm\nabla}}\boldsymbol{\cdot }[{\it\mu}({\it\phi})(\boldsymbol{{\rm\nabla}}\boldsymbol{V}+(\boldsymbol{{\rm\nabla}}\boldsymbol{V})^{\text{T}})]+{\it\sigma}{\it\kappa}({\it\phi})\boldsymbol{{\rm\nabla}}\boldsymbol{H}({\it\phi}),\end{eqnarray}$$
and due to the motion of interface, the interface is captured by solving the advection for the level-set function
 ${\it\phi}$
and for the volume fraction
 $F$
in its conservative form,
 $$\begin{eqnarray}\displaystyle & \displaystyle \frac{\partial {\it\phi}}{\partial t}+\boldsymbol{{\rm\nabla}}\boldsymbol{\cdot }(\boldsymbol{V}{\it\phi})=0, & \displaystyle\end{eqnarray}$$
 $$\begin{eqnarray}\displaystyle & \displaystyle \frac{\partial F}{\partial t}+\boldsymbol{{\rm\nabla}}\boldsymbol{\cdot }(\boldsymbol{V}F)=0. & \displaystyle\end{eqnarray}$$
The void fraction
 $F$
is introduced as the fraction of the liquid inside a control volume (cell), where the void fraction takes the value 0 for a gas (air) cell indicated by fluid 2 and 1 for a liquid (water or other liquid) cell indicated by fluid 1. Values between 0 and 1 indicate a two-phase cell.
The density and viscosity are derived from the level-set function as
 $$\begin{eqnarray}\displaystyle & {\it\rho}({\it\phi})={\it\rho}_{1}H({\it\phi})+{\it\rho}_{2}(1-H({\it\phi})), & \displaystyle\end{eqnarray}$$
 $$\begin{eqnarray}\displaystyle & {\it\mu}({\it\phi})={\it\mu}_{1}H({\it\phi})+{\it\mu}_{2}(1-H({\it\phi})), & \displaystyle\end{eqnarray}$$
 $H({\it\phi})$
is the Heaviside function,
 $$\begin{eqnarray}H({\it\phi})=\left\{\begin{array}{@{}ll@{}}1,\quad & \text{if}~{\it\phi}>{\it\epsilon},\\ \displaystyle \frac{1}{2}+\frac{{\it\phi}}{2{\it\epsilon}}+\frac{1}{2{\rm\pi}}\left\{\sin \left(\frac{{\rm\pi}{\it\phi}}{{\it\epsilon}}\right)\right\},\quad & \text{if}~|{\it\phi}|\leqslant {\it\epsilon},\\ 0,\quad & \text{if}~{\it\phi}<-{\it\epsilon},\end{array}\right.\end{eqnarray}$$
where
 ${\it\epsilon}$
is the interface numerical thickness.
The boundary conditions are symmetry or free-slip conditions at the left and right boundaries. Outflow boundary conditions are used on the top surface of the domain and no-slip and impermeability (wall) conditions are used on the bottom surface of the domain.
The governing equations and the boundary conditions are cast in dimensionless form using the following dimensionless variables:
 $z^{\ast }=z/D$
,
 $r^{\ast }=r/D$
,
 $\boldsymbol{V}^{\ast }=\boldsymbol{V}/U$
,
 $t^{\ast }=t/(D/U)$
,
 ${\it\rho}^{\ast }={\it\rho}/{\it\rho}_{w}$
,
 ${\it\mu}^{\ast }={\it\mu}/{\it\mu}_{w}$
,
 $P^{\ast }=P/({\it\rho}_{w}U^{2})$
,
 ${\it\kappa}^{\ast }={\it\kappa}/D^{-1}$
;
 $$\begin{eqnarray}\displaystyle \boldsymbol{{\rm\nabla}}\boldsymbol{\cdot }\boldsymbol{V}^{\ast }=0, & & \displaystyle\end{eqnarray}$$
 $$\begin{eqnarray}\displaystyle {\it\rho}^{\ast }\left(\frac{\partial \boldsymbol{V}^{\ast }}{\partial t}+\boldsymbol{{\rm\nabla}}\boldsymbol{\cdot }\boldsymbol{V}^{\ast }\boldsymbol{V}^{\ast }\right) & = & \displaystyle -\boldsymbol{{\rm\nabla}}P^{\ast }+{\it\rho}^{\ast }\frac{1}{\mathit{Fr}}+\frac{1}{\mathit{Re}}\boldsymbol{{\rm\nabla}}\boldsymbol{\cdot }[{\it\mu}^{\ast }(\boldsymbol{{\rm\nabla}}\boldsymbol{V}^{\ast }+(\boldsymbol{{\rm\nabla}}\boldsymbol{V}^{\ast })^{\text{T}})]\nonumber\\ \displaystyle & & \displaystyle +\,\frac{1}{We}{\it\kappa}^{\ast }\boldsymbol{{\rm\nabla}}H({\it\phi}).\end{eqnarray}$$
The Froude number,
 $\mathit{Fr}=U^{2}/gD$
, measures the importance of inertial forces relative to gravitational forces; the Reynolds number,
 $\mathit{Re}={\it\rho}UD/{\it\mu}$
, measures the importance of inertial forces relative to viscous forces and the Weber number,
 $\mathit{We}={\it\rho}U^{2}D/{\it\sigma}$
, measures the importance of inertial forces relative to surface tension forces. The solution algorithm has been described in earlier papers (Ray et al.
Reference Ray, Biswas and Sharma2010, Reference Ray, Biswas and Sharma2012).
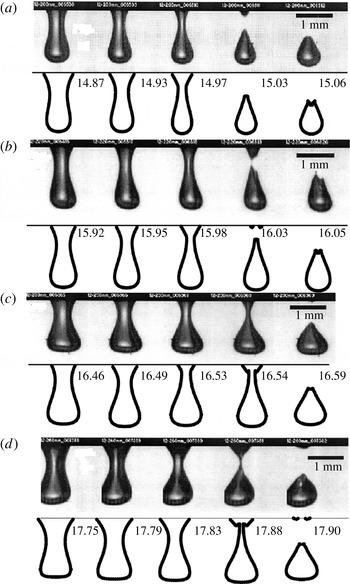
Validation of our numerical approach with the experiments of Cole (Reference Cole2007). A 2.13 mm water drop impacts on a deep water pool at velocities of (a)
 $2.16~\text{m}~\text{s}^{-1}$
, (b)
 $2.23~\text{m}~\text{s}^{-1}$
, (c)
 $2.28~\text{m}~\text{s}^{-1}$
and (d)
 $2.38~\text{m}~\text{s}^{-1}$
.

Capture of the necking and drop/bubble detachment using CLSVOF depends on (a) the time step, (b) the spatial resolution and (c) the interface numerical thickness. In this paper, the results are compared with experimental results within the limits of our numerical mesh, i.e. time step of
 $1~{\rm\mu}\text{s}$
and spatial resolution of
 $100~{\rm\mu}\text{m}/\text{grid}$
. The interface numerical thickness for the simulation is taken as
 $0.5{\rm\Delta}r$
(
 ${\rm\Delta}r$
refers to the size of a mesh cell).
3. Qualitative and quantitative validation
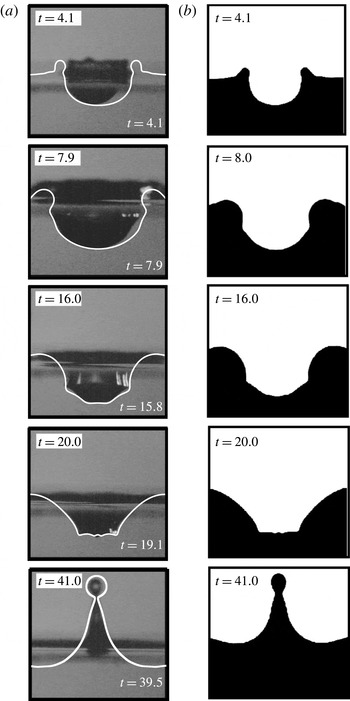
To validate our numerical approach, we compared our results with the work of Morton et al. (Reference Morton, Rudman and Liow2000) and Cole (Reference Cole2007). To see the efficiency and validation of the numerical scheme, we validated the bubble entrapment phenomenon of Cole (Reference Cole2007) and the thick jet phenomenon of Morton et al. (Reference Morton, Rudman and Liow2000). Morton et al. (Reference Morton, Rudman and Liow2000) performed both experiments and numerical simulations of the bubble entrapment and the thick jet phenomena. Experiments were carried out by impacting a 2.9 mm water drop in a deep water pool from heights of 170 and 400 mm.
Qualitative validation of our numerical approach (white solid line) with the experimental results (a) and numerical simulations (b) of Morton et al. (Reference Morton, Rudman and Liow2000). A 2.9 mm water drop is impacting from a height of 170 mm (
 $\mathit{Fr}=85$
,
 $\mathit{We}=96$
).

The phenomenon of bubble entrapment was validated with the experiments of Morton et al. (Reference Morton, Rudman and Liow2000) in our earlier paper (Ray et al.
Reference Ray, Biswas and Sharma2012). In figure 2, validations with the experiments of Cole (Reference Cole2007) indicate the capture of the bubble shape during entrapment. The gradual change from a round to a flat crater base with increase in impact velocity is well captured through our simulations. In their numerical simulation, Morton et al. (Reference Morton, Rudman and Liow2000) used the volume of fluid (VOF) method to obtain the interface profiles, and their results matched very well with the experiments. For drop impact from a height of 400 mm, a Rayleigh jet was projected upwards and there was no bubble entrapment. We compared our numerical simulations for this phenomenon with satisfactory results, as shown in figure 3. The predicted diameter of the secondary drop from our simulation is nearly
 $0.84D$
, which compares well with the diameter measured from the numerical results
 $({\approx}0.85D)$
and digitized movie images
 $({\approx}0.80D)$
of Morton et al. (Reference Morton, Rudman and Liow2000).
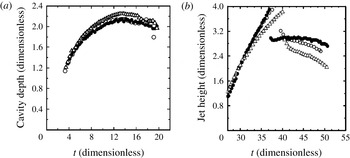
Quantitative validation was performed by plotting the crater depth and jet height relative to the initial pool height versus time (figure 4). The length is scaled by the initial drop diameter
 $D$
and the time is scaled by
 $D/U$
, where
 $U$
is the drop impact velocity (this scaling is followed in the rest of the paper). The experimental results of Morton et al. (Reference Morton, Rudman and Liow2000) are denoted by the filled circles and their numerical results are represented by the open triangular symbols. As mentioned by Morton et al. (Reference Morton, Rudman and Liow2000), the differences in their data are within the experimental uncertainty. Our numerical results match well with their experimental results. The cavity depth follows an exactly similar trend to the experiments until
 $t=18$
, during crater base retraction, where our numerical results show more deformation. In Morton et al. (Reference Morton, Rudman and Liow2000), the results for the initial jet heights were in good agreement but at later times the experimental jet height grew faster than the numerical values, resulting in the experimental jet experiencing drop detachment at a dimensionless time earlier than the numerical result. The numerical jet also contracted more slowly than the experimental jet after drop detachment. Our numerical results show a good match with the experiment until drop detachment. The contraction of the jet is slower than the experimental data but far more satisfactory than the numerical results of Morton et al. (Reference Morton, Rudman and Liow2000).
Quantitative validation of our numerical approach (open circles) with the experimental results (filled circles) and numerical simulations (open triangles) of Morton et al. (Reference Morton, Rudman and Liow2000) showing crater depth for a 2.9 mm water drop impacting from a height of 170 mm (
 $\mathit{Fr}=85$
,
 $\mathit{We}=96$
,
 $\mathit{Re}=4575$
).

4. Results and discussion
In this section, we describe the different phenomena obtained at varying Weber numbers and Froude numbers from coalescence to the splashing regime in an air–water system.
(a) Coalescence phenomenon (P1) at
 $\mathit{Fr}=100$
,
 $\mathit{We}=50$
,
 $\mathit{Re}=2635$
,
 $\mathit{Bo}=0.5$
, where
 $\mathit{Bo}={\it\rho}gD^{2}/{\it\sigma}$
. (b) Short thick jet phenomenon (P2) at
 $\mathit{Fr}=300$
,
 $\mathit{We}=100$
,
 $\mathit{Re}=3373$
,
 $\mathit{Bo}=0.33$
. (c) Thick jet phenomenon with secondary drop (P3) below the bubble entrapment regime at
 $\mathit{Fr}=300$
,
 $\mathit{We}=110$
,
 $\mathit{Re}=3639$
,
 $\mathit{Bo}=0.36$
. (d) Thin jet phenomenon (P4) at
 $\mathit{Fr}=300$
,
 $\mathit{We}=120$
,
 $\mathit{Re}=3867$
,
 $\mathit{Bo}=0.4$
. (e) Thin jet phenomenon with large bubble entrapment (P5) at
 $\mathit{Fr}=300$
,
 $\mathit{We}=150$
,
 $\mathit{Re}=4565$
,
 $\mathit{Bo}=0.5$
. (f) Long thick jet phenomenon with small bubble entrapment (P6) at
 $\mathit{Fr}=300$
,
 $\mathit{We}=180$
,
 $\mathit{Re}=5250$
,
 $\mathit{Bo}=0.6$
. (g) Long thick jet phenomenon (P7) at
 $\mathit{Fr}=300$
,
 $\mathit{We}=190$
,
 $\mathit{Re}=5448$
,
 $\mathit{Bo}=0.63$
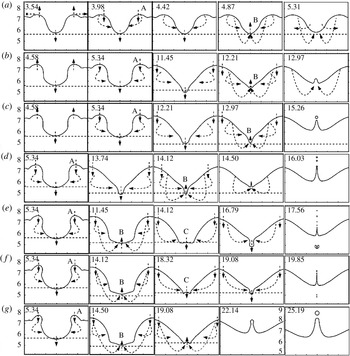
. The arrows indicate expansion and retraction stages during the phenomena.

4.1. Transition from coalescence to long jet
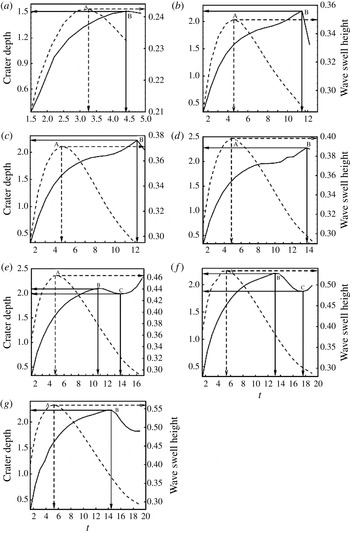
The different phenomena that are observed when a drop impacts a liquid pool are: the coalescence phenomenon (P1), the short thick jet phenomenon (P2), the short thick jet phenomenon with a secondary drop (P3), the thin jet phenomenon (P4), the thin jet phenomenon with large bubble entrapment (P5), the long thick jet phenomenon with small bubble entrapment (P6) and the long thick jet phenomenon (P7). Three basic stages are seen for all these phenomena: (i) crater and wave swell (rim of the crater) expansion, (ii) wave swell retraction leading to crater side retraction and (iii) crater base retraction. For all the phenomena, the maximum wave swell height A and maximum crater depth B are shown in figures 5 and 6. The wave swell retraction time, the crater retraction time and maximum crater depth do not vary much for any of these phenomena, although the wave swell height increases with the impact velocity. The horizontal dashed line indicates the change in crater depth with respect to depth in the previous time step. The other dashed lines indicate the flow pattern during the expansion and retraction stages.
Crater depth and wave swell height during (a) the coalescence phenomenon (P1), (b) the short thick jet phenomenon (P2), (c) the thick jet phenomenon with a secondary drop (P3), (d) the thin jet phenomenon (P4), (e) the thin jet phenomenon with large bubble entrapment (P5), (f) the long thick jet phenomenon with small bubble entrapment (P6) and (g) the long thick jet phenomenon (P7).

In the case of the coalescence phenomenon (P1) at low impact velocities, the process begins with slow dissolution of the drop liquid into the liquid pool. The surface of the receiving liquid quickly assumes its horizontal equilibrium position and no secondary droplets are formed. A wave swell is created which gradually rises to a maximum height denoted by A (figures 5
a and 6
a) and moves radially away from the centre. This is the expansion stage where the drop liquid flows horizontally outwards and vertically downwards. Retraction begins at the wave swell at
 $t=3.98$
and the matrix liquid pushes the crater sidewalls (denoted by the dashed lines pointed towards the crater sidewall). The crater obtains the maximum depth denoted by B (figures 5
a and 6
a). At
 $t=4.87$
, retraction at the crater base starts with the liquid from the wave swell converging at the crater base centre (denoted by the dashed lines pointed towards the crater base). At this instant, a vortex ring is formed at the crater base which detaches and moves below, which is discussed by many researchers as the characteristic of a coalescence event. This will be further studied in § 4.6. During coalescence, after drop impact the force is more towards the crater centre than the crater sidewalls. This leads to a nearly cone-shaped structure during the entire coalescence period. It is observed in figure 5(a) that at
 $t=5.31$
the crater sidewall expands faster than the crater base retraction, which makes the surface return to its initial profile quickly.
As the impact velocity is gradually increased, the jet regime is approached. In the short thick jet phenomenon (P2), the short thick jet phenomenon with a secondary drop (P3) and the thin jet phenomenon (P4), more vertical downward velocity is exerted along the entire crater area. Initially the crater attains a U-shaped structure with vertical crater sidewalls (figure 5 b–d). Maximum wave swell is reached and, after this stage, the liquid from the wave swell pushes back the crater sidewalls. Unlike the coalescence case where the crater depth retraction starts very soon after wave swell retraction, in the jet regime the retraction of the crater sidewall begins (A) but the crater depth continues to increase for a longer time, indicated by B. Due to the converging flow during retraction, the crater attains a flat and then a sharp pointed V-shaped structure, leading to a high-pressure zone at the crater base (discussed in § 4.5). Just below the V-shape, a stagnation point is developed, and thus as soon as the crater collapses, a jet is ejected vertically upwards.
The short thick jet-like phenomena (P2) in figures 5(b) and 6(b) were first experimentally observed by Rein (Reference Rein1996), where the thickness of the jet and the maximum height were comparable with the diameter of the impinging drop and not long enough to detach a tip droplet, and later when the central jet became smaller its diameter increased strongly at the foot of the jet.
The short thick jet phenomenon with secondary drop (P3) formation proceeds in a similar manner to that above, as shown in figures 5(c) and 6(c). Here, the jet thickness decreases and the jet speed and height increase (discussed in § 4.4). After attaining a certain height, instability grows in the jet and a secondary drop is pinched off from the tip of the jet. Mostly, a single secondary drop is ejected. The secondary drop diameter is nearly 0.2–0.3 times the initial drop diameter.
Liow (Reference Liow2001) showed that the thin jet phenomenon (P4) is observed before and even after the bubble entrapment regime and described the bubble entrapment regime as a subset of the thin jet regime. In our simulations as well, a thin jet phenomenon is seen before and during the bubble entrapment phenomenon (figures 5 d–f and 6 d–f), but after the bubble entrapment regime, the thick jet regime is observed. Due to the reduced jet diameter, the instability leads to breakup of the jet into numerous droplets much smaller than seen in P3.
On increasing the Weber number further the crater shape becomes more hemispherical during crater expansion in the thin jet phenomenon with large bubble entrapment (P5), the long thick jet phenomenon with small bubble entrapment (P6) and the long thick jet phenomenon (P7). The maximum wave swell height is denoted by A in figures 5(e) and 6(e). Initially, the retraction is at the crater sidewall and at B the crater base retraction also begins. The crater base retraction begins faster than in the previous cases (P2, P3 and P4) and the shape of the crater converts to a flat V-shape. Flow from the wave swell pushes the crater sidewall and also the crater base. This continues until
 $t=13.74$
, after which there is re-expansion of the crater base and the crater depth again increases at C. Due to continuous sidewall retraction during this expansion–contraction–re-expansion cycle of the crater base, a small sub-crater is formed and subsequently the sub-crater detaches a bubble. Here, the crater depth decreases during crater base retraction, and again increases until bubble pinching and jet ejection occur simultaneously.
The long thick jet phenomenon with small bubble entrapment (P6) was discussed in detail by Ray et al. (Reference Ray, Biswas and Sharma2012). The crater base re-expansion begins more slowly than P5 (marked C) and the depth before re-expansion is smaller. This re-expansion continues for less time before the pinch-off, leading to smaller bubbles. After the crater collapse, a thin jet is ejected, breaking into numerous small secondary drops. Instead of collapsing, the jet continues to grow and gradually the jet radius thickens. Finally, a thick jet of nearly five times the initial drop diameter is formed, which breaks into a few large secondary drops. The bubble entrapment phenomenon is observed within a small range of Weber and Froude numbers, as shown later in figure 7.
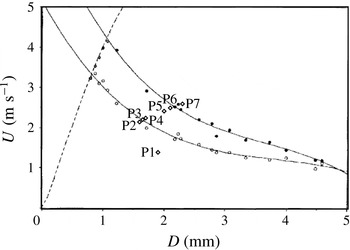
Locations P1–P7 in the regular entrainment domain defined by Elmore et al. (Reference Elmore, Pumphrey and Crum1989). The two solid curves are cubic fits of the highest (solid circles) and lowest (open circles) impact velocities and the dashed line is the terminal velocity curve.

The long thick jet phenomenon (P7) resembles the small bubble entrapment phenomenon until the crater is W-shaped (
 $t=18.32$
in figure 5
f and
 $t=19.08$
in figure 5
g). Due to the greater inertia force, during the crater retraction stage, the velocity from the wave swell is higher. Hence, the crater base is pushed upwards to a W-shaped structure unlike the V-shape. At this stage, instead of re-expansion the crater retraction continues and finally a thick jet is ejected upwards. Small secondary drops are not formed here since the jet radius is larger. The jet grows to a large height and a few large secondary drops of radius as large as half of the initial drop diameter are pinched out. Such profiles also occurred during the small bubble entrapment, where due to the pressure increase after bubble pinch-off the first jet to be ejected was of high speed and thin.
In all the above phenomena, the wave swell retraction begins at the same time,
 $t=5.34$
, except for the coalescence phenomena where it retracts at
 $t=3.98$
. The time gap between wave swell and crater base retraction also shows that other than coalescence where the gap is 0.89, all other phenomena take nearly the same time: P2, 6.87; P3, 7.63; P4, 8.78; P5, 6.11; P6, 8.78; P7, 9.16.
4.2. Regime map coalescence to a long jet
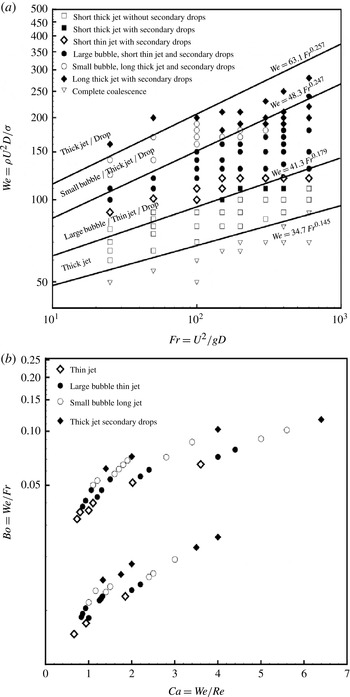
The above phenomena (P1–P7) are shown in the drop diameter versus impact velocity diagram of Elmore et al. (Reference Elmore, Pumphrey and Crum1989) (figure 7). The large bubble entrapment (P5) and the small bubble entrapment (P6) are within the entrapment domain. The small thick jet with secondary drop (P3) and thin jet phenomenon (P4) are seen to be above the lower limit of the entrapment regime. This can be addressed as the pre-entrapment regime and the long thick jet phenomenon (P7) as the post-entrapment regime. In our simulations, by varying
 $\mathit{We}$
and
 $\mathit{Fr}$
and keeping
 $\mathit{Re}$
of the order of
 $10^{3}$
, different phenomena are observed, as marked on the
 $\mathit{We}{-}\mathit{Fr}$
map in figure 8(a). The transition from complete coalescence to the small thick jet zone is identical to the coalescence–thin jet limit given by Rodriguez & Mesler (Reference Rodriguez and Mesler1988),
 $\mathit{We}=34.7\mathit{Fr}^{0.145}$
. The lower limit for the large bubble entrapment zone proposed by Oguz & Prosperetti (Reference Oguz and Prosperetti1990),
 $\mathit{We}=41.3\mathit{Fr}^{0.179}$
, does not cover much of our simulation data as for low
 $\mathit{We}$
the bubble size is small and our grid resolution may not be sufficient to capture them. The proposed upper limit
 $\mathit{We}=48.3\mathit{Fr}^{0.247}$
matches well with our results. At low
 $\mathit{Fr}$
and low
 $\mathit{We}$
, the short thick jet and the thin high-speed jet phenomena are seen within the large bubble limit. For higher
 $\mathit{We}$
and also for high
 $\mathit{Fr}$
the long thick jet phenomenon dominates. For values of
 $\mathit{Fr}<400$
, as
 $\mathit{We}$
is increased small bubble entrapment with a long thick jet is seen. By best fitting, the upper limit to the small bubble entrapment is determined as
 $\mathit{We}=63.1\mathit{Fr}^{0.257}$
. Further discussion on this large and small bubble entrapment can be found in Ray et al. (Reference Ray, Biswas and Sharma2012). For higher
 $\mathit{Fr}$
, when
 $\mathit{We}$
is increased the small bubble entrapment phenomenon dose not occur; instead the large bubble entrapment is followed by the long thick jet where bubble formation has completely ceased. For high
 $\mathit{Re}$
, the results are shown in a
 $\mathit{Bo}=\mathit{We}/\mathit{Fr}$
versus
 $\mathit{Ca}=\mathit{We}/\mathit{Re}$
map (figure 8
b). The transition from the thin jet to the long thick jet regime is observed with increasing
 $\mathit{Ca}$
. The different regimes obtained in experiments (Rein Reference Rein1996; Liow Reference Liow2001) are different from our results since in our simulations we assumed the initial drop to be spherical. Liow (Reference Liow2001) observed that prolate drops did not entrap bubbles whereas oblate drops did and the lower (
 $\mathit{We}=36.2\mathit{Fr}^{0.186}$
) and upper limits (
 $\mathit{We}=48.3\mathit{Fr}^{0.247}$
) to different regimes were obtained using all the data.
The regime map in (a)
 $\mathit{We}{-}\mathit{Fr}$
parameters at
 $\mathit{Re}=O(10^{3})$
. From bottom to top the solid lines are the coalescence–thin jet limit given by Rodriguez & Mesler (Reference Rodriguez and Mesler1988),
 $\mathit{We}=34.7\mathit{Fr}^{0.145}$
, the lower and upper limits for the large bubble entrapment zone as proposed by Oguz & Prosperetti (Reference Oguz and Prosperetti1990),
 $\mathit{We}=41.3\mathit{Fr}^{0.179}$
and
 $\mathit{We}=48.3\mathit{Fr}^{0.247}$
respectively, and the best fit to the small bubble entrapment data determined as
 $\mathit{We}=63.1\mathit{Fr}^{0.257}$
. (b) The
 $\mathit{Bo}$
–
 $\mathit{Ca}$
parameters.

4.3. Crater characteristics
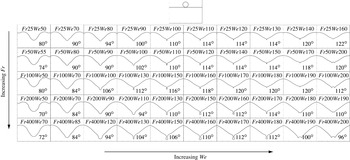
The crater shape just before collapse with increasing Weber number and Froude number is shown in figure 9. The competition between the crater sidewall and crater base retraction determines the shape of the crater before collapse. With increasing Weber number, the shape of the crater changes from a V-shape with a round base, to a V-shape with a sharp pointed base, to a V-shape with a sub-crater and to a W-shape. The crater width and wave swell angle increase as
 $\mathit{We}$
increases. Bubble entrapment phenomena occur for wave swell angles ranging from
 $100^{\circ }$
to
 $120^{\circ }$
, more for small bubbles with a long thick jet. According to the solution of Longuet-Higgins (Reference Longuet-Higgins1990), at this stage the crater can be approximated by a cone, in close agreement with an exact potential-flow solution, and the aperture of the cone decreases to a critical value of
 $109^{\circ }$
, at which point a singularity is developed.
Crater shapes before crater collapse with increasing Weber and Froude numbers. The wave swell angles are shown.

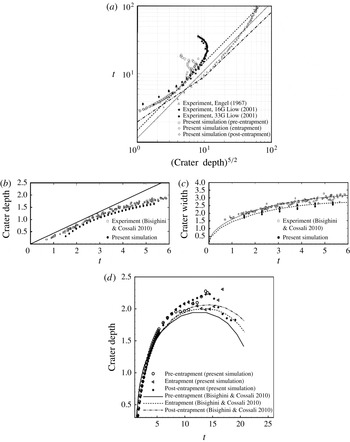
(a) Crater depth with time. The solid line is a least-squares fit to the data of Engel (Reference Engel1967), the dashed line is a least-squares fit to the present simulated results and the dashed–dotted line is the theoretical prediction of Berberovic et al. (Reference Berberovic, van Hinsberg, Jakirlic, Roisman and Tropea2009). (b) Experimental (Bisighini & Cossali Reference Bisighini and Cossali2010) and simulated crater depth at the initial stage of drop impact. The solid line is the theoretical curve
 $0.44\times \text{time}$
. (c) Experimental (Bisighini & Cossali Reference Bisighini and Cossali2010) and simulated crater width at the initial stage of drop impact. The solid line is the least-mean-squares fit for the experimental data and the dashed line is the least-mean-squares fit for the present simulated data. (d) Crater depth with time in comparison with the theoretical prediction of Bisighini & Cossali (Reference Bisighini and Cossali2010).

The crater growth with time has been estimated analytically considering a spherical crater in potential flow by Engel (Reference Engel1966, Reference Engel1967), Liow (Reference Liow2001), Berberovic et al. (Reference Berberovic, van Hinsberg, Jakirlic, Roisman and Tropea2009) and Bisighini & Cossali (Reference Bisighini and Cossali2010). Engel (Reference Engel1967) derived the crater depth when a cylindrical wave was produced by impact of a water drop on water. For high-speed impact of water drops, the gravity potential energy (of the crater, the wave swell above the surface and the generated surface), kinetic energy (in the liquid around the cavity and in the cylindrical wave) and dissipated energy were equated with half of the energy of the impinging drop to derive an equation for
 $\text{d}R/\text{d}t$
(
 $R$
is the crater depth or crater radius). Liow (Reference Liow2001) used the drop impact as the source and by a similar approach obtained the kinetic energy of the cavity:
 $$\begin{eqnarray}E_{k}=-({\it\rho}/2)\iint {\it\phi}\frac{\partial {\it\phi}}{\partial r}\text{d}S={\rm\pi}{\it\rho}R^{3}\left(\frac{\text{d}R}{\text{d}t}\right)^{2},\end{eqnarray}$$
where
 ${\it\phi}=(R^{2}/r)\text{d}R/\text{d}t$
is the velocity potential,
 ${\it\rho}$
is the density of the liquid and
 $S$
is the surface element. He argued that for large Froude number phenomena the kinetic energy does not change much in the early stage of cavity formation, and therefore for constant kinetic energy the relation
 $t\propto R^{5/2}$
was derived. In figure 10(a), the data from Engel (Reference Engel1967) (
 $\mathit{Fr}=6950,\mathit{We}=19\,360$
) and Liow (Reference Liow2001) (
 $16G-\mathit{Fr}=387$
,
 $\mathit{We}=756$
and
 $33G-\mathit{Fr}=600,\mathit{We}=368$
) are shown along with our simulated data (
 $\mathit{Fr}=300$
,
 $\mathit{We}=120$
– pre-entrapment, 150 – entrapment and 190 – post-entrapment). The data of Engel (Reference Engel1967) are least-squares fitted with
 $t=1.14(\text{crater}\;\text{depth})^{5/2}$
and the present simulated data are fitted with
 $t=1.5(\text{crater}\;\text{depth})^{5/2}$
. Our data show good agreement with the data of Liow (Reference Liow2001) during the expansion stage of the crater, and during the initial and final stages the results do not follow the power law. The basic approach used was the energy balance approach based on the assumption that the cavity expands equally in all directions. Berberovic et al. (Reference Berberovic, van Hinsberg, Jakirlic, Roisman and Tropea2009) developed a theoretical model based on linear momentum balance of the liquid around the crater at high
 $\mathit{We}$
and
 $\mathit{Fr}$
and gave the asymptotic equation as
 $R=t^{-4/5}(5t-6)^{2/5}$
or
 $t=(4/5)R^{5/2}+(6/5)$
for
 $t>2$
. The dashed–dotted line in figure 10(a) shows that during the initial stage of crater formation there is good agreement of the above theory with the experimental data of Liow (Reference Liow2001) and our numerical data. The influence of gravity, viscosity and surface tension is not taken into account in the theory and so for later stages the prediction is incorrect, while it can predict fairly accurate results for the experimental data of Engel (Reference Engel1967) at high
 $\mathit{We}$
and
 $\mathit{Fr}$
. The disadvantage of this model is the approximation of the cavity shape by an expanding sphere with the centre fixed at the impact point, since gravity effects influence the phenomena. Bisighini & Cossali (Reference Bisighini and Cossali2010) accounted for inertia, gravity and surface tension to obtain the theoretical model. They obtained a system of ordinary differential equations which is solved numerically using the initial conditions
 $$\begin{eqnarray}\displaystyle & \displaystyle \ddot{{\it\alpha}}=-\frac{3}{2}\frac{\dot{{\it\alpha}}^{2}}{{\it\alpha}}-\frac{2}{{\it\alpha}^{2}\mathit{We}}-\frac{1}{\mathit{Fr}}\frac{{\it\zeta}}{{\it\alpha}}+\frac{7}{4}\frac{\dot{{\it\zeta}}^{2}}{{\it\alpha}}-\frac{4\dot{{\it\alpha}}}{{\it\alpha}^{2}\mathit{Re}}, & \displaystyle\end{eqnarray}$$
 $$\begin{eqnarray}\displaystyle & \displaystyle \ddot{{\it\zeta}}=-3\frac{\dot{{\it\alpha}}\dot{{\it\zeta}}}{{\it\alpha}}-\frac{9}{2}\frac{\dot{{\it\zeta}}^{2}}{{\it\alpha}}-\frac{2}{Fr}-\frac{12\dot{{\it\zeta}}}{{\it\alpha}^{2}\mathit{Re}}, & \displaystyle\end{eqnarray}$$
 ${\it\alpha}$
and
 ${\it\zeta}$
denote the crater radius and the axial coordinate of the centre of the sphere; thus the crater depth
 $R={\it\alpha}+{\it\zeta}$
. The initial conditions were obtained at initial stages from the quasi-stationary model of initial drop penetration as
 $\dot{{\it\alpha}}\approx 0.17$
,
 ${\it\alpha}\approx {\it\alpha}_{0}+0.17t$
,
 $\dot{{\it\zeta}}\approx 0.27$
,
 ${\it\zeta}\approx -{\it\alpha}_{0}+0.27t$
. In figure 10(b), the simulated crater depth during the initial stage is fairly close to the experimental data and the theoretical prediction of
 $\text{crater depth}=0.44\times \text{time}$
. As mentioned by Bisighini & Cossali (Reference Bisighini and Cossali2010), the value of the crater width can be obtained by fitting the experimental data with the theoretical value of the crater width,
 $2\sqrt{{\it\alpha}^{2}-{\it\zeta}^{2}}\approx 2\sqrt{({\it\alpha}_{0}+0.17t)^{2}-(0.27t-{\it\alpha}_{0})^{2}}$
. In their case, by the least-mean-squares method, the value of the constant
 ${\it\alpha}_{0}=0.77$
, and by fitting with our simulated data in figure 10(c) the value is
 ${\it\alpha}_{0}=0.65$
. Thus, taking the initial condition at
 $t=2$
,
 $\dot{{\it\alpha}}(2)=0.17$
,
 ${\it\alpha}(2)=0.99$
,
 $\dot{{\it\zeta}}(2)=0.27$
and
 ${\it\zeta}(2)=-0.11$
and solving (4.2) and (4.3) the variation of crater depth with time is shown in figure 10(d). Three different phenomena, pre-entrapment, entrapment and post-entrapment, are used in figure 10 and it can be seen that there is good agreement of the numerical data with the predicted values during the cavity expansion stage, as during the retraction stage the shape of the cavity does not remain spherical and the theory becomes invalid.
As
 $\mathit{We}$
or
 $\mathit{Fr}$
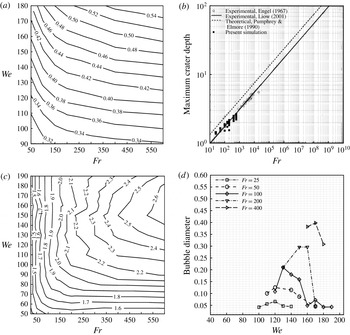
is increased, the maximum wave swell height increases (figure 11
a) and the increase is greater for high
 $\mathit{Fr}$
due to the high impact force. The maximum crater depth was predicted by Pumphrey & Elmore (Reference Pumphrey and Elmore1990) as
 $R_{m}=(\mathit{Fr}/3)^{1/4}=0.759(\mathit{Fr})^{1/4}$
by equating the gravitational potential energy with the kinetic energy of the impacting drop (dotted line in figure 11
b). Liow (Reference Liow2001) made a least-squares fit of their experimental data and obtained the relation
 $R_{m}=0.727(\mathit{Fr}/3)^{1/4}=0.552(Fr)^{1/4}$
(solid line in figure 11
b). The experimental results of Engel (Reference Engel1967) and our numerical result match this prediction fairly well. For low
 $\mathit{Fr}$
, the maximum crater size increases during phenomena where the crater shape before collapse is V-shaped (shown in figure 9), and the size remains nearly the same with increasing
 $\mathit{We}$
. Again, at low
 $\mathit{We}$
and high
 $\mathit{Fr}$
, the depth does not vary significantly. At high
 $\mathit{Fr}$
, with increase in
 $\mathit{We}$
, the maximum crater depth increases during the pre-entrapment regime (figure 11
c) and then decreases during the post-entrapment regime. The bubble entrapment phenomenon for low
 $\mathit{Fr}$
begins and ends at
 $\mathit{We}$
less than that for high
 $\mathit{Fr}$
and hence the bubble entrapment zone is smaller for high
 $\mathit{Fr}$
(figure 11
d). The bubble size initially increases and then decreases with increase in
 $\mathit{We}$
. With increasing
 $\mathit{Fr}$
, the bubble size increases and the small bubble with long thick jet phenomenon is not observed (
 $\mathit{Fr}>100$
). The bubble size ranges from 0.042 to 0.398 times the drop diameter for
 $\mathit{We}=100{-}180$
and
 $\mathit{Fr}=25{-}400$
. The values are close to those of the experiments by Liow (Reference Liow2001), where the bubble size ranged from 0.038 to 0.41 times the drop diameter for
 $\mathit{We}=87{-}200$
and
 $\mathit{Fr}=146{-}341$
.
(a) Contour plot of maximum wave swell height; (b) maximum crater depth with Froude number; (c) contour plot of maximum crater depth; (d) bubble diameter for different
 $\mathit{We}{-}\mathit{Fr}$
ranges.

4.4. Jet characteristics
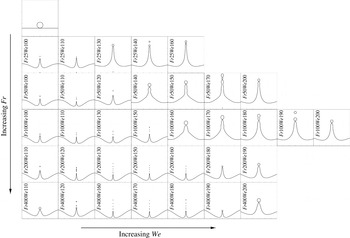
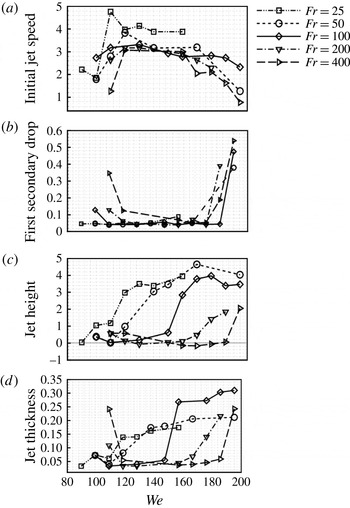
The change in jet characteristics with increasing Weber and Froude numbers is illustrated in figure 12, where the jet shape before the last secondary drop is formed is shown. The jet transforms from a small thin jet to a long thick jet as the Weber number increases. The number of secondary drops decreases and their size increases with increase in Weber number. For
 $\mathit{Fr}=50{-}400$
, at low Weber numbers, a short thick jet with a few secondary drops is formed, followed by a short thin high-speed jet with many secondary drops and then a long thick jet with a few secondary drops. The initial jet speed, first secondary drop diameter, jet height and jet thickness during last drop pinch-off are shown in figure 13. The initial jet speed shows that within a range of
 $\mathit{We}$
, there is a high-speed jet (velocity nearly three times the drop impact velocity) and below and above this range the jet speed is lower. The first secondary drop diameter size depends on the jet speed and for the high-speed jet regime the values are nearly the same for different Froude numbers (0.05 times the initial drop diameter). The drop diameter extends as much as 0.5 times during the thick jet regime. During the short thick jet regime at
 $\mathit{Fr}>100$
, the secondary drop diameter is greater than during the thin jet regime. The jet height and thickness are measured at the moment of last secondary drop pinch-off (figure 12). The jet height gradually increases with increase in
 $\mathit{We}$
. At high Froude numbers (
 ${>}100$
), the height of the long thick jet is smaller than for low Froude numbers. At
 $\mathit{Fr}>100$
, the last secondary drop pinches before the jet rises above the wave swell height (indicated by the zero line). For
 $\mathit{Fr}<100$
, the jet thickness increases from the thin jet to the thick jet regime. For
 $\mathit{Fr}>100$
, for low Weber numbers the jet thickness is greater during the small thick jet regime, decreases during the thin jet regime and again increases during the long jet regime. The jet height and jet thickness do not change much at low
 $\mathit{We}$
but increase significantly for high
 $\mathit{We}$
.
Jet shape during the last secondary drop pinch-off with increasing Weber and Froude numbers.

(a–d) Initial jet speed, first secondary drop diameter, jet height and jet thickness during the first secondary drop pinch-off for different
 $\mathit{We}{-}\mathit{Fr}$
ranges.

4.5. Criteria for different phenomena
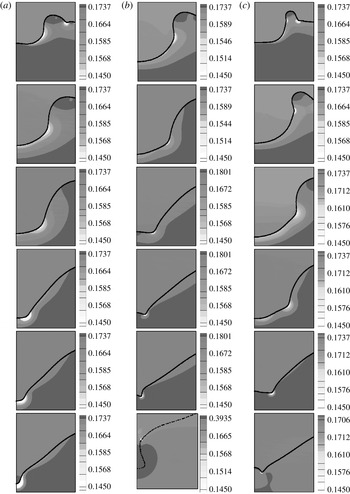
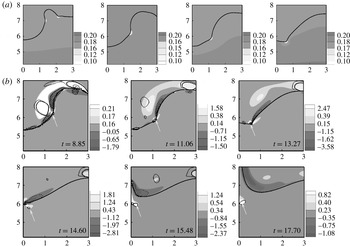
Pumphrey & Elmore (Reference Pumphrey and Elmore1990) observed a capillary wave that travels down the sides of the crater. When this wave reaches the bottom of the crater, its crest closes in from all sides, thus trapping the bubble. Oguz & Prosperetti (Reference Oguz and Prosperetti1990) explained that the bubble entrapment phenomenon occurs when the motion of the growing crater wall stops and reverses at different positions at different times. Above the bubble entrainment, the crater grows hemispherically and collapses simultaneously at all points of the crater wall. Later, Morton et al. (Reference Morton, Rudman and Liow2000) argued that when the capillary wave speed and maximum capillary crater depth are such that the wave reaches the bottom of the crater before the collapse, then bubble entrapment occurs. Above the bubble entrainment region, a cylindrical crater shape is observed instead of a hemispherical shape and the crater collapse occurs asynchronously. No bubble is entrained as the crater floor rises earlier. Morton et al. (Reference Morton, Rudman and Liow2000) represented capillary waves by an arrow on the sharp corners in the crater wall and plotted the radial and axial displacement of the wavefront. Now the question is how to detect the capillary wave positions more accurately and check whether they are the only factors responsible for different phenomena. Berberovic et al. (Reference Berberovic, van Hinsberg, Jakirlic, Roisman and Tropea2009) showed that when a capillary wave is created, its outer corner is sharp, indicating a strong local pressure drop. By plotting the isocontours of the pressure field, they observed that the capillary wave separates the high-pressure region above and the relatively low-pressure region below the wave. In a similar way, we plot the isocontours of pressure and capture the capillary wave during the pre-entrapment, entrapment and post-entrapment phenomena. During the thin jet phenomenon at
 $\mathit{Fr}=100$
and
 $\mathit{We}=100$
(figure 14
a), where the crater shape changes from U-shaped to V-shaped, the capillary wave initially forms at the junction of the vertical crater wall and the crater base. Finally, it moves towards the crater base centre when the sharp crater point is formed. During bubble entrapment (figure 14
b), the capillary wave moves along the sharp corners until the crater shape is a flat V-shape at
 $t=11.95$
. After this, a sub-crater is formed, which Morton et al. (Reference Morton, Rudman and Liow2000) explained as the capillary wavefront moving close to the axis. However, the pressure plot clearly indicates that at
 $t=12.39$
the capillary wave is situated at the sub-crater corner. Further, during the bubble pinch-off, the low-pressure area rises (an enlarged view is shown for
 $t=12.70$
) above the sub-crater due to fast-focusing flow above the singularity. In the post-entrapment regime, the crater shape is initially more spherical and the corners are more pronounced. The capillary wave moves along the crater wall as shown in figure 14(c).
Capillary wave movement indicated by a localized low-pressure zone during (a) the pre-entrapment regime (
 $\mathit{Fr}=100$
,
 $\mathit{We}=100$
), the time instants are 2.21, 4.42, 6.64, 8.85, 9.29 and 9.73; (b) the entrapment regime (
 $\mathit{Fr}=100$
,
 $\mathit{We}=150$
), the time instants are 4.42, 8.85, 11.06, 11.95, 12.39 and 12.70; (c) the post-entrapment regime (
 $\mathit{Fr}=100$
,
 $\mathit{We}=200$
), the time instants are 2.21, 4.42, 8.85, 11.06, 13.27 and 14.16.

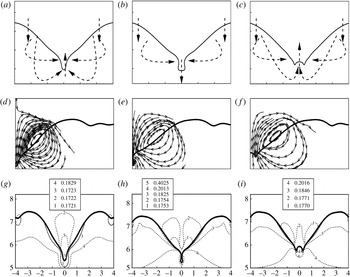
Hence, capillary wave motion alone is unable to explain the different phenomena. We tried to check some other approaches such as the streamline and isosurface of pressure just before the crater collapse to jet formation. Panels (a–c) in figure 15 show a schematic of the fluid flow in the three regimes. The streamline contours in the pre-entrapment regime show that there is a small circulation at the crater base just before the crater base retraction since the vertical (horizontal) velocity of the crater base is downwards (outwards) and for the crater corner it is the reverse. During the crater base retraction stage, the crater base and the crater corner move in the same direction and the circulation is no longer seen.
Typical flow directions (a–c), streamlines (d–f) and pressure contours (g–i) for (a,d,g) the pre-entrapment zone, (b,e,h) the entrapment zone and (c,f,i) the post-entrapment zone.

During the re-expansion stage in the entrapment regime, the streamlines are directed from the wave swell to the crater sidewalls and a circulation starts at the crater base. This circulation continues as the sub-crater is formed. Unlike the pre-entrapment and entrapment regimes, circulation at the crater base is not observed in the post-entrapment regime. During collapse, the liquid from the wave swell is directed towards the crater base and a thick jet is ejected. The pressure isosurfaces in panels (g–h) show that in the pre-entrapment phenomenon, the entire crater shape is under the same pressure (labelled 3). Just below the sharp point there is a low-pressure zone (labelled 1) and below that a high-pressure zone (labelled 4). Subsequently, the streamline plots indicate the fluid motion directed towards the crater surface. During the entrapment process, the high-pressure zone (labelled 5) and the streamlines directed perpendicular to the sub-crater are responsible for the pinch-off. In the post-entrapment phenomenon, the pressure distribution (contours labelled 3 and 4) leads to the thick Rayleigh jet formation. The high pressure (labelled 4) is below the crater centre and the streamline shows an upward vertical flow. In the crater sidewalls there is comparatively low pressure (labelled 3), and this explains why the sub-crater does not form in this case.
4.6. Vortex ring generation and propagation
Morton et al. (Reference Morton, Rudman and Liow2000) were the first to show numerically the isosurface of vorticity for three different regimes: pre-entrapment, entrapment and post-entrapment. The main focus was on the generation and propagation of vortices and the formation of vortex rings during these phenomena. They showed the formation of two axisymmetric vortex rings during conditions below the bubble entrapment regime (the coalescence regime described here), a single vortex ring during conditions above the bubble entrainment regime (the long thick jet regime described here) and suppression of vortex rings during the bubble entrapment regime. Prior to the work of Morton et al. (Reference Morton, Rudman and Liow2000), various experiments described vortex rings as the characteristics of only the coalescence regime (Rein Reference Rein1996), and in no other regimes could they be detected.
Vorticity is the circulation in a flow field, defined mathematically as the curl of the velocity vector:
 ${\bf\omega}=\boldsymbol{{\rm\nabla}}\times \boldsymbol{u}$
. Vorticity defines not only the vortex cores but also shearing motions in the flow. An efficient technique to identify vortices is by critical point analysis of the local velocity gradient tensor and its corresponding eigenvalues (Chong, Perry & Cantwell Reference Chong, Perry and Cantwell1990; Zhou et al.
Reference Zhou, Adrian, Balachandar and Kendall1999). In three-dimensional problems, the local velocity tensor has one real eigenvalue
 $({\it\lambda}_{r})$
and a pair of complex conjugate eigenvalues
 $({\it\lambda}_{cr}\pm \text{i}{\it\lambda}_{ci})$
for the positive discriminate of its characteristic equation. Flow about the eigenvectors corresponding to
 ${\it\lambda}_{r}$
corresponds to swirling motion and
 ${\it\lambda}_{ci}^{-1}$
corresponds to the time required to swirl once. Thus,
 ${\it\lambda}_{ci}=0$
represents pure shear flow with an infinitely long ellipse shape and
 ${\it\lambda}_{ci}>0$
represents more circular eddies or vortices. The strength of the local swirling motion is quantified by
 ${\it\lambda}_{ci}$
, and therefore the imaginary part of the complex eigenvalue pair is referred to as the local swirling strength of the vortex (Zhou, Adrian & Balachandar Reference Zhou, Adrian and Balachandar1996; Zhou et al.
Reference Zhou, Adrian, Balachandar and Kendall1999). In two-dimensional cases, the velocity gradient tensor either has two real eigenvalues or a pair of complex conjugate eigenvalues (Adrian, Christensen & Liu Reference Adrian, Christensen and Liu2000). Hence, in this paper, along with the isosurface of vorticity
 $({\bf\omega})$
, the vortices are identified by plotting the isosurface of
 ${\it\lambda}_{ci}>0$
. Although the vorticity plot identifies the eddies fairly well, the plot is noisier than the swirling strength plot and it also plots the shear flow along with the vortices.
Through our simulations we capture the vorticity (flooded contour) and subsequently vortex rings (line contour and indicated by a white arrow) for all the regimes, from partial coalescence to the long thick jet, and explain their origin and propagation. Morton et al. (Reference Morton, Rudman and Liow2000) showed that at impact conditions above the entrainment regime there are surface waves that approach the crater base during crater collapse. Due to the presence of a low-pressure region in the vicinity of the wavefront, vorticity is generated, which forms into a vortex ring during the initial thick jet growth. In § 4.5, we described the motion of capillary waves by plotting the isosurface of pressure contours. The motion of the local low-pressure region showed the capillary wave motion. If similar pressure contours are seen for different phenomena, an interesting aspect to be noted is the motion of the low-pressure zone. This zone coincides with the zone where vorticity is strong in the liquid. Hence, it can be argued that the pressure difference along the crater surface leads to the generation of vorticity. The vorticity value is maximum at the vortex core and the positive vorticity is responsible for the formation of vortex rings.
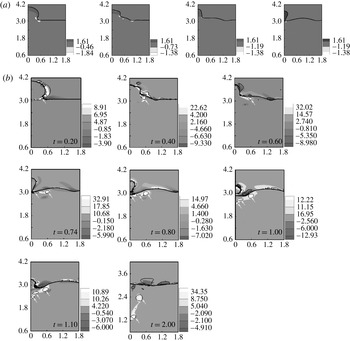
When a drop of liquid impacts an air–liquid interface, the impact either generates a daughter/secondary droplet of liquid or the impacting drop is absorbed without engendering a secondary droplet. The first case is referred to as a partial coalescence and the latter as complete coalescence. In the case of partial coalescence (figure 16), the underlying liquid moves faster towards the drop than the drop liquid coming down. Thus the capillary waves gradually travel up. This phenomenon has been extensively studied in our previous work (Ray et al.
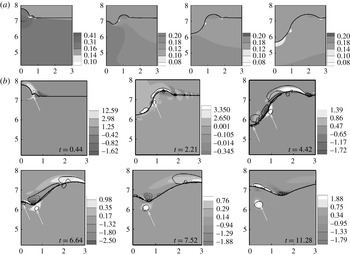
Reference Ray, Biswas and Sharma2010). Here, further investigations were made on the generation and propagation of vortex rings during this phenomenon. The first vortex ring is formed when the spherical shape of the drop gradually converts to a column-like shape at
 $t=0.4$
. Initially this vortex ring remains close to the free surface. Two more vortex rings are formed during secondary drop pinch-off at
 $t=0.74$
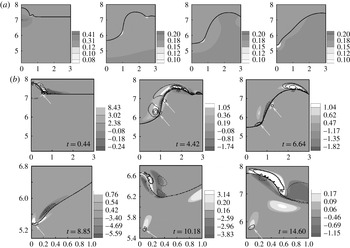
. As the free surface moves up, all the vortex rings move down, and during this motion the small vortices combine. In the case of complete coalescence (figure 17), after drop impact there is crater formation and the capillary wave moves along the crater wall. Vorticity is generated on drop impact and follows the capillary wave locations. Although there is a low-pressure region at the crater base, the vorticity is not observed there, but a small vortex ring can be identified which remains attached to the crater surface. When the crater collapses, a large ring detaches from the crater’s sharp surface, far from the axis of symmetry. Later, the vortex ring moves down and comes close to the axis.
(a) Pressure contours for time instants 0.2, 0.4, 0.6 and 0.74 and (b) vorticity contour and swirling strength isolines superimposed on one another during the partial coalescence phenomenon (
 $\mathit{Fr}=6$
,
 $\mathit{We}=3$
,
 $\mathit{Re}=566$
).

(a) Pressure contours for time instants 0.44, 1.33, 2.21 and 4.42 and (b) vorticity contour and swirling strength isolines superimposed on one another during the complete coalescence phenomenon (
 $\mathit{Fr}=100$
,
 $\mathit{We}=50$
,
 $\mathit{Re}=2635$
).

In the case of the small thick jet or thin jet regime (pre-entrapment zone), the vorticity generation is again due to drop impact and propagates due to pressure difference. Due to the high Weber number, the formation of a crater leads to air circulation near the crater sidewall, shown at
 $t=4.42$
. Here, the vorticity is less than in the coalescence regime, and the vortex ring size is small (shown in enlarged view at
 $t=8.85{-}14.6$
in figure 18
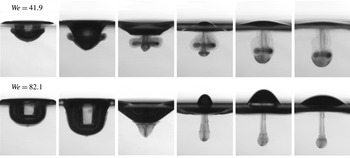
b). Some other zones showing positive vorticity contours do not account for the vortex ring, as discussed earlier. Recent experiments by Santini, Fest-Santini & Cossali (Reference Santini, Fest-Santini and Cossali2013) visualizing the flow field by pigmented drops further support our results. They compared two cases,
 $\mathit{We}=41.9$
(similar to the coalescence phenomenon) and
 $\mathit{We}=82.1$
(similar to the small thick jet phenomenon), as shown in figure 19. When
 $\mathit{We}=41.9$
, the formation of two vortex ring structures is seen: the outer vortex ring is generated at the crater edge during crater spreading while the central one is produced when the crater begins the receding period at the fluid boundary. A comparison with the case at
 $\mathit{We}=82.1$
shows that the outer vortex ring is actually not generated, but only a central vortex ring structure is generated. Their main observation was that when the Weber number is larger than 64 the formation of the outer vortex ring is inhibited, consistent with the observations of Hsiao, Lichter & Quintero (Reference Hsiao, Lichter and Quintero1988) and Cresswell & Morton (Reference Cresswell and Morton1995).
(a) Pressure contours for time instants 0.44, 4.42, 6.63 and 8.85 and (b) vorticity contour and swirling strength isolines superimposed on one another during the short thick jet phenomenon (
 $\mathit{Fr}=100$
,
 $\mathit{We}=90$
,
 $\mathit{Re}=4110$
).

Pigmented drop impact showing vortex ring structures at
 $\mathit{We}=41.9$
and
 $\mathit{We}=82.1$
by Santini et al. (Reference Santini, Fest-Santini and Cossali2013).

For
 $\mathit{We}=150$
(bubble entrapment phenomenon) and
 $\mathit{We}=200$
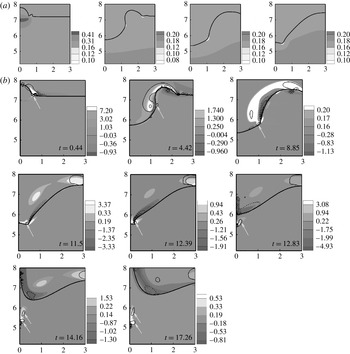
(long thick jet phenomenon) again only a central vortex is seen. The vortex ring size increases for these regimes. After the bubble pinch-off, the vortex ring remains attached to the upper bubble surface as it moves down (also shown by Morton et al.
Reference Morton, Rudman and Liow2000). Later, the ring detaches and is directed upwards, unlike in the previous regimes where the vortex ring gradually travels downwards (figure 20). During post-entrapment, the vorticity is generated in a similar fashion and the vortex ring detaches during crater collapse at
 $t=14.6$
(figure 21). During the pre-entrapment, entrapment and post-entrapment phenomena, the vortex ring detaches from the crater base at the crater centre line.
(a) Pressure contours for time instants 0.44, 4.42, 8.85 and 11.50 and (b) vorticity contour and swirling strength isolines superimposed on one another during the thin jet with large bubble entrapment phenomenon (
 $\mathit{Fr}=100$
,
 $\mathit{We}=150$
,
 $\mathit{Re}=6034$
).

(a) Pressure contours for time instants 4.42, 8.85, 11.06 and 13.27 and (b) vorticity contour and swirling strength isolines superimposed on one another during the long thick jet phenomenon (
 $\mathit{Fr}=100$
,
 $\mathit{We}=200$
,
 $\mathit{Re}=7474$
).

5. Conclusions
In this work, the various regimes during water drop impact on an infinite air–water interface were investigated. The significant findings are as follows.
-
(i) On drop impact, all the phenomena begin with the expansion stage until the maximum wave swell height is reached. Wave swell retraction occurs followed by the crater sidewall and then the crater base retraction.
-
(ii) During the expansion stage the initial shape of the crater may be either a U-shape (thin jet regime) or a hemispherical shape (bubble entrapment and thick jet regime).
-
(iii) The crater base retracts differently for different parametric ranges and so leads to different phenomena: pointed V-shape during thin jets, V-shape with a sub-crater during bubble entrapment and W-shape during long thick jets. The crater width and wave swell angle increase as
 $\mathit{We}$
increases.
-
(iv) A regime map for spherical drop impact was drawn with seven different phenomena. It can be divided into coalescence (P1), pre-entrapment (P2, P3 and P4), entrapment (P5 and P6) and the post-entrapment regime (P7). New zones – the small thick jet regime with (P3) and without a secondary drop (P2), the thin jet regime and the small bubble entrapment with a long thick jet (P6) – have been shown.
-
(v) The coalescence–small thick jet limit is
$\mathit{We}=34.7\mathit{Fr}^{0.145}$
. The limits for the large bubble entrapment zone are similar to those proposed by Oguz & Prosperetti (Reference Oguz and Prosperetti1990),
$\mathit{We}=41.3\mathit{Fr}^{0.179}$
and
$\mathit{We}=48.3\mathit{Fr}^{0.247}$
. The upper limit to the small bubble entrapment is determined as
$\mathit{We}=63.1\mathit{Fr}^{0.257}$
. -
(vi) During the cavity expansion stage, the crater depth matches the theoretical predictions of Berberovic et al. (Reference Berberovic, van Hinsberg, Jakirlic, Roisman and Tropea2009) and Bisighini & Cossali (Reference Bisighini and Cossali2010). The maximum crater depth with Froude number follows the least-squares fit relation of Liow (Reference Liow2001).
-
(vii) For
$\mathit{Fr}=50{-}400$
, at low Weber numbers, a short thick jet with a few secondary drops is formed, followed by a short thin high-speed jet with many secondary drops and then a long thick jet with a few secondary drops. -
(viii) The mechanism responsible for different crater collapses was investigated by means of isocontours of pressure and streamline plots. The pressure is greater at the crater sidewalls than at the crater base during pre-entrapment, perpendicular to the crater sidewalls during entrapment and vertically upwards during post-entrapment.
-
(ix) For all the regimes, vortex rings generated during drop impact move along with the capillary wave. Except for the partial coalescence phenomenon, in all other phenomena vortex rings occur only after crater formation. During complete coalescence, an outer vortex ring and a central vortex ring are generated, but in pre-entrapment, entrapment and post-entrapment phenomena, a vortex ring is generated only at the crater centre line.


Our numerical simulations can capture a wide range of phenomena, making it possible to understand the intricate details. However, for processes where the length scale and time scale are too small, the simulations fail. Apart from the seven different phenomena discussed in this paper, there are phenomena like microbubble formation from floating drops, multiple primary bubble entrapment and bouncing which cannot be captured. Therefore, our future work will include use of the adaptive mesh technique. The vortex ring formation and propagation is shown here for a spherical drop. We further plan to study vortex ring formation with different drop shapes and different impact heights following the experimental work of Durst (Reference Durst1996).
Acknowledgements
We gratefully thank Dr D. Morton, Dr J. L. Liow and Dr D. E. Cole for many insightful discussions.