INTRODUCTION
Radiocarbon (14C) in seawater is used as a reliable tracer of water mass advection and mixing in water bodies (e.g., Druffel Reference Druffel1981; Broecker et al. Reference Broecker, Peng, Östlund and Stuiver1985). It is naturally produced in the upper atmosphere when neutrons produced by incoming cosmic rays react with nitrogen atoms. Once produced, radiocarbon is oxidized to 14CO2 and is taken up into the surface ocean though CO2 exchange between the atmosphere and the surface ocean, with a time lag of about 10 years (Broecker and Peng Reference Broecker and Peng1982; Druffel and Suess Reference Druffel and Suess1983; Druffel Reference Druffel1987).
Atmospheric 14C rapidly increased after 1955 due to above-ground nuclear bomb tests at Soviet sites in Kazakhstan and Novaya Zemlya and at the U.S. Pacific Proving Grounds at Bikini and Enewetak atolls (yellow stars in Figure 1a), resulting in a doubling of 14C levels by the mid-1960s (Hua et al. Reference Hua, Barbetti and Rakowski2013). The United States conducted tests at the Pacific Proving Grounds in 1954 (Operation Castle), 1956 (Operation Redwing), and 1958 (Operation Hardtack I), whose total yield at the surface of land, lagoon, and sea were 48 Mt, 16 Mt, and 23 Mt, respectively (Andrews et al. Reference Andrews, Asami, Iryu, Kobayashi and Camacho2016). This artificial 14C is called bomb-14C and is diffused into the surface ocean through the atmosphere-ocean CO2 exchange. In contrast, the deep ocean is isolated from direct CO2 exchange input from the atmosphere. The presence of bomb-14C allows excess 14C in surface waters to be used as a very sensitive indicator of vertical and horizontal advection of water masses (Guilderson and Schrag Reference Guilderson and Schrag1998; Larsen et al. Reference Larsen, Yokoyama and Fernandes2018). International seawater-sampling programs, such as the Geochemical Ocean Sections Study (GEOSECS) in the 1970s and the World Ocean Circulation Experiment (WOCE) in the 1990s, produced maps of 14C distributions in the world’s oceans (Stuiver et al. Reference Stuiver, Östlund and McConnaughey1981; Kumamoto et al. Reference Kumamoto, Murata, Kawano, Watanabe and Fukasawa2013). The 14C isotopic signature is reported as Δ14C with reference to a pre-industrial wood standard (Stuiver and Polach Reference Stuiver and Polach1977). However, these data sets captured only snapshots from the time of data collection. Thus, they cannot be used in oceanographic studies at seasonal to decadal time scales.
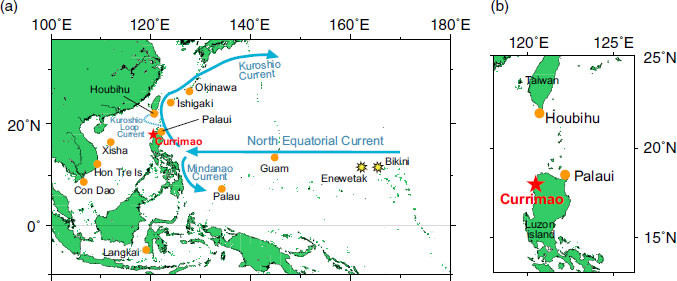
(a) Map of the western Pacific including the South China Sea and coral sample sites reported in this paper, namely, Currimao (red star), as well as those reported in previous studies: Okinawa (Konishi et al. Reference Konishi, Tanaka and Sakanoue1981), Ishigaki (Hirabayashi et al. Reference Hirabayashi, Yokoyama, Suzuki, Miyairi and Aze2017a), Guam (Andrews et al. Reference Andrews, Asami, Iryu, Kobayashi and Camacho2016), Palau (Glynn et al. Reference Glynn, Druffel, Griffin, Dunbar, Osborne and Sanchez-Cabeza2013), Langkai (Fallon and Guilderson Reference Fallon and Guilderson2008), Xisha (Southon et al. 2002), Hon Tre Island (Bolton et al. Reference Bolton, Goodkin, Druffel, Griffin and Murty2016), Con Dao (Mitsuguchi et al. Reference Mitsuguchi, Dang, Kitagawa, Yoneda and Shibata2007), and Houbihu and Palaui (Ramos et al. Reference Ramos, Goodkin, Druffel, Fan and Siringan2019). Blue arrows in this map indicate major regional currents: North Equatorial Current (NEC), Kuroshio Current, and Mindanao Current. The U.S. Pacific proving grounds at Bikini and Enewetak atolls are shown as yellow stars. (b) Map of coral sampling locations in the Luzon Strait reported by this study (Currimao; red star) and previous studies (Houbihu and Palaui; Ramos et al. Reference Ramos, Goodkin, Druffel, Fan and Siringan2019). (Please see electronic version for color figures.)
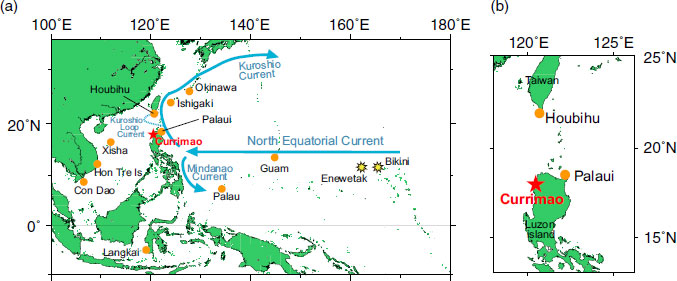
The calcium carbonate (aragonite) skeletons of reef-building corals contain annual density bands that records the Δ14C values of surface water at the time at which the coral skeletons took up dissolved inorganic carbon (DIC) from ambient seawater (Druffel and Linick Reference Druffel and Linick1978; Druffel Reference Druffel1982, Reference Druffel1989). Thus, coral skeletal Δ14C records can also be used as a sensitive proxy of water mass mixing, especially after the 1950s. Previous studies have shown that atmospheric Δ14C started to increase in the 1950s (Hua et al. Reference Hua, Barbetti and Rakowski2013), immediately after the atmospheric nuclear bomb tests began. However, Δ14C values of corals did not begin to increase until the 1960s (e.g., Nozaki et al. Reference Nozaki, Rye, Turekian and Dodge1978; Grottoli and Eakin Reference Grottoli and Eakin2007), due to the time lag caused by atmosphere-ocean CO2 exchange. These Δ14C variation curves are called the ‘‘bomb curve’’ or ‘‘bomb peak’’ (Grottoli and Eakin Reference Grottoli and Eakin2007; Hua Reference Hua2009). The bomb peak varies in timing and magnitude among corals from different locations, reflecting local characteristics of the atmosphere-ocean CO2 exchange rates and physical oceanographic mixing processes (Druffel Reference Druffel2002; Grottoli and Eakin Reference Grottoli and Eakin2007). Unusual rapid bomb-14C increases in the 1950s and 1960s, “early bomb-14C spikes”, were observed in corals of the western Pacific (Glynn et al. Reference Glynn, Druffel, Griffin, Dunbar, Osborne and Sanchez-Cabeza2013; Andrews et al. Reference Andrews, Asami, Iryu, Kobayashi and Camacho2016; Hirabayashi et al. Reference Hirabayashi, Yokoyama, Suzuki, Miyairi and Aze2017a), Indonesian Through Flow (Fallon and Guilderson Reference Fallon and Guilderson2008) and Luzon Strait (Ramos et al. Reference Ramos, Goodkin, Druffel, Fan and Siringan2019). Early bomb-14C spikes appeared within a few years after the nuclear detonations, suggesting that general atmosphere-ocean CO2 exchange is too slow to account for such rapid rise in the coral Δ14C. Therefore, the early bomb-14C spikes can be explained by the mechanism of “close-in fallout” (Kellogg et al. Reference Kellogg, Rapp and Greenfield1957; Fallon and Guilderson Reference Fallon and Guilderson2008; Glynn et al. Reference Glynn, Druffel, Griffin, Dunbar, Osborne and Sanchez-Cabeza2013; Andrews et al. Reference Andrews, Asami, Iryu, Kobayashi and Camacho2016; Hirabayashi et al. Reference Hirabayashi, Yokoyama, Suzuki, Miyairi and Aze2017a): direct advection of high-14C labeled water from the U.S. Pacific Proving Grounds through the North Equatorial Current (NEC), Kuroshio, Kuroshio Loop Current and Mindanao Current (Figure 1).
Compiling coral skeletal Δ14C datasets in the western Pacific will contribute to our understanding of the oceanography of the region and can be used for discussion of its relationship to climate change (e.g., Hirabayashi et al. Reference Hirabayashi, Yokoyama, Suzuki, Miyairi and Aze2017a). Recently, high-resolution Δ14C measurements of corals have been used to study oceanographic water-mass mixing and to improve ocean-current transport models. Andrews et al. (Reference Andrews, Asami, Iryu, Kobayashi and Camacho2016) calibrated an ocean current transport model using coral skeletal Δ14C datasets from Palau (Glynn et al. Reference Glynn, Druffel, Griffin, Dunbar, Osborne and Sanchez-Cabeza2013), Okinawa (Konishi et al. Reference Konishi, Tanaka and Sakanoue1981), Langkai (Fallon and Guilderson Reference Fallon and Guilderson2008), Lombok (Guilderson et al. Reference Guilderson, Fallon, Moore, Schrag and Charles2009) and Guam (Andrews et al. Reference Andrews, Asami, Iryu, Kobayashi and Camacho2016) using the early bomb-14C spikes. Their model estimated fallout particle propagation, which was conducted using ocean currents from a comprehensive ocean reanalysis called the Simple Ocean Data Assimilation version 2 (SODA2) (Carton et al. Reference Carton, Chepurin, Cao and Giese2000). For the Kuroshio region, only low-resolution data (annual to every two years) from the Okinawa coral reported by Konishi et al. (Reference Konishi, Tanaka and Sakanoue1981) were used in the model as representative of the Northwest Pacific, and no data were included for Kuroshio intrusion sites in the South China Sea (SCS). As a result, their model could not simulate transport by the Kuroshio. In contrast, the Mindanao Current and Indonesian Throughflow could be simulated properly, since high-resolution coral data were available. Ramos et al. (Reference Ramos, Goodkin, Druffel, Fan and Siringan2019), using a box model, estimated the lateral surface water exchange across the Luzon Strait based on coral Δ14C records from Houbihu, Taiwan, and Palaui, Philippines, from 1970 to 1990. Although they concluded that the derived mean value is on the order of available short-term measurements, they also warned of overestimation.
Oceanography and climate in the SCS are deeply related to the East Asian monsoon. The surface ocean circulation in the SCS is cyclonic in winter and anticyclonic in summer due to the East Asian monsoon (Wyrtki Reference Wyrtki1961; Hu et al. Reference Hu, Kawamura, Hong and Qi2000), and upwelling at both the eastern and western sides of SCS including around Luzon Strait has been identified (Nitani Reference Nitani and Marr1970; Martin and Villanoy Reference Martin, Villanoy, Tregoning and Rizos2008; Ndah et al. Reference Ndah, Becek and Dagar2016). Bolton et al. (Reference Bolton, Goodkin, Druffel, Griffin and Murty2016) detected the seasonal upwelling in the coral from Hon Tre Island, which is one of the strongest upwelling areas in the SCS during the summer, using the seasonal Δ14C variability (18‰ seasonal differences).
Kuroshio, the western boundary current in the Pacific, intrudes into the SCS through the Luzon Strait as the Kuroshio Loop Current, which is formed by the north-east monsoon in winter, and influences regional nutrients, heat and salinity balances (Nan et al. Reference Nan, Xue and Yu2015). The Asian monsoon is one of the important global atmospheric circulation systems (Wang Reference Wang2006) and has a significant inter-annual and decadal variability (Xu et al. Reference Xu, Zhu and Zhou1999). Because of the recent global warming, the monsoon velocity has decreased gradually from 1969 to 2000 (Peng et al. Reference Peng, Chen, Nie, Head, He and Zhou2003; Xu et al. Reference Xu, Chang, Fu, Qi, Robock, Robinson and Zhang2006; Jiang et al. Reference Jiang, Luo, Zhao and Tao2010). Song et al. (Reference Song, Peng, Zhou, Liu, Liu and Chen2012) reconstructed the East Asian winter monsoon (EAWM) velocity using the coral skeletal δ18O data in the northern SCS from 1818 to 2000, suggesting that the EAWM has shown decadal variability for the period between 1818 and 2000, decreasing trends from 1818 to 1954 and from 1977 to 2000, and increasing trend from 1955 to 1976. Because of the seasonal to decadal variability of monsoon systems, the SCS ocean circulation especially in Luzon Strait would also vary. However, the direct observation over the long timescales for Luzon transport and upwelling (Pometra and Qu Reference Potemra and Qu2009; Ndah et al. Reference Ndah, Becek and Dagar2016) is still limited. Although numerical models of SCS circulation have recently been improved, estimates of the Luzon transport in different models still disagree (e.g., Hsin et al. Reference Hsin, Wu and Chao2012). Most previous studies in the SCS have suggested the occurrence of upwelling based largely on proxy indicators, such as sea surface temperature (e.g., Dale Reference Dale1956; Nitani Reference Nitani and Marr1970; Chu et al. Reference Chu, Fan, Lozano and Kerling1998; Hu et al. Reference Hu, Kawamura, Hong, Suetsugu and Lin2001; Akhir et al. Reference Akhir, Daryabor, Husain, Tangang and Qiao2015), salinity (Hu et al. Reference Hu, Kawamura, Hong, Suetsugu and Lin2001; Jing et al. Reference Jing, Hua, Qi and Zhang2007), nutrients (Lin et al. Reference Lin, Wang and Sun2011), and chlorophyll-a (Tang et al. Reference Tang, Kester, Ni, Kawamura and Hong2002; Villanoy et al. Reference Villanoy, Cabrera, Yñiguez, Camoying, de Guzman, David and Flament2011). Long-term, high-vertical-resolution observations are needed to improve our understanding of the SCS current systems.
14C is a sensitive and reliable tracer of seawater mixing and coral skeletal Δ14C data can be used as a proxy for upwelling and water mass advection. Such a sensitive seawater mixing proxy can help improve the reconstruction of detailed oceanography of the past. However, long-term Δ14C data are still limited for the Kuroshio region, especially for areas that can directly detect the Kuroshio intrusion into the SCS. Here, we report a high-resolution Δ14C record spanning 50 years from a modern coral from the Currimao coast of northwest Luzon Island, Philippines. The Luzon Strait connects the SCS with the western Pacific, and the water mass in the SCS is directly influenced by the Kuroshio intrusion. We also compare our Δ14C data with coral data from Ishigaki (Hirabayashi et al. Reference Hirabayashi, Yokoyama, Suzuki, Miyairi and Aze2017a), Guam (Andrews et al. Reference Andrews, Asami, Iryu, Kobayashi and Camacho2016), Con Dao (Mitsuguchi et al. Reference Mitsuguchi, Dang, Kitagawa, Yoneda and Shibata2007), Hon Tre Island (Bolton et al. Reference Bolton, Goodkin, Druffel, Griffin and Murty2016), Palau (Glynn et al. Reference Glynn, Druffel, Griffin, Dunbar, Osborne and Sanchez-Cabeza2013), Langkai (Fallon and Guilderson Reference Fallon and Guilderson2008), Houbihu and Palaui (Ramos et al. Reference Ramos, Goodkin, Druffel, Fan and Siringan2019) to discuss the differences in bomb-14C variations between the SCS and the Pacific.
MATERIALS AND METHODS
A coral (Porites lutea) core, PCURIN03, was obtained from the Currimao coast (17°59.098'N, 120°E28.809'E), off northwest Luzon Island, at a water depth of 4.8 m, in November 2004 (Yokoyama et al. Reference Yokoyama, Suzuki, Siringan, Maeda, Abe-Ouchi, Ohgaito, Kawahata and Matsuzaki2011; Figure 1). This is the same coral core used for the study reporting 14C variability during the post-bomb period (from 1968 to 1994) (Hirabayashi et al. Reference Hirabayashi, Yokoyama, Suzuki, Miyairi, Aze, Siringan and Maeda2017b). The average annual growth rate of PCURIN03 is 17.3 mm/yr, with a range from 9 to 26 mm/yr from 1946 to 1994.
PCURIN03 was micro-sampled by the micromilling technique of Suzuki et al. (Reference Suzuki, Gagan, Fabricius, Isdale, Yukino and Kawahata2003) at 0.8 mm intervals along the growth axis based on the X-ray radiograph of the coral specimen. The age model is based on linear interpolation between peak seasonal environmental Sr/Ca ratios (Figure S1), which is a proxy for sea surface temperature, measured by ICP-AES at National Institute of Advanced Industrial Scienece and Technology (AIST) following Hirabayashi et al. (Reference Hirabayashi, Yokoyama, Suzuki, Kawakubo, Miyairi, Okai and Nojima2013). The age model for PCURIN03 in this paper is an updated version of that published in Hirabayashi et al. (Reference Hirabayashi, Yokoyama, Suzuki, Miyairi, Aze, Siringan and Maeda2017b) and Hirabayashi et al. (Reference Hirabayashi, Yokoyama, Suzuki, Esat, Miyairi, Aze, Siringan and Maeda2019) (Figure S1, Table S1 and S4): the updated age model before 1984 is postponed one year from the previous model due to counting loss of annual coral bands. The average annual growth of this coral was 17.3 mm, hence, miscrosampling at 0.8 mm intervals corresponds to 1to 2 months resolutions. Age errors are estimated to be about 2 months based on the seasonal Sr/Ca data and X-ray photographs.
About 6–10 mg of coral powder from PCURIN03 was graphitized for each measurement following the method of Yokoyama et al. (Reference Yokoyama, Miyairi, Matsuzaki and Tsunomori2007). We also radiocarbon dated 2 to 5 mg subsamples using a specially designed vacuum line for small samples (Yokoyama et al. Reference Yokoyama, Koizumi, Matsuzaki, Miyairi and Ohkouchi2010; Hirabayashi et al. Reference Hirabayashi, Yokoyama, Suzuki, Miyairi and Aze2017a; Hirabayashi et al. Reference Hirabayashi, Yokoyama, Suzuki, Miyairi, Aze, Siringan and Maeda2017b; Yamane et al. Reference Yamane, Yokoyama, Hirabayashi, Miyairi, Ohkouchi and Aze2019) (Table S1). Samples were dated from both before and after the early bomb-14C spikes to confirm the highest spike values for the early bomb-14C spike during the period of rapidly increasing Δ14C from 1950 to the early 1960s. This was then used to determine the timing of the appearance of those spikes. Graphite target samples were analyzed with a single-stage accelerator mass spectrometer (YS-AMS) (Yamane et al. Reference Yamane, Yokoyama, Miyairi, Suga, Matsuzaki, Dunbar and Ohkouchi2014; Yokoyama et al. Reference Yokoyama, Anderson, Yamane, Simkins, Miyairi, Yamazaki, Koizumi, Suga, Kusahara, Prothro, Hasumi, Southon and Ohkouchi2016) at the Atmosphere and Ocean Research Institute, The University of Tokyo (Yokoyama et al. Reference Yokoyama, Miyairi, Aze, Yamane, Sawada, Ando, de Natris, Hirabayashi, Ishiwa, Sato and Fukuyo2019). We re-calculated and reported the Δ14C data from Currimao (Hirabayashi et al. Reference Hirabayashi, Yokoyama, Suzuki, Miyairi, Aze, Siringan and Maeda2017b) and Ishigaki (Hirabayashi et al. Reference Hirabayashi, Yokoyama, Suzuki, Miyairi and Aze2017a) as age-corrected Δ14C (the terms of Δ in Stuiver and Polach (Reference Stuiver and Polach1977)) (Table S1 and S2), in order to compare them with previously reported Δ14C data from the Pacific and SCS. The error associated with Δ14C measured by AMS was evaluated as the counting statistics of the measured total counts for each sample and reported as 1 sigma. The consistency of scatter in repeated runs and their counting statics was determined by χ2-tests.
RESULTS AND DISCUSSIONS
14C Variability in Currimao for Pre-Bomb Period
The normal Δ14C variability in the pre-bomb period are ranging from −61.9 to −48.1‰, with the mean values of −56.1 ± 4.4‰. Δ14C values for the pre-bomb period can be used for estimation of local marine reservoir age (R) and their regional offset (ΔR) (Stuiver et al. Reference Stuiver, Pearson and Braziunas1986), and our results show ΔR in Currimao ranging from −71 ± 35 to 45 ± 34 14C yr with a mean value of −1 ± 38 14C yr (Table S4).
Early Bomb-14C Spikes in Currimao
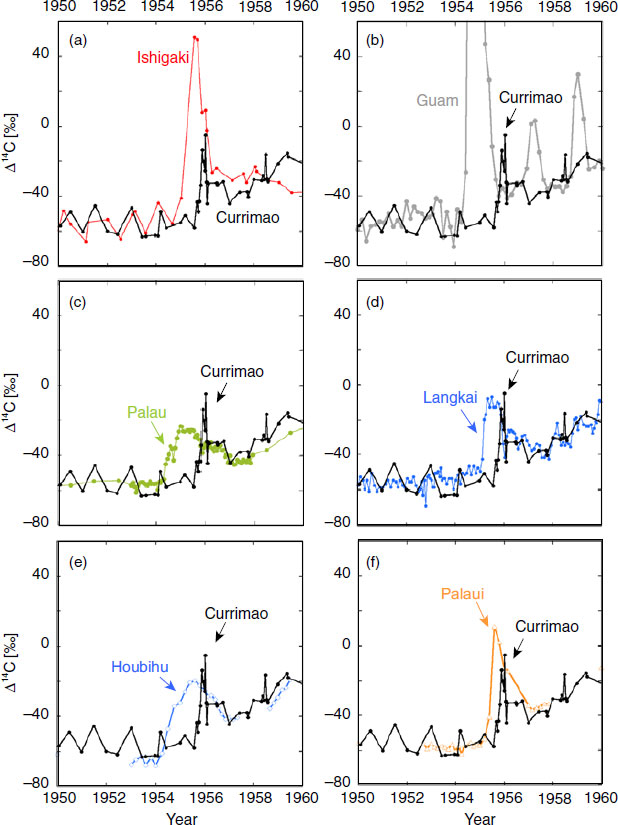
An unusual, rapid Δ14C increase (early bomb-14C spike) in the Currimao coral was observed from July 1955 to January 1957, reaching a maximum value of −4.9‰ (Figure 4a). Similar early bomb-14C spikes have also been reported from Ishigaki (Hirabayashi et al. Reference Hirabayashi, Yokoyama, Suzuki, Miyairi and Aze2017a), Guam (Andrews et al. Reference Andrews, Asami, Iryu, Kobayashi and Camacho2016), Palau (Glynn et al. Reference Glynn, Druffel, Griffin, Dunbar, Osborne and Sanchez-Cabeza2013), Palaui (Ramos et al. Reference Ramos, Goodkin, Druffel, Fan and Siringan2019) in the Pacific, Houbihu (Ramos et al. Reference Ramos, Goodkin, Druffel, Fan and Siringan2019) at the Luzon Strait, and Langkai in the Indonesian throughflow (Fallon and Guilerson Reference Fallon and Guilderson2008) (Figure 4). Currimao is the only site within the SCS where coral records the early bomb-14C spikes. Bolton et al. (Reference Bolton, Goodkin, Druffel, Griffin and Murty2016) reported a coral Δ14C record from Hon Tre Island for which no Δ14C spikes could be distinguished for the period of the 1950s. This observation indicates that circulation in the Pacific, including the NEC and Kuroshio current, does not show a strong influence deep within SCS, where Hon Tre Island is located. However, no high-resolution Δ14C data are reported from the SCS for this period, and it is possible that annual resolution of Δ14C caused artificial data smoothing and loss of signal.
The early bomb-14C spikes from 1950 to 1965 Currimao data (this study) are compared with those of (a) Ishigaki (Hirabayashi et al. Reference Hirabayashi, Yokoyama, Suzuki, Miyairi and Aze2017a), (b) Guam (Andrews et al. Reference Andrews, Asami, Iryu, Kobayashi and Camacho2016), (c) Palau (Glynn et al. Reference Glynn, Druffel, Griffin, Dunbar, Osborne and Sanchez-Cabeza2013), (d) Langkai (Fallon and Guilderson, Reference Fallon and Guilderson2008), (e) Houbihu (Ramos et al. Reference Ramos, Goodkin, Druffel, Fan and Siringan2019), and (f) Palaui (Ramos et al. Reference Ramos, Goodkin, Druffel, Fan and Siringan2019).
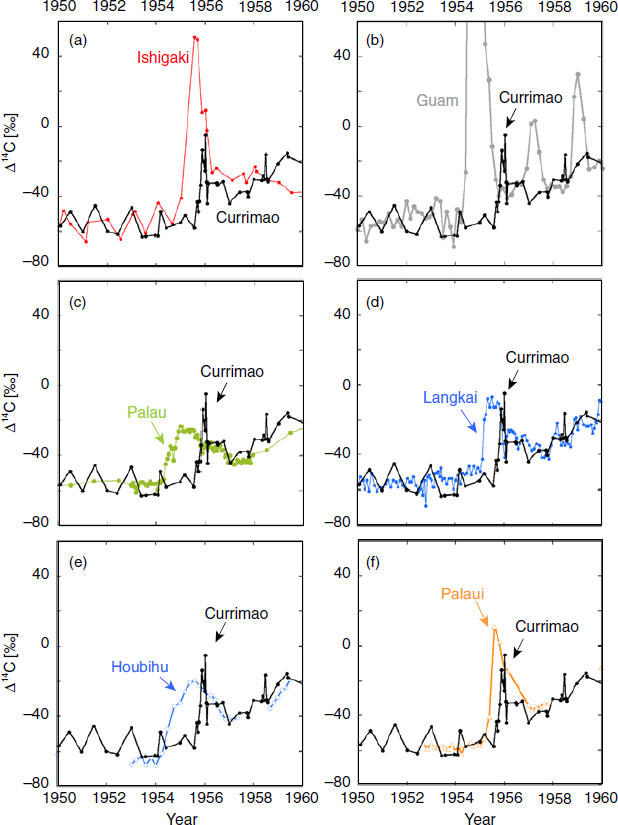
Radioactive materials produced by the nuclear bomb tests arrived first in Guam, then in Houbihu, and Palau, and finally in Langkai, Ishigaki, Palaui and Currimao (Figure 4), based on early bomb-14C spikes from various coral data in the western Pacific (Hirabayashi et al. Reference Hirabayashi, Yokoyama, Suzuki, Miyairi and Aze2017a; Fallon and Guilderson Reference Fallon and Guilderson2008; Andrews et al. Reference Andrews, Asami, Iryu, Kobayashi and Camacho2016; Glynn et al. Reference Glynn, Druffel, Griffin, Dunbar, Osborne and Sanchez-Cabeza2013; Ramos et al. Reference Ramos, Goodkin, Druffel, Fan and Siringan2019). The onset of the early bomb-14C spike and the timing of the spike peak differs slightly in Currimao (this study) vs. Houbihu vs. Palaui (Ramos et al. Reference Ramos, Goodkin, Druffel, Fan and Siringan2019), although these three sites are all located around the Luzon Strait. The onsets of early bomb-14C spike are January 1954 at Houbihu, January 1955 at Palaui, and August 1955 at Currimao. The timing of the highest value of the early bomb-14C spikes are August 1955 at Houbihu and Palaui, and January 1956 at Currimao. Age errors for Houbihu and Paraui are 1 to 2 months (Ramos et al. Reference Ramos, Goodkin, Druffel, Fan and Siringan2019) and 2 months for Currimao as mentioned above, which means the lag of the early bomb-14C spikes among these three sites are a few months to half a year in the onset and timing. This suggests that the oceanography around the Luzon Strait is complex, with large tidal mixing from depths of 100 to 200 m, and mesoscale eddies induced by the Kuroshio intrusion (Nan et al. Reference Nan, Xue, Xiu, Chai, Shi and Guo2011, Reference Nan, Xue and Yu2015). Future investigation will therefore be needed to better understand these dynamics. In contrast to the modeling result published by Andrews et al. (Reference Andrews, Asami, Iryu, Kobayashi and Camacho2016), the Δ14C data from coral obtained from Currimao show clear intrusion of the Kuroshio current, with the Kuroshio Loop Current carrying the radioactive material in near synchrony with the Mindanao Current and the Indonesian Throughflow.
Natural Δ14C variability of the Currimao coral is ± 4.4‰, a figure adopted from the standard deviation of Δ14C variability before 1950. Using this value as noise, we calculated the signal-to-noise ratio for the observed early 14C spikes. The amplitude of the early 14C spike in Currimao is 46‰ (Figure S2) and the signal-to-noise ratio (the amplitude of the early 14C spike divided by the natural Δ14C variability) is 10. The amplitude of the seasonal Δ14C variability at Currimao in the late 1950s and early 1960s after the first 14C spike is almost constant at ˜20‰ (Figure S2), which suggests that seasonal local upwelling at Currimao also remained constant. The amplitudes of the three early 14C seen at Guam (Andrews et al. Reference Andrews, Asami, Iryu, Kobayashi and Camacho2016) were very different, and this was also true at Ishigaki (Hirabayashi et al. Reference Hirabayashi, Yokoyama, Suzuki, Miyairi and Aze2017a) (Figure 4a and 4b). Thus, if seasonal variability at Guam and Ishigaki remained constant as it did at Currimao, the different amplitudes of these spikes reflect the different total yields of the three sets of bomb tests at the U.S. Pacific Proving Grounds (Andrews et al. Reference Andrews, Asami, Iryu, Kobayashi and Camacho2016). Our Currimao coral quite likely captured the second early bomb-14C spike Δ14C in August 1958, which appeared ˜1.25 year after the second spike in Guam. This time lag between Guam and Currimao are almost same as the first spike of ˜1.28 year. However, because of the larger seasonal Δ14C differences observed beginning in 1955 (Figure 3), the second and third 14C spikes could not be recognized clearly in Currimao. This result is similar to that reported from Langkai (Fallon and Guilderson Reference Fallon and Guilderson2008) (Figure 4d).
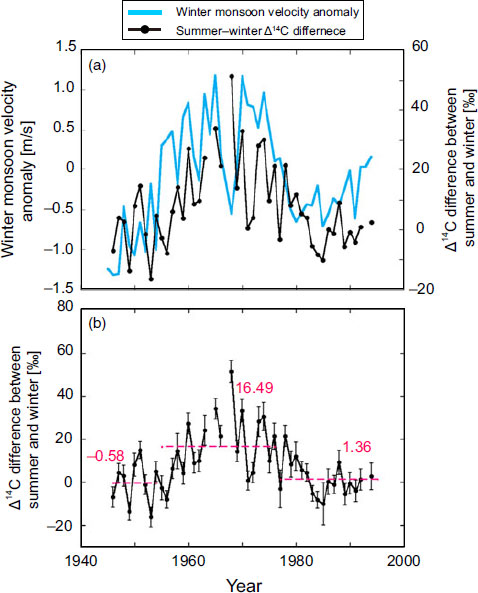
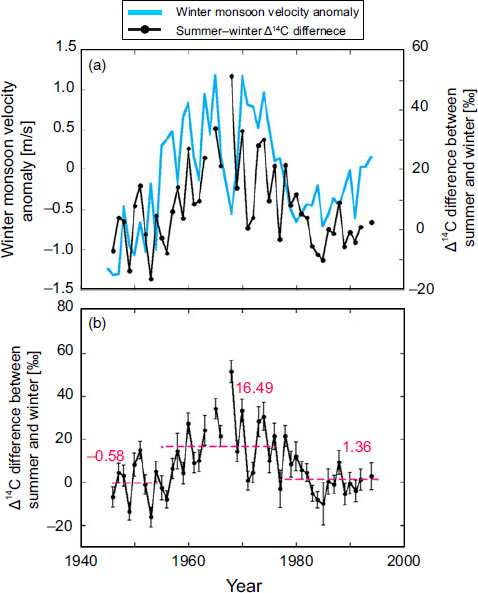
(a) Variation in yearly winter monsoon velocity anomaly from 1946 to 1994 (blue) as reconstructed by Song et al. (Reference Song, Peng, Zhou, Liu, Liu and Chen2012) and seasonal Δ14C difference of the Currimao coral (black). A positive correlation (R = 0.43, n = 46, p << 0.01) between winter monsoon velocity anomaly and seasonal Δ14C difference at Currimao was observed during 1946–1994. (b) Seasonal Δ14C difference in the Currimao coral. Red dotted lines and numbers show the average Δ14C difference for each period.
The amplitude of the first 14C spike in Currimao (46‰) is lower than that in Ishigaki (102‰) (Figure 4a and 4b), despite sharing a water-mass origin (i.e., the Kuroshio Current). The bomb-14C -labeled water from “close-in fallout” was transported westward via the NEC to the east of the Philippines and bifurcated into the northward-flowing Kuroshio Current. The Kuroshio then flowed northward along the Philippine coast and Ryukyu Island, and also intruded into the Luzon Strait. The strong dilution of the bomb-14C spike can be understood if (1) the 14C content in by the Kuroshio intrusion was substantially lower than in the Kuroshio Current and (2) upwelling around Luzon Island diluted the 14C content of the surface water.
Luzon Island is one of the major upwelling areas related to the EAWM and the Kuroshio intrusion, likely causing the dilution of the Δ14C signal through the addition of low-Δ14C subsurface waters. However, it is difficult to explain the dilution of the early bomb-14C spike by more than 50‰ using only the water upwelled off Luzon Island. For example, around Hon Tre Island, Vietnam, upwelling by Ekman transport is thought to be limited to the upper 100 m of the water column (Dippner et al. Reference Dippner, Nguyen, Hein, Ohde and Loick2007; Barthel et al. Reference Barthel, Rosland and Thai2009; Bolton et al. Reference Bolton, Goodkin, Druffel, Griffin and Murty2016). Bolton et al. (Reference Bolton, Goodkin, Druffel, Griffin and Murty2016) reported the seasonal Δ14C variability was ˜18‰ at Hon Tre Island, which is one of the strongest upwelling areas in the SCS during the summer. Lu et al. (Reference Lu, Yan and Jiang2015) used a coupled physical-biological model to show that nutrients were upwelled from a deep layer, about 90 m, into the upper roughly 30 m layer along the northwest margin of Luzon Island. Based on the depth profile of Δ14C values for DIC in seawater near Okinawa Island reported by Ge et al. (Reference Ge, Wang, Zhang, Luo and Xue2016), Δ14C values at the sea surface can change by ˜5‰ when local vertical mixing induced mixing of the surface water mass with 20% of the water mass originating at 150 m depth. Recently, Ramos et al. (Reference Ramos, Goodkin, Druffel, Fan and Siringan2019) modeled the water exchange rate at the Luzon Strait using a box model based on Δ14C data from corals, atmosphere, and seawater. They calculated Δ14C in subsurface waters from along the Kuroshio path from 100 to 200 m around the Luzon Strait, using datasets from GEOSECS, WOCE, and CLIVAR. According to their assumption, the mean Δ14C difference between surface and subsurface waters at Houbihu, south Taiwan, is 33.5‰ during the period from 1970 to 1994. Therefore, it remains difficult to explain the dilution of ˜50‰ difference between Ishigaki and Currimao using the upwelling around Luzon Island alone.
To explain the ˜50‰ dilution of bomb-14C spike, transport of the Kuroshio intrusion into the SCS should be considered. Kuroshio transport varies seasonally, and is stronger in winter and spring and weaker in summer and fall at the Luzon Strait entrance in response to the East Asian monsoon (Lien et al. Reference Lien, Ma, Cheng, Ho, Qiu, Lee and Chang2014; Nan et al. Reference Nan, Xue and Yu2015). Various estimates for transport of the Kuroshio and the Kuroshio intrusion into the SCS have been reported. Estimates of Kuroshio transport span a wide range from 14 to 30 Sv (Sverdrup Reference Sverdrup1942; Nitani Reference Nitani, Stommel and Yoshida1972; Qu et al. Reference Qu, Mitsudera and Yamagata1998; Lukas Reference Lukas, Steele, Thorpe and Turekian2001; Yaremchuk and Qu Reference Yaremchuk and Qu2004; Lien et al. Reference Lien, Ma, Cheng, Ho, Qiu, Lee and Chang2014). Estimates of annual transport into the SCS by the Kuroshio intrusion range from 0.5 to 12.4 Sv (Nan et al. Reference Nan, Xue and Yu2015). Ramos et al. (Reference Ramos, Goodkin, Druffel, Fan and Siringan2019) estimated the mean water exchange from 1970 to 1999 across the Luzon Strait to be 2.2 ± 5.2 Sv. Winter transport of the Kuroshio intrusion into the SCS based on observations is estimated to be 3.4 to 13.7 Sv (Wyrtki Reference Wyrtki1961; Chu and Li Reference Chu and Li2000; Qu Reference Qu2000; Lan et al. Reference Lan, Bao and Gao2004). The early bomb-14C spike in the Currimao coral occurred in winter, when the Kuroshio intrusion into the SCS was strong. In this scenario, about half of the 14C-labeled water mass from Kuroshio intruded into the Luzon Strait and was diluted by upwelling around Luzon Island, resulting in the half amplitude of the early bomb-14C spike in Currimao relative to that in Ishigaki. To evaluate the quantitative distribution of bomb-14C labeled water that originated from “close-in fallout” transported by ocean currents, more 14C data at high-resolution needed from a wider area in the western Pacific, especially along the NEC and Kuroshio current.
Bomb-Curve
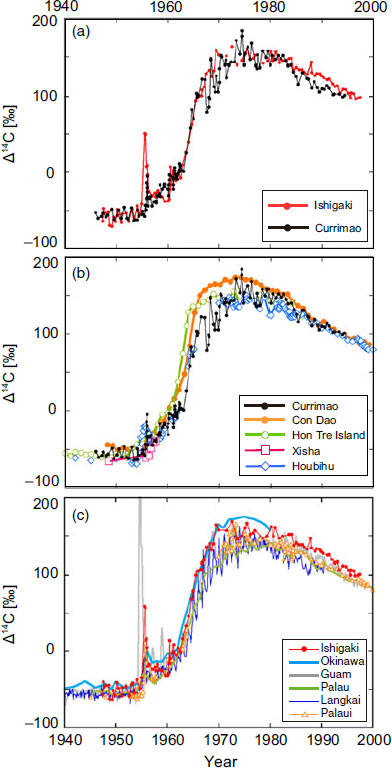
The Δ14C values in the Currimao coral increased from −31‰ to 184‰ during the 1960s and 1970s and similar curves are observed in other post-bomb records from the western Pacific and SCS, such as Okinawa (Konishi et al. Reference Konishi, Tanaka and Sakanoue1981), Guam (Andrews et al. Reference Andrews, Asami, Iryu, Kobayashi and Camacho2016), Palau (Glynn et al. Reference Glynn, Druffel, Griffin, Dunbar, Osborne and Sanchez-Cabeza2013), Langkai (Fallon and Guilderson Reference Fallon and Guilderson2008), Hon Tre Island (Bolton et al. Reference Bolton, Goodkin, Druffel, Griffin and Murty2016), Con Dao (Mitsuguchi et al. Reference Mitsuguchi, Dang, Kitagawa, Yoneda and Shibata2007), Houbihu and Palaui (Ramos et al Reference Ramos, Goodkin, Druffel, Fan and Siringan2019) (Figure 2). A comparison of bomb Δ14C curves from Currimao with those of the previously published the start of the first Guam peak datasets indicates that the Δ14C per-year increases in SCS corals from Currimao, Hon Tre Island (Bolton et al. Reference Bolton, Goodkin, Druffel, Griffin and Murty2016), and Con Dao (Mitsuguchi et al. Reference Mitsuguchi, Dang, Kitagawa, Yoneda and Shibata2007)) are higher than those from Pacific corals reported from Ishigaki (Hirabayashi et al. Reference Hirabayashi, Yokoyama, Suzuki, Miyairi and Aze2017a), Guam (Andrews et al. Reference Andrews, Asami, Iryu, Kobayashi and Camacho2016), Langkai (Fallon and Guilderson Reference Fallon and Guilderson2008), and Palau (Glynn et al. Reference Glynn, Druffel, Griffin, Dunbar, Osborne and Sanchez-Cabeza2013) (Figure 2). The steep part of the bomb curve in corals (1960–1970) mainly reflects the input of bomb 14C into the surface ocean. The bomb curve from 1960 to 1965 in the SCS shows a steep slope (23.9 ± 8.0‰/yr) but a gentler slope after 1965 (5.9 ± 2.4‰/yr). The average slope value in the Pacific from 1960 to 1965 is 15.1 ± 2.6‰/yr, but the slopes after 1965 are higher (14.1 ± 1.3‰/yr) than in the SCS (Table S3). We do not include the data from Houbihu and Palaui (Ramos et al. Reference Ramos, Goodkin, Druffel, Fan and Siringan2019) for the above calculations because their data are not continuous from 1960 to 1970.
(a) Δ14C data for corals from Currimao (black) and Ishigaki (red) (Hirabayashi et al. Reference Hirabayashi, Yokoyama, Suzuki, Miyairi and Aze2017a). Δ14C comparison (b) in the South China Sea from Currimao (this study), Con Dao (Mitsuguchi et al. Reference Mitsuguchi, Dang, Kitagawa, Yoneda and Shibata2007), Hon Tre Island (Bolton et al. Reference Bolton, Goodkin, Druffel, Griffin and Murty2016), Xisha (Southon et al. 2002) and Houbihu (Ramos et al. Reference Ramos, Goodkin, Druffel, Fan and Siringan2019); and (c) in the western Pacific from Ishigaki (Hirabayashi et al. Reference Hirabayashi, Yokoyama, Suzuki, Miyairi and Aze2017a), Okinawa (Konishi et al. Reference Konishi, Tanaka and Sakanoue1981), Guam (Andrews et al. Reference Andrews, Asami, Iryu, Kobayashi and Camacho2016), Palau (Glynn et al. Reference Glynn, Druffel, Griffin, Dunbar, Osborne and Sanchez-Cabeza2013), Langkai (Fallon and Guilderson Reference Fallon and Guilderson2008), and Palaui (Ramos et al. Reference Ramos, Goodkin, Druffel, Fan and Siringan2019).
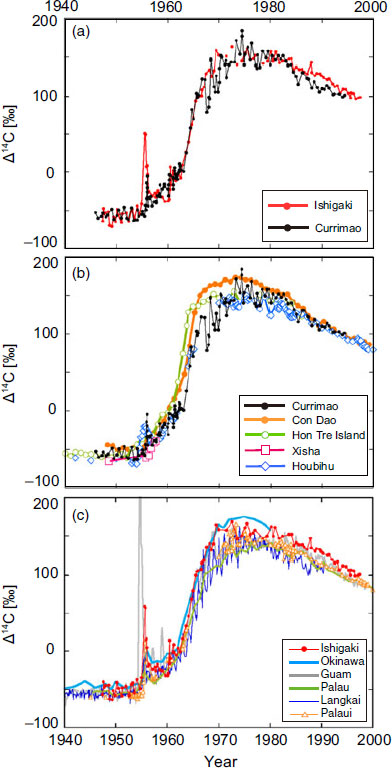
The bomb 14C of SCS increase in the SCS is steeper relative to the Pacific because the shallow water mass in the SCS is stirred by the East Asian monsoonal winds, which enhance the atmosphere-ocean CO2 exchange. This effect likely enhanced equilibration with respect to gas exchange between the atmosphere and ocean, producing an early 1960s Currimao 14C bomb-curve steeper than that of the western Pacific. Figure 3 and Figure S4 shows seasonalΔ14C fluctuations in the Currimao record peaking around 1965 when atmospheric 14C had reached its maximum and was no longer increasing (Figure S3). If those fluctuations are a signal of stronger upwelling, increased dilution of surface layer 14C may have caused the reduced slope in the Currimao record that occurred after 1966. Similarly, the rate of Δ14C increase at Hon Tre Island after 1966 was lower than that in the Pacific (Figure 2), possibly due an enhancement of the upwelling that occurs at ˜12°N (Bolton et al. Reference Bolton, Goodkin, Druffel, Griffin and Murty2016) driven by wind stress in the central SCS (Hein Reference Hein2008).
Seasonal Variability in the Coral from Currimao
Trends in Δ14C, higher in summers and lower in winters, were observed in the Currimao coral. We calculated the difference in Δ14C between summer and winter within the same year (Figure 3) to examine the seasonality of Δ14C in Currimao. The average Δ14C difference between summer and winter is 7.6 ± 14.0‰ from 1946 to 1994. The pattern shown by the Δ14C differences between summer and winter indicates three distinct periods: 1945–1954, 1956–1976, and 1977–1994. The period from 1955 to 1976 is characterized by larger differences (average Δ14C difference = 16.48‰), whereas the periods 1945–1954 and 1977–1994 show smaller differences (average Δ14C differences = −0.58‰ and 1.36‰, respectively) (Figure 3b).
The seasonal Δ14C variability around Currimao can be explained by winter-time upwelling driven by the East Asian Winter Monsoon (EAWM) and/or mesoscale eddies induced by Kuroshio intrusion around Luzon Strait. After the nuclear bomb test, the atmospheric 14C values became much larger than the oceanic 14C due to the time lag caused by atmosphere-ocean CO2 exchange and the largest atmosphere-ocean 14C gradient was recorded in 1963 in Currimao (Figure S3). Based on the atmospheric Δ14C of NH zone 3 (Hua et al. Reference Hua, Barbetti and Rakowski2013) and the Δ14C record from Currimao, average atmosphere-ocean Δ14C differences were 33‰ in 1950–1955, 315‰ in 1955–1977, and 82‰ in 1977–1944. On the other hand, the subsurface water, which is the origin of upwelled water, are not influenced by the atmospheric 14C input directly. Therefore, the seasonal difference between the surface and the subsurface became bigger, and when the upwelling season of winter, the coral skeletal Δ14C values become lower and the other seasons are become higher affected by the large atmosphere-ocean 14C gradient. This is the main reason for the large seasonal 14C difference in 1955–1977.
Upwelling in the SCS is strongly affected by the monsoon as well as by surface ocean circulation in the SCS. For example, strong upwelling off Vietnam, located in the western SCS, occurs in the summer (e.g., Shaw and Chao Reference Shaw and Chao1994; Xie et al. Reference Xie, Xie, Wang and Liu2003; Ndah et al. Reference Ndah, Becek and Dagar2016), due to Ekman transport driven by the East Asian summer monsoon (Dippner et al. Reference Dippner, Nguyen, Hein, Ohde and Loick2007; Barthel et al. Reference Barthel, Rosland and Thai2009). Bolton et al. (Reference Bolton, Goodkin, Druffel, Griffin and Murty2016) reported seasonal Δ14C variability of the ˜18‰ for the year 1969 in a coral from Hon Tre Island, Vietnam—a value similar to observed at Currimao for the same period (Figure 3b). Decadal changes in the strength of the EAWM over the periods 1818–1954, 1955–1976, and 1977–2000 (Song et al. Reference Song, Peng, Zhou, Liu, Liu and Chen2012) probable drove changes in upwelling intensity in the SCS over these same intervals. This in turn affected the changes in seasonal Δ14C differences in Currimao (Figure 3), as shown by the positive correlation that exists from 1945 to 1994 (R = 0.43, n = 46, p << 0.01) (Figure 3a) between the seasonal Δ14C differences and the winter monsoon velocity, as reconstructed by Song et al. (Reference Song, Peng, Zhou, Liu, Liu and Chen2012). This correlation indicates that the EAWM is one of the factors in seasonal water-mass fluctuations (Hirabayashi et al. Reference Hirabayashi, Yokoyama, Suzuki, Miyairi, Aze, Siringan and Maeda2017b) and thus contributed to the seasonal Δ14C variability in Currimao in the post-bomb period, though the atmosphere-ocean Δ14C gradient was the dominant factor.
CONCLUSION
High-resolution Δ14C data from 1946 to 1994 for the Currimao coast on the northwest margin of Luzon Island are reported. These are the first data to report seasonal-scale 14C variability for 50 years and detect the early bomb-14C spike related to the “close-in fallout” from July 1955 to January 1957 in the SCS. Although three early bomb-14C spikes have been reported from Guam (Andrews et al. Reference Andrews, Asami, Iryu, Kobayashi and Camacho2016) and from Ishigaki (Hirabayashi et al. Reference Hirabayashi, Yokoyama, Suzuki, Miyairi and Aze2017a), only one such spike was clearly detected in the Currimao data. The amplitude of the bomb-14C spike in Currimao was less than half that in Ishigaki, likely due to upwelling around Luzon Island and the Kuroshio intrusion into the SCS. These new data from the area of the Kuroshio intrusion will contribute to improving our knowledge of oceanographic circulation in the SCS and the Kuroshio region.
ACKNOWLEDGMENTS
We thank constructive comments from Dr. John Southon and two anonymous reviewers that improved the manuscript. We thank T. Kobayashi, Y. Yoshinaga, and T. Okai for field and laboratory assistance. K. Yokoyama and H. Adachi are thanked for their help during sampling. We would like to thank proofreading service Enago for the English language review. This work was supported by a grant from the Japan Society for the Promotion of Science (JSPS) KAKENHI (15KK0151, 17H01168) and JSPS Fellows DC1 (JP14J09489).
SUPPLEMENTARY MATERIAL
To view supplementary material for this article, please visit https://doi.org/10.1017/RDC.2019.145