


The widespread adoption of gender quotas is one of the most important political developments of the modern era. As these reforms have spread around the world, there is increasing interest in their broader consequences (Bauer Reference Bauer2012; Franceschet, Krook, and Piscopo Reference Franceschet, Krook and Piscopo2012). A large body of work has explored their effectiveness in increasing women's presence in legislatures (Jones Reference Jones2009; Krook Reference Krook2009; Matland Reference Matland and Dahlerup2006; Paxton, Hughes, and Painter Reference Paxton, Hughes and Painter2010; Schwindt-Bayer Reference Schwindt-Bayer2009; Tripp and Kang Reference Tripp and Kang2008). Other research documents their influence on the representation of women's interests (Beaman et al. Reference Beaman, Chattopadhyay, Duflo, Pande and Topalova2009; Chattopadhyay and Duflo Reference Chattopadhyay and Duflo2004; Devlin and Elgie Reference Devlin and Elgie2008; Franceschet and Piscopo Reference Franceschet and Piscopo2008; Kerevel and Atkeson Reference Kerevel and Atkeson2013). Still others examine the symbolic effects of quotas, including their impact on women's career ambitions (Beaman et al. Reference Beaman, Duflo, Pande and Topalova2012) and political participation and engagement (Barnes and Burchard Reference Barnes and Burchard2013; Clayton Reference Clayton2015; Kittilson and Schwindt-Bayer Reference Kittilson and Schwindt-Bayer2012), as well as beliefs about women's ability to govern (Alexander Reference Alexander2012).
Despite our growing understanding of quotas’ broader effects, their influence on women's appointment to higher political office remains unknown. In particular, no study has yet considered whether quotas help or hinder women's selection to, and survival in, leadership posts within political organizations. This is a surprising oversight, not only because of the relationship between women's access to higher office and women's descriptive, substantive, and symbolic representation, but also in light of the conflicting expectations generated by the literature. On the one hand, quotas may increase the supply of women eligible for intraparty leadership roles, resulting in a positive acceleration effect on women's access to top political posts. On the other hand, both scholars and activists have linked quotas to stigmatization and backlash effects. These policies may thus produce a trade-off effect in which short-term gains in women's numeric representation result in longer-term exclusion from positions of authority.
We provide the first empirical analysis of quotas’ influence on women's access to leadership positions within political parties. We consider the possibility of acceleration and trade-off effects with respect to (1) the initial selection of women as leaders, and (2) the reappointment of incumbent female leaders. To better understand the mechanisms underlying our findings—and the generalizability of our results—in an extended analysis we evaluate the impact of quota implementation on the number of women deemed qualified for leadership posts. This additional work on qualifications addresses both a key intermediary factor determining quotas’ effect on women's access to political leadership and also a central theme in the debate surrounding gender quotas more broadly.Footnote 1
Our analysis focuses on a case study that offers a novel estimation strategy and compelling data. The empirical design addresses the concern that quotas may be adopted by parties that are more positively disposed towards women in leadership, or among those with powerful female members who aspire to these posts. We sidestep this endogeneity issue by examining a gender quota that was exogenously imposed on 290 local Swedish Social Democratic parties by the national party organization in 1994. This 50–50 “zipper” quota required the alternation of male and female names on ordered party ballots. For all leadership appointments between 1988 and 2010, we identify the leader of each local party—the top candidate on its electoral ballot, who acts as its main spokesperson—as well as the socioeconomic background characteristics (including sex, age, education, income, and occupation) of every Social Democratic politician in the municipality. The breadth and depth of the dataset allows us to conduct a difference-in-difference analysis that compares the likelihood of the selection and reappointment of female leaders within each local party before and after quota implementation.
Combining the exogenous assignment of the local-level quota policy with a difference-in-difference estimation strategy allows us to treat our data as a natural experiment. We then establish whether quotas lead to acceleration or trade-off effects and assess their mediating influence on the pool of prospective party leaders. We show that municipalities in which the quota had a greater impact on women's descriptive representation experienced comparatively larger gains in the probability of selecting (but not reappointing) female leaders. Quotas are thus positively associated with women's appointment to leadership posts, but do not influence the tenure of incumbent women. Having established these baseline effects, we further demonstrate that municipalities in which the quota had a greater effect on the proportion of female candidates also experienced larger gains in both the number and share of qualified prospective female leaders. This strengthening of the candidate pool likely contributed to the acceleration effect in the Swedish case. We posit that similar results will hold for other quotas that markedly increase the supply of women perceived as qualified for executive and intraparty leadership posts.
Our results help dispel the myth that electoral affirmative action policies necessarily result in losses in women's access to power. On the contrary, quotas can facilitate the promotion of women, which in turn can have tremendous practical and symbolic consequences. By bolstering women's appointment to leadership positions, quotas likely have knock-on effects related to the selection of female legislative candidates and ministers (Cheng and Tavits Reference Cheng and Tavits2011; Kittilson Reference Kittilson2006; Niven Reference Niven1998), as well as on the content of the policy agenda (Kittilson Reference Kittilson2011; McAllister Reference McAllister, Dalton and Klingemann2007; Poguntke and Webb Reference Poguntke and Webb2005). Though our empirical analysis focuses on one quota policy in a single country, our conceptual framework and findings are broadly applicable and make an important contribution to the growing set of work on electoral reform, political representation, gender and politics, and quota impact.
QUOTAS AND FEMALE PARTY LEADERSHIP
Over 75 countries, and more than 130 political parties, have adopted quota policies aimed at augmenting women's numerical, or descriptive, representation (Krook Reference Krook2009; International IDEA 2015). In response to the rapid diffusion of these transformative electoral reforms, a large body of research has examined whether—and in which cases—quotas successfully increase women's numbers in legislatures. Though we now know a great deal about quotas’ influence on women's initial access to elected office, their subsequent effects on women's ascension to positions of power within the political hierarchy are unknown. Yet, control of the agenda by party leaders, combined with executive dominance, increasingly limits the role of rank-and-file legislators. In political parties generally, and parliamentary systems in particular, power is now often concentrated in the hands of a subset of elites.
Among these political elites, party leaders have become especially important. As “the central political figures” in many democracies (Cross and Blais Reference Cross and Blais2012, 1), they shape their organizations’ vote, office, and policy-seeking aims. Leaders, for example, constitute an important reason why citizens vote for (or against) a party (Bittner Reference Bittner2011; Stewart and Clarke Reference Stewart and Clarke1992). They influence their parties’ policy positions (Harmel et al. Reference Harmel, Heo, Tan and Janda1995) and wield significant control over their copartisans’ career paths (Bille Reference Bille2001; Dowding and Dumont Reference Dowding, Dumont, Dowding and Dumont2009). In the Swedish municipalities considered in this study, party leaders play a key role in formulating their parties’ policy platforms and serve as their main spokespersons. The most important government position available to the party when in office, moreover, is typically reserved for the party leader. At the national level, for example, the leader of the largest coalition party generally serves as prime minister. In Swedish subnational politics, this leader acts as executive committee chairperson, which is equivalent to mayor. When in opposition, she typically serves as vice chairperson of the council board.
For those concerned with gender equality in politics, it is crucial to determine the circumstances under which women can access and retain positions of authority within their political parties (and, consequently, in the executive branch) (O’Brien Reference O’Brien2015). If quotas constrain women's access to powerful positions—and thus trade long-term opportunities to ascend the political ladder for short-term gains in low-level positions—then these policies may undercut the very goals they aim to advance. On the other hand, if quotas enhance women's career opportunities, these reforms may hold even greater promise for breaking entrenched patterns of male domination than previously thought. In the following subsections we draw on a wide body of theoretical and empirical research to hypothesize both positive and negative effects of quotas on women's ascension to, and survival in, political leadership positions.
Acceleration Effects: Quotas Promoting Women's Access to Power
Gender quotas may accelerate women's access to (and survival in) leadership positions by increasing both the supply of, and demand for, female leaders. Women's presence in legislatures is already positively correlated with women's access to parties’ national executive committees (Kittilson Reference Kittilson2006), cabinets (Escobar-Lemon and Taylor-Robinson Reference Escobar-Lemon and Taylor-Robinson2005; Krook and O’Brien Reference Krook and O’Brien2012; Reynolds Reference Reynolds1999), and even the posts of head of government and state (Jalalzai Reference Jalalzai2013). As more women enter legislative politics via quota policies, these broader trends suggest that the number of female leaders will similarly increase.
Acceleration effects are especially likely to emerge if quotas augment and improve the pool of female candidates for leadership posts. Despite the concern that quotas bring undeserving or unambitious female candidates into political office,Footnote 2 empirical studies typically find that women elected via these policies are as (or even more) qualified as their colleagues. Comparing the backgrounds, demographic characteristics, and political experiences of Ugandan legislators, O’Brien (Reference O’Brien, Franceschet, Krook and Piscopo2012) shows that women elected via quotas meet or exceed the standards set by their nonquota counterparts. Other works demonstrate a positive link between politicians’ education levels and quota implementation (Baltrunaite et al. Reference Baltrunaite, Bello, Casarico and Profeta2014; Casas-Arce and Saiz Reference Casas-Arce and Saiz2011). Still others illustrate that women who are elected via quotas are at least as efficient as legislators as their male peers, and even outpace men on some measures of competency (Murray Reference Murray2010; Weeks and Baldez Reference Weeks and Baldez2015). In both the developed and developing world, quotas have even been found to foster female politicians’ political ambition (Geissel and Hust Reference Geissel and Hust2005). Together, these works show that quotas may bring more qualified women into the candidate pool for leadership posts, which could in turn increase the probability that a woman will be chosen to head her party. If the women selected via quotas are especially competent, moreover, these policies may also extend female leaders’ tenures in office (Fischer, Dowding, and Dumont Reference Fischer, Dowding and Dumont2012).
Quotas may not only alter the supply of potential female leaders; they may also generate greater demand for women in these posts. Increasing the proportion of female politicians may produce changes in the culture, norms, and behaviors within political parties and legislative assemblies (Dahlerup Reference Dahlerup1988). Research on female politicians in postsocialist countries suggests, for example, that women's inclusion in legislative politics changed the institutional culture in those parliaments (Galligan, Clavero, and Calloni Reference Galligan, Clavero and Calloni2007). Britton (Reference Britton2005) similarly highlights the myriad of ways in which a large influx of female legislators created a more “women-friendly” environment in the South African parliament, including changes to the institution's “hours, calendar, and climate” and to the form and content of policy debates (126). Indeed, Bauer and Britton (Reference Bauer and Britton2006) point to the positive effects of women's increased descriptive representation on institutional cultures in several African parliaments.
Beyond these broader changes in political culture, exposure to female legislators via quota policies can also make party members more receptive to the idea of a female leader. People in general, and men in particular, are often skeptical about women's leadership abilities. Recent research shows that a principal benefit of quota policies is their medium- and long-term effect on beliefs about the acceptability and legitimacy of women as political actors (Franceschet, Krook, and Piscopo, Reference Franceschet, Krook and Piscopo2012; Tripp, Konate, and Lowe-Morna, Reference Tripp, Konaté, Lowe-Morna and Dahlerup2006). Studies of both Tanzania (Yoon Reference Yoon2011) and Rwanda (Burnet Reference Burnet2011) suggest that quotas have transformed negative cultural and social beliefs about women's participation in politics and granted women access to leadership positions from which they had traditionally been excluded. In India, Bhavani (Reference Bhavani2009) shows that the selection of women as village leaders via a quota policy raised women's election probability even after the quota was removed. Beaman et al. (Reference Beaman, Chattopadhyay, Duflo, Pande and Topalova2009) add that after two randomly assigned election periods of female leadership, villagers’ confidence in female leaders’ competence improved. These exposure effects also appear to operate at the elite level. In Germany, entering parliament as a member of a quota party encourages male legislators’ participation in debates on women's issues, suggesting that quotas may influence male parliamentarians’ attitudes and behaviors (Xydias Reference Xydias2014).
As well as shifting the norms concerning women in political leadership, quotas may also incentivize women to jointly promote each other's (re-)election to top positions. The “critical mass’’ literature is based on the assumption that female legislators will form coalitions once their numbers are sufficiently large. Increasing female representation can thus alter the way in which women conduct politics. Female members of parliament (MPs) describe a feeling of camaraderie once their numbers grow (Grey Reference Grey2002), and women in committees are more likely to be inclusive and collaborative as the percentage of female leaders increases (Rosenthal Reference Rosenthal1998).
While women's greater numbers alone can lead female politicians to work together, quotas may have consequences above and beyond what is achieved by reaching a critical mass of female representatives. By generating “mandate effects” (Franceschet and Piscopo Reference Franceschet and Piscopo2008), quotas may heighten women's “gender consciousness,” making them especially likely to band together in support of prospective or incumbent female leaders. Quota adoption can also serve as a focal point that encourages women's organizing for higher office. When the Swedish Social Democrats introduced their quota, for example, the party's women's association produced a handbook that both encouraged women to nominate female candidates for top positions and provided them with specific advice on how to achieve this aim.
Gender quotas can increase the supply of qualified women in the candidate pool for leadership positions. Exposure to women in politics can also reshape the culture to be more women-friendly and increase the support for (or at least tolerance of) women's ascension to top posts. Quotas may even encourage coalitions to form in support of current (or prospective) female leaders. Together, these claims suggest that introducing a gender quota may accelerate women's access to top positions within political parties and help them remain in these posts for longer periods. These positive outcomes are especially likely to emerge in cases where the quota has a greater impact on women's descriptive representation, and thus generates larger changes in the candidate pool, a stronger push for a more female-friendly culture, and/or greater opportunities for women's mobilization and coalition formation. This leads to the first set of hypotheses concerning quotas’ acceleration effects on women's representation in leadership positions:
H1a Acceleration Effects—Selection: High-impact gender quotas increase the probability that the party will select a female leader.
H1b Acceleration Effects—Reappointment: High-impact gender quotas increase the probability that an existing female leader will be reappointed.
Trade-Off Effects: Quotas Hindering Women's Access to Power
Though quotas may increase women's presence in elected office, in public debates it is often suggested that these policies hurt the very groups they are designed to help. Critics hold that positive discrimination undermines the status and efficacy of the targeted group(s) within the legislature. In other words, women's immediate gains in descriptive representation come at the risk of increased stigmatization that can damage their long-term career prospects.
Social stigma occurs when a majority group assigns negative and stereotypical attributes to minority group members (Link and Phelan Reference Link and Phelan2001). This process has tangible consequences for the lower-status group, which stem both from being subjected to active marginalization by the dominant group(s) and also from minority group members’ internalization of these negative attributes. Women are particularly vulnerable to stigmatization in the political arena. Legislatures are traditionally masculine environments (Diamond Reference Diamond1977; Thomas Reference Thomas1994), and there are gender biases in the personnel, policy, and cultures of political institutions (Lovenduski Reference Lovenduski2005). Bills sponsored by women, for example, are sometimes subjected to greater scrutiny, hostility, and debate than male-sponsored legislation (Kathlene, Clarke, and Fox Reference Kathlene, Clarke, Fox and Dodson1991). Male legislators also pressure women to focus on traditionally feminine issue areas, while maintaining their dominance in high-prestige policy domains (Schwindt-Bayer Reference Schwindt-Bayer2006). In discussions, female politicians sometimes find it difficult to make their opinions heard, and have even reported being subjected to bullying by male legislators (Galligan, Clavero, and Calloni Reference Galligan, Clavero and Calloni2007). Indeed, women speak substantially less than men in most mixed-gender settings (Karpowitz, Mendelberg, and Shaker Reference Karpowitz, Mendelberg and Shaker2012).
The threat of stigmatization may also be especially acute for female politicians elected via quota policies (Dahlerup and Freidenvall Reference Dahlerup and Freidenvall2010, 42). Central to the debates surrounding quotas is the assumption that they promote undeserving female candidates at the expense of more meritorious male politicians. Women who enter an organization with the help of affirmative action policies are frequently ascribed negative attributes, including accusations that they have not “earned” their post or are less competent than their nonquota counterparts (Murray Reference Murray2010).
Interviews with “quota women” in both developed and developing states indeed indicate that they experience stigmatization. Franceschet and Piscopo (Reference Franceschet and Piscopo2008) note that several female legislators in Argentina felt that the quota law resulted in their political professionalism being called into question, which in turn undercut coalition-building opportunities. Childs and Krook (Reference Childs, Krook, Franceschet, Krook and Piscopo2012) similarly reveal that women in the British parliament—especially those elected via the Labour Party's all-women shortlists—experienced social stigma. While some perceived these differences as narrowing over time, others experienced lingering stigmatization. Women in reserved seats in Tanzania likewise reported being treated as “second-class” MPs and feeling that their work did not receive sufficient recognition (Yoon Reference Yoon2011).Footnote 3
As well as stigmatization, sudden increases in the number of women in elected office can generate adverse reactions from their male colleagues. As a minority group's presence grows, group members are likely to bolster their claims on limited political resources. To protect their power, male elites may attempt to limit the authority of female entrants and sideline women as a group. Men have been shown, for example, to become more verbally aggressive and controlling of both committee hearings (Kathlene Reference Kathlene1994; Rosenthal Reference Rosenthal1998) and parliamentary debates (Grey Reference Grey2002) following an expansion in the proportion of women in the legislature. Kanthak and Krause (Reference Kanthak and Krause2012) find that men devalue their female colleagues as the proportion of women in the US Congress increases. Large numbers of female legislators have similarly been tied to both women's diminished success in passing legislation (Bratton Reference Bratton2005) and reduced chances of being appointed to “masculine” and “powerful” committees (Barnes Reference Barnes2014; Reference Barnes2016; Heath, Schwindt-Bayer, and Taylor-Robinson Reference Heath, Schwindt-Bayer and Taylor-Robinson2005; Towns Reference Towns2003). Quotas may not only limit female politicians’ access to power; they may also shorten their tenure in leadership posts. Weeks and Baldez (Reference Weeks and Baldez2015) demonstrate, for example, that due to elite discrimination—and despite their success as legislators—women selected via the Italian quota policy were significantly less likely than their nonquota counterparts to be re-elected to office.
In addition to stigmatization and backlash effects, sudden increases in women's descriptive representation can also create barriers to female politicians’ organizational efforts. While the critical mass literature suggests that women will work together once their numbers are sufficiently large, studies examining both women's substantive representation (Childs and Krook Reference Childs and Krook2009; Grey Reference Grey2002) and access to leadership posts (Bratton Reference Bratton2005) have failed to find support for these coordination effects. Kanthak and Krause (Reference Kanthak and Krause2012) even suggest that female legislators are less supportive of their female copartisans when women's numbers are greater (as indicated by data on donations to fellow politicians). Increasing women's descriptive representation thus does not guarantee that women will join forces to achieve common ends (Beckwith and Cowell-Meyers Reference Beckwith and Cowell-Meyers2007). Indeed, there are examples of women within the same party simultaneously pursuing different aims, even on issues related to women's descriptive (Evans Reference Evans2011) and substantive (Smooth Reference Smooth2011; Xydias Reference Xydias2014) representation.
Male legislators’ active and passive marginalization of women following large increases in their representation—combined with women's internalized stigmatization and limited capacity to cooperate—can together undermine women's advancement up the political ladder following quota adoption. These factors may also jeopardize female leaders’ survival in these posts. Just as with the acceleration effects hypothesized above, moreover, these negative repercussions are likely to be greatest when the quota has a larger effect on the proportion of elected women. That is, quotas may result in a trade-off between an increase in women's representation in the legislature and their subsequent access to leadership posts. This suggests a second set of hypotheses:
H2a Trade-Off Effects—Selection: High-impact gender quotas decrease the probability that the party will appoint a female leader.
H2b Trade-Off Effects—Reappointment: High-impact gender quotas decrease the probability of reappointment of an existing female leader.
GENDER QUOTAS AND POLITICS IN SWEDEN
To test these competing expectations about quotas’ effects on women's political leadership, we examine the prevalence and survival of female party leaders in 290 Swedish municipalities before and after gender quota implementation. Focusing on a single country allows us to hold constant state- or region-level features that might lead to the simultaneous adoption of a quota and promotion of female leaders. Among the 70 countries implementing subnational quota policies (International IDEA, 2015), Sweden is an ideal case for comparing our rival hypotheses. Sweden's political institutions—including its party-list electoral system and the significant powers vested in local leaders—make the results generalizable to other states. As over twenty years have passed since quota implementation, the Swedish case also allows us to assess the short- and medium-term consequences of quota adoption. Most importantly, the Social Democrat's zipper quota emerged from the national party board in response to events wholly unrelated to the municipal parties. The local-level quota can therefore be thought of as exogenously assigned, which allows us to make stronger causal claims about the impact of quotas on women's access to higher office.
The Quota Policy
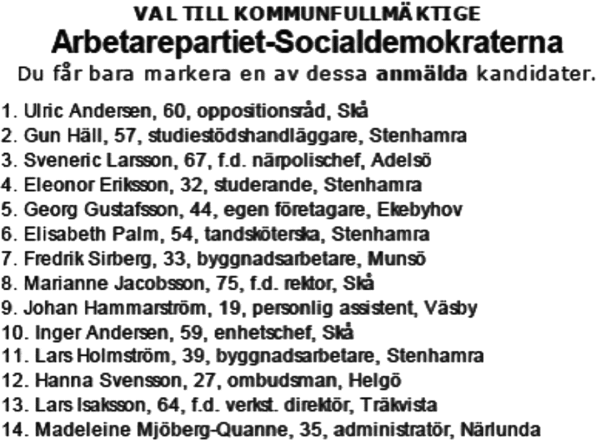
In 1993 the Swedish Social Democratic Party introduced zippered party lists. This policy—which requires all party lists to alternate between male and female candidates—was adopted in response to events in the national political arena. The party's previous quota policy (a target of 50% women on the ballot) had not increased numeric representation. A fall in the share of female parliamentarians between 1988 and 1991 prompted a heated debate in which a network of prominent women threatened to form a new feminist political party. They explicitly demanded that parties give women half of the political power by providing them with positions high up on the party ballots. The risk of losing both politicians and voters to the new party motivated the Social Democrats to adopt a zipper provision. Local parties were asked to compose two separate lists of candidates, one male and one female, and then “zip” these together to produce the final list (see Figure 1).
Example of “Zipped” Social Democratic Party Ballot from the Ekerö Municipality in the 2006 Election

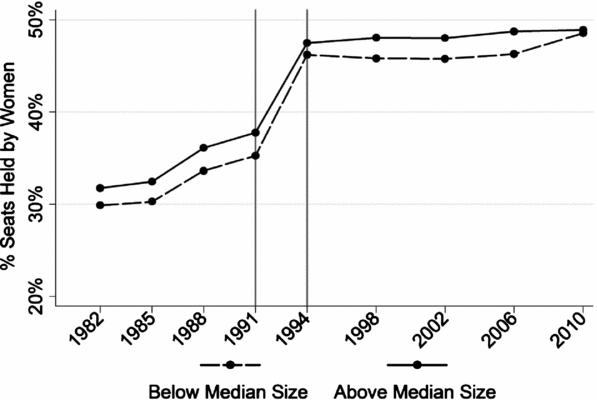
The adoption and implementation of the Swedish 50–50 subnational level quota was unrelated to municipal or local-level party features, including attitudes towards gender equality and women's political representation. Indeed, when the quota policy was adopted, there was a great deal of variation in municipal Social Democratic parties’ behavior towards women. Some were progressive and inclusive, while others excluded women from power. Yet all local parties were required to alternate male and female candidates on their electoral ballots. Figure 2 shows that the quota substantially affected women's numeric representation in the local-level parties. It also shows that these increases were not limited to either small (rural) or large (urban) localities. Both above- and below-median-sized municipalities experienced a 10% jump in the average proportion of elected women in the year the policy was first applied.
Trends in Women's Numeric Representation in Local-Level Social Democratic Parties

The high variation in local parties’ initial positions, combined with the near-universal implementation of the electoral affirmative action policy, together resulted in a quota that had widely disparate effects. For parties that were already near parity, this policy had little influence on women's descriptive representation. For parties that had previously excluded women, the quota radically increased the number of female representatives.
The Swedish Social Democrats’ local-level zipper quota thus provides a unique opportunity for studying policy impact. The exogenous assignment of this 50–50 quota allows us to circumvent the concern that these policies are primarily implemented by parties that are already accepting of women in leadership, or whose female members aspire to these posts. With data on leadership appointments ranging from 1988 to 2010, moreover, we are able to examine women's access to leadership posts within each municipality over time. That is, in each local party we can compare the likelihood of selecting and reappointing female leaders before and after the quota was implemented in 1994. This allows us to determine whether, and to what extent, “quota impact”—i.e., the change in women's descriptive representation following quota implementation—increases or decreases the probability of selecting and reappointing female leaders within each local party. This prepost comparison further ensures that the impact of the quota within each municipality is unrelated to trends in women's political leadership that began in the pre-quota era.
Swedish Political Institutions
We examine trends in women's representation across Swedish local-level Social Democratic parties over seven elections. The 290 municipalities considered vary in size from approximately 3,000 to 800,000 citizens. They are parliamentary democracies with list proportional representation electoral systems. This is the most common voting method in the world, and is especially prevalent in countries implementing both voluntary and statutory gender quotas.
Local legislative bodies are called municipal assemblies, and their boards are the local equivalent of the national government. Compared to other countries, these local governments have substantial economic powers. Their public expenditures account for one-fifth of Swedish GDP, and they employ over one-fifth of the country's labor force. Each municipality also sets its own income tax rate, which is usually around 20%. The main political responsibilities of these municipal governments lie in the areas of education, elder care, and childcare, though they also handle issues such as building permits, transport, and infrastructure.
All eight political parties represented in the national parliament are typically represented in municipal assemblies. Most municipalities also have smaller local parties, which hold an average of 2% of seats. Nominating these representatives is a highly local affair. Parties are decentralized and there is a strong culture of local autonomy. The Social Democrats’ party lists, for example, are composed in three steps. First, a group of potential candidates is selected from among the party membership by internal nominations from the local party “clubs” and under the administration of a selection committee. These clubs organize party members, each of whom belongs to at least one club based on geography (neighborhood) and usually at least one fractional club (most commonly a youth, women’s, or union club). In a second step, the selection committee uses these nominations to assemble a preliminary list that, in the third step, is subject to a vote in a party member meeting.
Elections to the municipal assemblies occur at the same time as the national elections and have historically had a turnout of approximately 90% of eligible voters. They were held every third year prior to 1993, and every fourth year thereafter. While most municipal politicians maintain a “day job” on the side, the leaders of the two largest local parties are often full-time politicians, which gives them a great deal of influence over the political process compared to other assembly members. Combined with the municipal governments’ economic power, the position of local leader is a politically important post. Indeed, a leadership position in a large municipality is generally considered to be more influential than a rank-and-file seat in the national parliament.
TESTING QUOTAS’ EFFECTS ON FEMALE LEADERS’ SELECTION AND SURVIVAL
In addition to offering a natural experiment, focusing on Sweden allows us to draw on one of the most comprehensive datasets of elected officials ever constructed. By law, all Swedish electoral ballots must be registered with the country's electoral agency, and parties must report each candidate's social security number. Using this information for the seven elections held between 1988 and 2010, each politician was linked to his or her administrative records kept by Statistics Sweden. This information is collected by various Swedish public offices (including the tax authority, school authority, and population register) and is therefore not self-reported and does not contain any missing values. The dataset thus consists of highly accurate annual data on the background and socioeconomic characteristics of each politician listed on a Social Democratic ballot between 1988 and 2010. The breadth and depth of its coverage is unparalleled, and no other case provides such rich information on such a large set of politicians.
Measuring Female Leadership and Survival
Our first dependent variable is a binary indicator that takes a value of 1 if the leader of the municipal Social Democratic Party is a woman. As previously noted, we identify the leader as the candidate occupying the top position on the party ballot.Footnote 4 These top-ranked candidates are almost always awarded the most desirable appointment available to each party in the municipal political hierarchy, which we verified using data on appointments following the 2006 and 2010 elections.Footnote 5 Given the power of the Social Democratic Party in Swedish politics, the local leader will almost always serve as either the chairperson or vice chairperson of the executive committee.
Our second dependent variable is a binary indicator of the leader's survival from the last election period. It takes a value of 1 if a female leader remains in the top position on the electoral ballot, and 0 otherwise. As we wish to compare women's tenure in leadership positions before and after quota implementation, groups with male leaders are not included in this analysis.
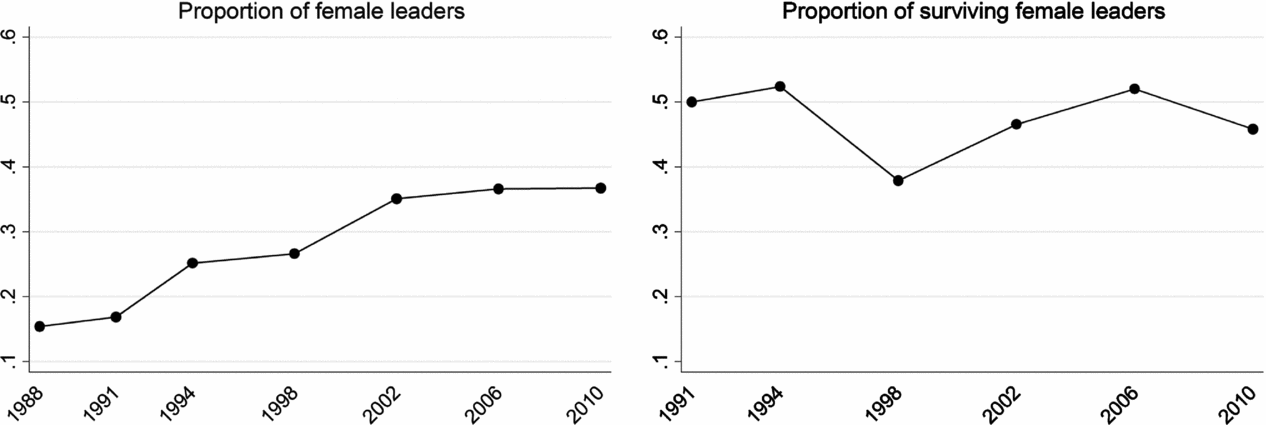
Figure 3 illustrates the time trends of the two dependent variables.Footnote 6 The left graph shows the proportion of municipal Social Democratic parties with a female leader. It demonstrates that women's access to power has risen steadily since 1988. The right pane plots the proportion of female incumbent leaders that remain in power. Fifty percent of women retained their posts both in the year before the quota (1991) and in the year it was introduced (1994). There was a dip in 1998, but women's reappointment rate appears to rebound over the next two elections.
Selection and Survival of Female Leaders Over Time

Empirical Modeling Strategy
To test whether the gender quota influenced both women's promotion to leadership positions and their survival in such posts, we rely on logistic regression analyses with a difference-in-difference specification.Footnote 7 For our dataset of Social Democratic municipal parties, we estimate
 $$\begin{eqnarray}
\eta _{m,t} = \alpha + \beta _t \Delta w_{1994 - 1991,m} *Election_{year_t } \nonumber\\&& +\, \gamma _t Election_{year_t } + \theta _m Mun_m ,\end{eqnarray}$$
where
 $\eta _{m,t} = \log \left( {\frac{{{\rm p}_{m,t} }}{{1 - {\rm p}_{m,t} }}} \right)$
is the transformed expectation, p
m, t
= P(Lead
m, t
= 1), and Leadm,t
represents each of the two dependent variables. The treatment Δw
1994–1991,m
measures the size of the quota's impact in each municipality. It captures the change in the proportion of elected women between the 1994 and 1991 elections, minus the time trend in the proportion of elected women. This trend adjustment allows us to distinguish between the underlying process of women's increasing presence in the party groups over time (i.e., the increases that would have happened even without the quota) and the quota's impact on women's numerical representation. We compute the linear trend in the share of women in each party group between 1982 and 1991, and then subtract this trend from the change in the share of women from 1991 to 1994. The resulting adjusted shift in the proportion of women in the quota year captures the inflow of female politicians attributable to the quota policy. The municipalities with the largest quota impact are those in which women's representation was initially the lowest. For these local-level parties, the quota dramatically increased women's descriptive representation. Low-impact municipalities, in contrast, are those that were already close to gender parity before the policy was implemented in 1994. For those parties, the quota policy had a limited effect on women's representation.
The quota impact measure is interacted with a dummy variable for each election between 1988 and 2010: Election yeart . The 1991 election is used as the reference category. The key vector of estimates, β t , captures the difference in the log odds of the response variable in the year in question compared to the reference year (1991) for a unit increase in quota impact. Our specification includes fixed effects for each election year, denoted by Election yeart , to ensure that we hold constant any time trend(s) in the averages of our outcome variables across all municipalities. We also include fixed effects for each municipality (Munm ), so that we estimate β t based on variation in the presence and reappointment of female leaders within a specific municipality and over time. These fixed effects account for time-invariant municipal-level factors that might influence both quota impact and parties’ (re)selection of a female leader.
Though the variation in quota impact across municipalities is not exogenous—because it is determined by preexisting levels of women's descriptive representation—our results are generated by comparing changes in women's access (and reappointment) to leadership before and after quota implementation within each municipality. Our municipal-level fixed effects account for locality-specific features that might simultaneously determine both our dependent variables (women's access to and survival in power) and our main predictor (quota impact). We further re-estimated our baseline analysis with variables controlling for the local Social Democratic Party's electoral support, the size of the municipal assembly, and the municipality's socioeconomic conditions including the gender gap in income. All results are robust to these additional controls (see Tables A5 and A6 in the Online Appendix for details). In essence, combining the exogenous assignment of the local-level quota policy with a difference-in-difference estimation strategy allows us to treat our data “as-if” random. Together, these two features of the analysis make this study a natural experiment.
Results: Quota Impact and the Selection and Survival of Female Leaders
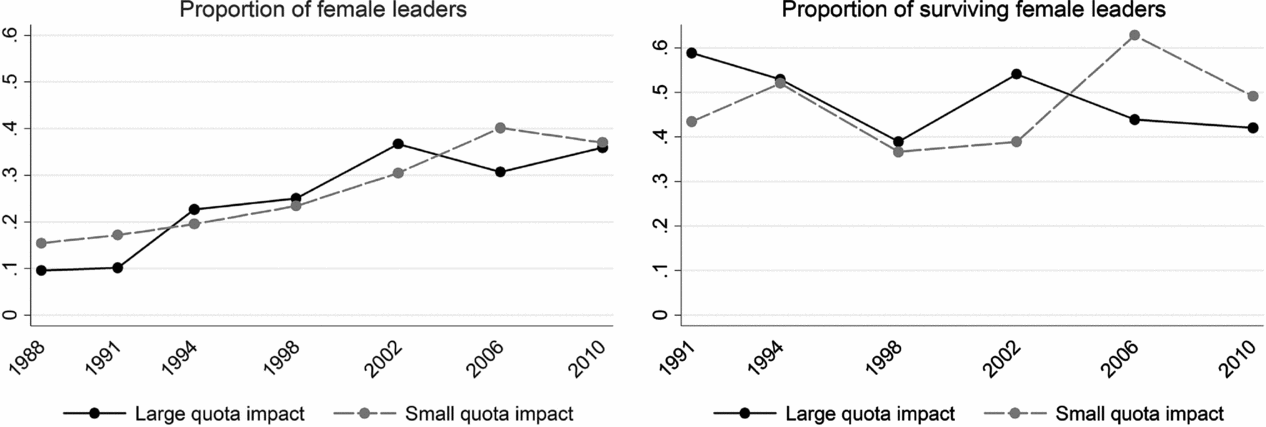
Figure 4 depicts the two dependent variables over time, distinguishing between municipalities based on quota impact. The solid black line represents municipalities in which the quota had a greater effect on the proportion of women elected (above the median). The gray dashed line represents municipalities in which the quota had a lesser influence (below the median).Footnote 8
Selection and Survival of Female Leaders by Quota Impact

The graph of the proportion of female leaders (left) shows that the percentage of women topping the party list was initially smaller in the municipalities that subsequently experienced quota impacts that were above the median. That is, before the quota there were fewer female leaders in municipalities where women's numerical representation was lower (black line). In the year the quota was introduced (1994), the municipalities in which the quota had a high impact (black line) converge towards municipalities in which women were already well represented in local parties (gray line). This suggests that female leadership increased in the high-impact municipalities relative to the low-impact local parties.
The second graph in Figure 4 shows the proportions of incumbent female leaders that remained in power in the two sets of municipalities. In 1994 the proportions appear to converge, with an increase in the share of surviving female leaders where the quota impact was small, and a drop in places with large quota effects. Over time, however, no consistent trend emerges. While in some years women are more likely to be reappointed in higher-impact municipalities, in other years female leaders do better in localities where the quota had a lesser effect.
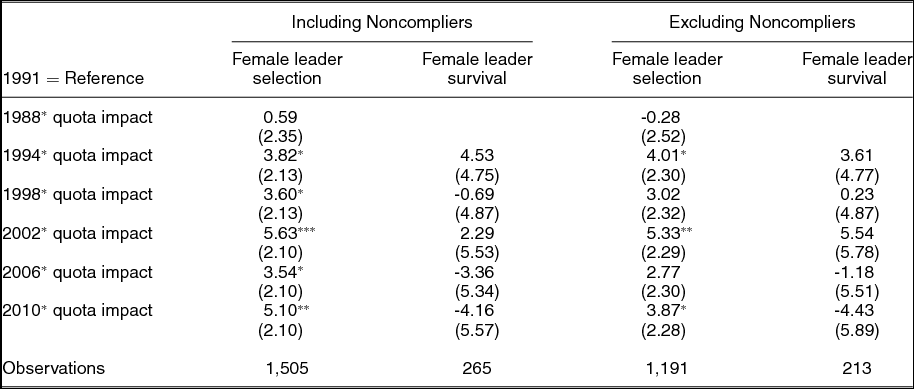
Table 1 shows the results from estimating our difference-in-difference model in Equation (1). In Columns 1 and 2 we present the findings using the full sample of municipal parties. In columns 3 and 4 we exclude the minority of local-level parties that did not fully comply with the gender quota (those in which the party group was not at least 45% female in 1994).Footnote 9 In each of the two samples we estimate the regression model for the probability that a party will select a female leader (columns 1 and 3) and the probability that an incumbent female leader will keep her position (columns 2 and 4).
Logistic Regression Models (with Difference-in-Difference Estimation) of Quota Impact on Female Leader Selection and Survival

Notes: Robust standard errors in parentheses; *** p<0.01, ** p<0.05, * p<0.1. All regressions include municipality and year fixed effects.
First, we focus on the results for the ascension of female leaders. The top row of the table presents the estimates for the pretrends. The interaction terms between the 1988 dummy variable and the quota impact measure are not significant, which shows that the municipal time trends in female leadership before quota implementation are not correlated with our treatment. In other words, we are confident that our treatment effect does not capture differential time trends in female leadership that began before the quota was introduced.
In the following rows, the post-quota coefficients are universally positive and statistically significant (at the α = 0.10 level). The gender quota clearly has a positive effect on women's access to leadership posts. In municipalities where the quota impact was 10%—i.e., a 10% trend-adjusted increase in the proportion of elected women between 1991 and 1994—the odds of having a female leader increased by 50% in 1994 as compared to 1991.Footnote 10 In municipalities where the quota impact was 20%, the odds of having a female leader increased by 120% in the same period. As the positive and significant estimates for all elections between 1994 and 2010 demonstrate, moreover, this effect was neither short-lived nor temporary. As compared to prequota trends in women's selection as party leaders, the quota both immediately and permanently improved women's access to leadership positions in municipalities where fewer women had previously held elected office. The quota had a lesser effect on women's ascension to these posts in municipalities where women's representation was comparatively high prior to 1994. Consistent with the data presented in Figure 4, with respect to women's access to leadership posts, quota implementation allowed local parties that had historically lagged behind in women's descriptive representation to catch up to their more egalitarian counterparts.
Next, we examine the results for female leaders’ survival in leadership posts from one election to the next. In contrast to the selection of female leaders, the findings for the post-quota years show that this outcome was not affected by the quota's impact.Footnote 11 As compared to pre-quota implementation patterns, women are no more (or less) likely to continue serving as leaders in municipalities where the quota had a larger effect on women's representation than in those in which the policy had little influence.Footnote 12
Taken together, our results refute the concern that quotas have a negative impact on women's political leadership (contrary to H2a and H2b). Our findings further support the idea that quotas accelerate women's initial advancement in the political hierarchy. Consistent with H1a, we find that quota implementation facilitated women's access to leadership positions in Swedish municipalities. Comparing local parties before and after the implementation of an exogenously assigned quota policy, the effects on the selection of female leaders were greatest where the quota impact was highest. At the same time, and contrary to H1b, though quotas accelerate women's ascension to the party leadership, they do not help female leaders survive in these posts. Thus, while quotas positively effect women's initial selection as party leaders, they cannot be relied upon to extend their tenure in these positions.
QUOTAS AND WOMEN’S QUALIFICATIONS
Thus far, we have theorized and provided empirical support for a previously unrecognized consequence of quota policies: their acceleration effect on women's access to leadership posts. Extending this analysis, we now explore a possible mechanism behind this result. We use our rich dataset to examine the relationship between quota impact and the quality of the women (and men) in the candidate pool for leadership positions. Though this is likely not the only mechanism driving our acceleration effects, it represents the most important and frequently identified mediating factor discussed in the literature.
As in most parties around the world, the Swedish Social Democrats recruit their leaders from within the organization and typically draw on politicians who are currently serving as elected members of the political body (Hagevi Reference Hagevi1994; Norris Reference Norris1997). In our case, the local party groups look for leaders among the qualified politicians currently holding seats in the municipal council. If a quota bolsters the supply of well-qualified potential female leaders, then it likely increases women's access to the leadership post. If it dilutes the female candidate pool, the quota may have no (or even negative) effects on women's selection as party leaders.
There are inherent challenges in defining and measuring the qualifications for political leadership. The characteristics that parties prize vary, and some of these qualities are intangible or difficult to measure. The very notion of a “qualified candidate” is not only subjective, but also gendered. Party elites may devalue women's life experiences, skills, and personality traits, such that the concept of “merit” is biased in favor of men (Murray Reference Murray2014). Judging women's credentials against the norms and expectations created by male politicians can also lead both selectors and scholars to overlook the unique backgrounds and qualifications that women bring to elected office (Franceschet, Krook, and Piscopo Reference Franceschet, Krook and Piscopo2012). As Murray (Reference Murray2014) notes, for example, though “lived experience of common concerns, authenticity, and empathy for the needs of others” are attributes that serve politicians well, selectors typically place less value in these “traditionally feminine qualities” (528).
While scholars widely recognize the limits of “merit,” in practice prospective party leaders often have to meet a set of informal baseline requirements. Given our focus on the Swedish Social Democrats, a labor party with strong historical ties to Sweden's unions, we use two binary indicators of qualifications for office. The first measure defines qualified prospective leaders as those who have experience in the party's “pipeline professions”; that is, (1) previously or currently working in public administration, (2) previously or currently being employed by a trade union, or (3) previously serving as a parliamentarian.Footnote 13 The experiences gained in each of these occupations give prospective leaders credibility within the party and skills that are especially useful for the top post.Footnote 14 The second indicator extends the first measure to include politicians who have completed a tertiary degree, irrespective of their subsequent career choice.Footnote 15 Higher education is the most common measure of politician “quality” or “competence” in the academic literature. It is often argued to capture enhanced practical skills, signaling ability, and civic engagement (see Allen, Cutts, and Campbell Reference Allen, Cutts and Campbell2014; Franceschet and Piscopo Reference Franceschet, Piscopo, Franceschet, Krook and Piscopo2012; Galasso and Nannicini Reference Galasso and Nannicini2011; Schwindt-Bayer Reference Schwindt-Bayer2011).
Table 2 provides descriptive statistics for the prevalence of these traits among leaders and other elected representatives, as well as among men and women. As expected, leaders are much more likely to have experience in pipeline professions (58% of leaders as opposed to 31% of nonleaders). When also accounting for a tertiary degree, 73% of leaders are considered qualified, while only 52% of elected representatives meet these criteria. The gender differences, in contrast, are minimal. On average, both male and female leaders have a qualification advantage over nonleaders of their own sex. When comparing men and women in these top posts, furthermore, female leaders are actually marginally more qualified than their male counterparts. In total, 58% of female leaders come from a pipeline profession, as compared to 57% of men. When adding tertiary degree holders, 77% of female leaders can be viewed as qualified, as opposed to only 71% of male leaders.
Percentage of Qualified Male and Female Politicians (1991–2010)

Note: The data on qualifications are averaged across time periods. The leaders are identified as the top-ranked candidates on each ballot, while the elected representatives are all other Social Democratic politicians (excluding the top-ranked candidate).
For the two qualification measures, we compute the number of qualified Social Democratic women elected to the municipal assembly in each election as well as the share of qualified elected female politicians. We also compute the difference in the number of qualified male and female politicians by subtracting the number of qualified men from the number of qualified women.Footnote 16 Together, these measures reveal the quota's effect on the number of women in the candidate pool who “qualified” for the leadership post in the same way as men. While neither wholly gender neutral, nor representative of a normative ideal, these measures reflect the reality that (prospective) female leaders are judged against well-established male standards of merit. If the quota increases the presence of female municipal-level politicians who can be considered qualified by these standards, this helps explain the acceleration effects identified above.
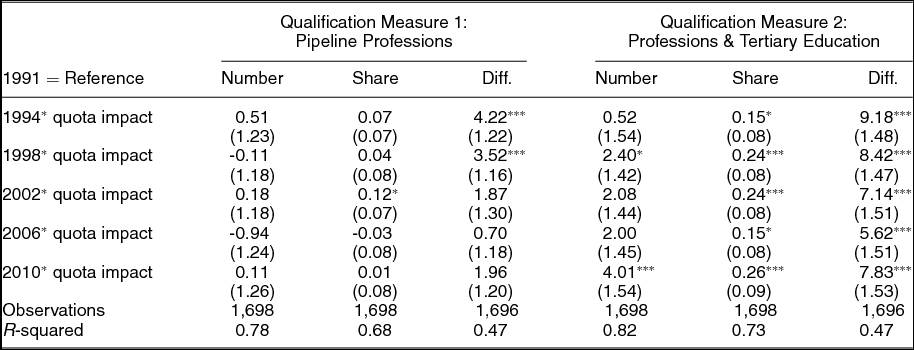
To determine whether the quota affected the supply of qualified female candidates we re-estimated our baseline regression using our measures of qualifications as dependent variables. The results in Table 3 show broadly positive quota effects on the supply of qualified women. Though the quota's impact on the number and share of women in pipeline professions is modest (see columns 1 and 2), the difference in the numbers of qualified women and men (column 3) is significant. The quota raised the number of qualified women relative to qualified men in the two elections immediately following its implementation (1994 and 1998).
OLS Regression Model (with Difference-in-Difference Estimation) of Quota Impact on Qualifications of Women in Local–Level Social Democratic Parties

Note: Standard errors in parentheses; *** p<0.01, ** p<0.05, * p<0.1. All regressions include municipality and year fixed effects.
For the second qualification measure—which includes tertiary education—the estimates are all positive and most are highly significant (see columns 4–6). As compared to municipalities with many female assembly members before the quota, local parties that were forced to increase their share of women also witnessed greater gains in both the number and share of qualified prospective female leaders. These high-impact localities also experienced a comparatively large inflow of qualified women vis-à-vis the number of qualified men.
These results help us better understand our baseline finding from the Swedish case. Contrary to the arguments made by quota opponents, the policy did not bring less-qualified women into the municipal assemblies. Rather, it allowed more educated women to enter politics. In the period immediately following the implementation of the quota, moreover, this policy resulted in an increased share of women from pipeline professions as compared to men. The quota's positive impact on the supply of traditionally qualified women in the pool of candidates for the leadership position likely helps explain our main result.
ACCELERATION AND TRADE-OFF EFFECTS BEYOND THE SWEDISH CASE
Though we study one quota type in a single country, our conceptual framework and results have implications far beyond Sweden's Social Democratic Party. The Swedish Social Democrats were at the global forefront of promoting women's descriptive representation at the national level, implementing their zipper quota comparatively early. This policy enforced numerical parity on local-level parties where women's representation varied significantly across municipalities. This transformation mirrors policies adopted in many other contexts at later dates. Today, voluntary party quotas with high thresholds for women's descriptive representation are relatively common: 24 parties have adopted 50–50 quotas, and there are over 30 parties with policies mandating that women comprise at least 40 percent of legislative candidates (Krook Reference Krook2009). Parties in the over 20 countries implementing legislated candidate quotas with placement mechanisms and strong sanctions for noncompliance have likewise had to respond to large increases in the number of female politicians in their parliamentary delegations (International IDEA 2015). Indeed, these legally mandated quota policies in many ways parallel the national-level Social Democratic Party's directive to its local organizations. The results from this article are thus relevant to a number of other cases.
Our evidence in favor of acceleration effects in the Swedish case provides cause for optimism for other parties and countries that have adopted quotas with similar provisions. The implementation of a strict quota policy in municipalities that had been relatively more opposed to women's representation could have led to trade-off effects. Yet, following quota implementation these high-impact municipalities quickly caught up to more “female-friendly” parties with respect to the appointment of female leaders. If quotas have positive effects in circumstances where male backlash is particularly likely, similar results should hold in other settings. Indeed, a preliminary analysis of women's access to leadership positions in 71 political parties from 11 advanced parliamentary democracies shows that these organizations are more likely to select female leaders following voluntary or legislated candidate quota adoption (see Table A7 in the Online Appendix for details). Although this simple observational analysis does not allow for the strong causal claims made with our unique Swedish dataset, it does suggest that acceleration effects likely hold beyond the Social Democratic Party.
Our extended analysis is especially useful for understanding the generalizability of our results. While we offer preliminary evidence for acceleration effects beyond Sweden, our secondary findings suggest that we cannot assume that the implementation of legislative quotas will automatically result in women's ascension to higher office. When quotas increase the proportion of women who are qualified for these posts by conventional standards, then we expect these policies to promote women's access to leadership posts. Where they do not increase the number of women perceived as qualified for these positions by traditional (and often masculine) standards, quotas may not facilitate the selection of female leaders.
Even if women meet or exceed the standards set by their male counterparts, in some institutional environments trade-off effects may hamper female politicians’ career trajectories. Though the Social Democrat's quota policy was difficult to implement insofar as it demanded a high-level of women's descriptive representation, in terms of compatibility with the electoral system, the Swedish municipalities provide a much “easier” case than countries or localities that rely on majoritarian electoral systems. Under plurality rules, quotas may be especially likely to generate trade-off effects, either because of the perceived zero-sum nature of policy implementation (in the case of all-women shortlists) or the additional stigmatization that can accompany reserved seats policies. Indeed, it is especially important to examine quotas’ effects on women's appointment to intraparty, legislative, and executive leadership posts in reserved seats systems, where female parliamentarians selected via the quota policy occupy seats set aside especially for women. These female politicians are often accused of benefiting from patronage or family connections. Trade-off effects may thus be especially likely to emerge in these cases.
CONCLUSIONS
While gender quotas are increasingly popular, electoral affirmative action remains a controversial strategy for increasing women's presence in elected office. Opponents suggest that the fast-track approach to increasing women's representation will undermine the very aims it seeks to achieve. By forcing parties to alter their “meritocratic” candidate selection policies, they argue that quotas will bring undeserving women into elected office. This suggests that female politicians selected via quotas will, in turn, likely fail to reach positions of influence within their parties and the executive branch, thus keeping women from accessing the posts where decision-making power is now largely concentrated.
This article establishes a clear causal relationship between gender quotas and women's political leadership, demonstrating that these policies can serve to accelerate women's access to party leadership and to promote highly qualified women to office. We find that an exogenously assigned gender quota had a positive impact on women's ascension to leadership posts within political parties, but no influence (either positive or negative) on the average reappointment rate of incumbent female leaders. Our results generally support the notion of quotas’ acceleration effects, while rejecting the idea of a trade-off effect. These findings, in turn, help refute claims that gender quotas limit women's representation by raising barriers to female politicians’ career advancement. In an extended analysis we address the question of quota's effects on women's qualifications for higher office. We find that the quota strengthened the pool of female candidates for the leadership post, a likely driver of the acceleration effect in the Swedish case.
Evidence of an acceleration effect provides another argument in support of electoral affirmative action policies. It also suggests that quotas may be an effective tool for those concerned with women's access to party leadership posts and executive office. At the same time, quotas cannot wholly remedy women's exclusion from the most important political posts. In 2010, over 15 years after quota implementation, the proportion of female leaders across the Swedish Social Democratic municipal parties remained below 40 percent. Our analysis also suggests that when faced with a less qualified group of female politicians, activists may not be able to rely on quotas to address women's continued exclusion from leadership posts. Even when quotas accelerate women's initial access to office, moreover, they do not necessarily increase female leaders’ likelihood of remaining in these positions.
Building on these findings, future research should examine whether similar results hold for other countries, political systems, quota types, and positions. Though we focus on a single case in order to exploit the natural experiment provided by the Swedish Social Democrats, our framework of acceleration versus trade-off effects is widely applicable and can be usefully applied in a number of contexts. The most direct parallels can be found in examining quotas’ influence on female leadership, both within their parties and in legislative and executive politics more generally. Additional studies could also examine the consequences of women's increased access to leadership posts, including changes in coalition formation, electoral performance, and policy outcomes. As power is progressively moving out of parliamentary parties and into the executive, women's access to—and behavior in—these posts will be increasingly relevant. We thus hope that our exploration of quotas’ effects on women's access to leadership posts will be useful to others, and that this article will represent a first step in a new wave of scholarship on the impact of quotas worldwide.




Comments
No Comments have been published for this article.