

INTRODUCTION
When an intense laser is focused on a metal film surface coated onto a transparent substrate, partial metal film will be ablated to produce plasma, driving the remainder to form a high velocity flyer plate, which can be used in explosive initiation and micro-space debris simulation study (Lebo et al., Reference Lebo, Lebo, Batani, Dezulian, Benocci, Jafer and Krousky2008; Phipps et al., Reference Phipps, Reilly and Campbell2000). In early laser driven flyer study, a single-layered film is usually employed to form the flyer plate while it has disadvantages of low laser energy absorptivity, poor flyer integrity, and a difficult increase in flyer velocity (Damian et al., Reference Damian, Johnathan, Dennis, Randall, Sheng and Thomas2005). In the last 10 years, multi-layered film configuration is mainly adopted (Kazuo et al., Reference Kazuo, Motohiko, Norimasa, Yasufumi and Sergei2000; Kadono et al., Reference Kadono, Yoshida, Mitani, Matsumura, Takahashi, Matsushima, Owadano, Sasatani, Fujita, Ozaki, Takamatsu, Nakano, Tanaka, Takenaka, Ito and Kondo2001), with ablation layer absorbing laser energy to produce plasma, impactor layer being driven by plasma to form a flyer plate, insulation layer holding back laser to keep flyer from being ablated and make plasma absorb more laser, resulting in a high velocity flyer plate (Paisley, Reference Paisley1991). Forming mechanism of plasma and detonation wave under laser loading, together with the motion law of driven flyer plate, always have been the basic issues in laser driven flyer study.
Lawrence and Trott (Reference Lawrence and Trott1991) first proposed Gurney energy calculation method of laser driven flyer velocity, in which energy conservation law was used to calculate flyer velocity, ignoring the complex interaction of laser, plasma, and flyer. Farnsworth first established one-dimensional laser driven flyer computation model, using energy deposition to simulate absorption in film (Farnworth & Lawrence, Reference Farnworth and Lawrence1991). They thought only 4% of the laser energy was absorbed by film until some ionization occurs for the first part of laser pulse, and then plasma absorbed total laser energy to drive flyer motion. Cazalis et al. (Reference Cazalis, Boissière and Sibille1995) then considered plasma inverse bremsstrahlung in laser driven flyer numerical simulation. They computed plasma ionization degree, particle number, and analyzed the effects of laser power density on flyer velocity. From recent laser driven flyer studies, compared with a large amount of experimental studies (Zhao et al., Reference Zhao, Zhao, Shang and Gao2011; Dai et al., Reference Dai, Gong, Cao, Niu, Tong, Xiang and Yang2010; Gu, Reference Gu2002), theoretical calculation study is relatively weak and calculation model established is much easier, ignorance of laser energy distribution, lacking calculation analysis about film phase transition under laser loading, plasma state, coupled interaction of plasma, and flyer (Farnworth & Lawrence, Reference Farnworth and Lawrence1991; Cazalis et al., Reference Cazalis, Boissière and Sibille1995).
In this study, Gurney theory calculation method has been adopted to calculate laser driven multi-layered flyer velocity, by modifying laser energy absorption coefficient to consider the increase of laser energy deposited induced by insulation layer. The effect of film configuration on flyer velocity is analyzed, and multi-layered film configuration capable of forming a high velocity flyer plate is decided. An intense laser driven multi-layered flyer experiment has been conducted and a two-dimensional axisymmetric computation model has been established. Numerical simulation of film phase change under laser loading, plasma formation and driven flyer process has been conducted, and flyer velocity, plasma flow field characters are then analyzed.
THEORETICAL CALCULATION OF LASER DRIVEN MULTI-LAYERED FLYER VELOCITY
Calculation Method
Principle of laser driven multi-layered flyer is illustrated in Figure 1. An intense laser is focused on surface of ablation layer to ablate ablation material and produce plasma with high-temperature and high pressure. Plasma expands outward to drive both insulation layer and flyer layer as a high velocity flyer plate. Compared with single-layered film, insulation layer holds back laser energy, and flyer layer presets flyer shape, combined to keep the integrity of flyer plate.
(Color online) Principle of laser driven multi-layered flyer.

Based on Gurney theory calculation method (Lawrence & Trott, Reference Lawrence and Trott1991), laser driven multi-layered flyer calculation model has been established to calculate flyer maximum velocity when laser irradiates on film surface with different layer materials and configurations. A linear velocity profile assumption for plasma has been made in order to obtain flyer maximum velocity. It is finally obtained as
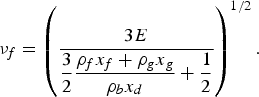 $${\rm \nu}_f = \left(\displaystyle{3E \over \displaystyle{3 \over 2} \displaystyle{{\rm \rho}_f x_f + {\rm \rho}_g x_g \over {\rm \rho}_b x_d} + \displaystyle{1 \over 2}} \right)^{1/2}.$$
Where E is laser Gurney energy; ρb, ρg, ρf are densities of ablation layer, insulation layer, and impactor layer, respectively; x d, x g, x f are ablation layer depth, insulation layer depth and impactor layer depth.
Gurney energy E can be expressed as
 $$E = \displaystyle{{F_0 \lpar 1 - r\rpar } \over {{\rm \rho} _b x_d }}\lpar 1 - e^{ - {\rm \mu} _{eff} {\rm \rho} _b x_d } \rpar - {\rm \varepsilon} _d .$$
Where F 0 is incident laser energy density; r is laser energy loss coefficient (combing both reflective and radiative loss); ρb is ablation layer density; x d is ablation depth; µeff is the effective absorption coefficient; ɛd is vaporization energy of ablation material.
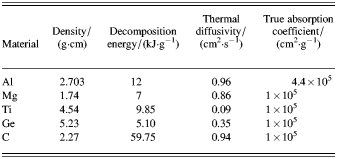
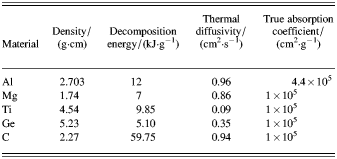
Theoretical calculation has been conducted to obtain flyer maximum velocity when laser irradiates on multi-layered Al/Al2O3/Al (250 nm/250 nm/3 µm) and Al/Al2O3/Al (100 nm/250 nm/3 µm). Material parameters required by the model are listed in Table 1. Comparisons of flyer velocity calculated and experimental results measured by Bowden and Knowles (Reference Bowden and Knowles2009; Trott, Reference Trott1994) are shown in Figure 2. Flyer maximum velocity calculated is obviously lower than experimental data, indicating that theoretical calculation model of laser driven multi-layered flyer velocity needs further revision.
(Color online) Flyer maximum velocity measured by Trott and calculated in this paper. (a) Al/Al2O3/Al (250 nm/250 nm/3 µm) and (b) Al/Al2O3/Al (100 nm/250 nm/3 µm).
Material parameters adopted in calculation
For multi-layered configuration, flyer velocity can be greatly improved because of insulation layer holding back laser effectively to make ablation layer deposit more laser energy, resulting in a higher flyer velocity. Therefore, determining the effect of insulation layer on laser energy effective absorption coefficient µeff is one key issue to flyer velocity theoretical calculation. In the actual situation, as different insulation materials can be adopted, there are differences in laser energy absorbed by ablation layer. Normally experimental data is needed to determine the effect of insulation layer on µeff. In this calculation, the laser energy effective absorption coefficient µeff is modified to be K g·µeff to consider insulation layer effect. Experimental flyer velocity measured by Trott is used as a baseline to determine K g for Al2O3 insulation layer (Trott, Reference Trott1994). Calculation results agree well with experimental data when K g = 4.8, illustrated in Figure 3. Trott's (Reference Trott1994) study shows that a 38% increase in flyer velocity of multi-layered flyer with Al2O3 insulation layer than single-layered flyer has been obtained. In this paper, flyer velocity calculated with the consideration of insulation layer effect (K g = 4.8) has a 36% increase than that calculated without K g consideration, close to Trott's experimental data of 38%, indicating the rationality of 4.8 for K g and the validity of theoretical calculation in some extent.
(Color online) Flyer maximum velocity measured by Trott and calculated in this paper with K g = 4.8. (a) Al/Al2O3/Al (250 nm/250 nm/3 µm) and (b) Al/Al2O3/Al (100 nm/250 nm/3 µm).
Calculation Results and Analysis
Taking single film Al (3.35 µm) and multi-layered film Al/Al2O3/Al (100 nm/250 nm/3 µm) as object, flyer velocity driven by 0–30 J/cm2 laser energy density has been calculated. Figure 4 illustrates relation curves of calculated flyer velocities and laser fluence. Multi-layered flyer velocity is obviously higher than single-layered flyer at a laser energy density lower than 10 J/cm2. The difference between multi-layered flyer velocity and single-layered flyer velocity decreases gradually as laser energy density increases. Figure 5 is relation curves of flyer velocities and laser fluence measured by Trott (Reference Trott1994). The trend calculated in this paper agrees well with Trott's experimental result, indicating calculation validity in some extent.
(Color online) Relation curves of calculated flyer velocities.
(Color online) Relation curves of flyer velocities measured and laser fluence by Trott.
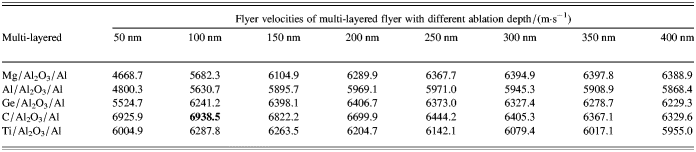
Five ablation materials of Al, Mg, Ge, C, Ti have been studied and flyer velocities have been calculated of laser irradiating on film with different ablation thicknesses. The thickness of insulation layer and impactor layer adopted in calculation are 250 nm and 3 µm, respectively. Calculation results are listed in Table 2. The data in Table 2 indicates that flyer velocity increases first and then decreases as ablation layer thickness increases for each ablation material. Ablation layer has an optical energy absorption depth. The optical energy absorption depths for Al, Mg, Ge, C, Ti at a laser fluence of 40 J/cm2 are 350 nm, 250 nm, 200 nm, 100 nm, 100 nm, respectively. C/Al2O3/Al (100 nm/250 nm/3 µm) has the maximum velocity of 6938.5 m/s.
Flyer velocities of multi-layered flyer with different ablation thicknesses at a laser fluence of 40 J/cm2
LASER DRIVEN MULTI-LAYERED FLYER EXPERIMENT
Laser driven multi-layered flyer experiment has been conducted to obtain flyer velocity and verify theoretical calculation validity. Theoretical calculation results show that C/Al2O3/Al (100 nm/250 nm/3 µm) has the maximum velocity when laser irradiates on films with different layer materials and thicknesses. Therefore, C/Al2O3/Al (100 nm/250 nm/3 µm) has been selected as experimental research. A schematic view of the experimental set-up is given in Figure 6. Experimental system consists of solid laser, reflection/transmission mirror, focal lens, flyer generating setup, calorimeter, phototube, and oscilloscope. A high intensity solid laser pulse (λ = 1064 nm) has been divided into two beams by reflection/transmission mirror. Most of laser has been focused by an f = 20 cm lens onto a metal film surface in flyer generating setup to generate plasma and drive flyer. A small amount of laser has been transmitted with its energy being continuously monitored by a calorimeter. Real laser energy aiming to irradiate metal film can be computed according to energy ratio of reflection laser against transmission laser. As the action time of laser driven flyer is much shorter, it is very important to measure the start time of laser action. In the experiment, phototube has been adopted to record laser light, translating light signal into electricity signal to activate digital oscilloscope as its startup single.
(Color online) Schematic view of experimental set-up.
Flyer generating setup is comprised of transparent substrate, multi-layered film, flat ring, and piezoelectric film target. Principle diagram of flyer generating setup is shown in Figure 7. An intense laser is focused on multi-layered surface to produce plasma and form a high velocity flyer. As flyer impacts piezoelectric film, piezoelectric signal will be recorded by digital oscilloscope (DPO 7054). According to the time difference between laser light and piezoelectric signal, the time of flyer impacting target can be determined. By changing flat ring thickness, the flight time of flyer traveling different distances can be obtained. Six thicknesses of 100 µm, 150 µm, 170 µm, 200 µm, 230 µm, 250 µm for flat ring are adopted in this experiment, with a 1 µm error.
(Color online) Principe diagram of flyer generating setup. (a) Laser induced plasma, (b) Flyer accelerating, (c) Flyer impacting target.
Nd: YAG solid laser has been adopted as driving laser, delivering at 1.064 µm wave length, 10 ns pulse width, and 1 J of maximum energy. The focal spot diameter is 1.1 mm. The spatial distribution of laser spot satisfies pseudo-top hat profile. Transparent substrate material is K9 glass and thickness of the transparent substrate is 3 mm. Flat ring material is polysulfone.
NUMERICAL SIMULATION OF LASER DRIVEN FLYER
In order to obtain detailed information about the laser driven flyer process, the numerical simulation work has been conducted. Laser driven flyer involves complex physical-chemical interaction in laser ablation, plasma formation, plasma expansion, film rupture, and flyer motion. It is unrealistic to describe the whole process details in simulation. Therefore, the following assumptions have been made in this paper: (1) Laser driven flyer motion is seen as two-dimensional axisymmetric motion. (2) Incident laser beam is parallel with ignorance of its focus angle. Laser energy loss is zero before it reaches film surface. (3) Film absorbs laser energy and changes from solid to vapor directly. (4) High temperature gases induced by laser ablation are in local thermodynamic equilibrium, while particle compositions follow Boltzmann distribution. Ion and electron share the same temperature. (5) Insulation and ablation layer compose the flyer plate, which is seen as rigid without deformation.
According to the assumptions, laser driven multi-layered flyer process can be dealt with as a fluid mechanical process. CFD numerical simulation method and Fluent 14.0 software can be adopted to conduct computation. Based on experimental setup, a two-dimensional axisymmetric computation model of laser driven multi-layered flyer has been established as shown in Figure 8. Parallel laser comes from the left side. Set the x axis as symmetry axis. Diameters of laser beam and multi-layered flyer C/Al2O3/Al (100 nm/250 nm/3 µm) are 1 mm and 1.2 mm respectively. Computational domain is initially set at a temperature of 300 K and at a pressure of 1 atm.
(Color online) Computation model of laser driven multi-layer flyer.
Laser energy deposited in ablation layer varies with time and space. It can be expressed as (Lawrence & Trott, Reference Lawrence and Trott1991)
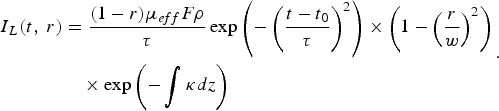 $$\eqalign{I_L \lpar t\comma \; r\rpar & = \displaystyle{{\lpar 1 - r\rpar {\rm \mu} _{eff} F{\rm \rho} } \over {\rm \tau} }\exp \left(- \left(\displaystyle{{t - t_0 } \over {\rm \tau} }\right) ^2 \right)\times \left(1 - \left(\displaystyle{r \over w}\right) ^2 \right)\cr & \quad \times \exp \left(- \vint {{\rm \kappa} dz} \right){\rm }}.$$
Where r is energy loss coefficient; μeff is effective absorption coefficient; F is laser fluence; τ is laser pulse duration; ρ is density; t 0 is the time offset of the beam maximum intensity; w is the beam radius; r and z are radial and axial coordinates, respectively; K is the plasma absorption coefficient.
Effective absorption coefficient µeff is related to true absorption coefficient, thermal diffusivity and laser pulse width. The relation is as follows (Lawrence & Trott, Reference Lawrence and Trott1991)
 $${\rm \mu} _{eff} = \displaystyle{{{\rm \mu} _a } \over {1+k{\rm \mu} _a {\rm \rho} \lpar {\rm \sigma} {\rm \tau} \rpar ^{1/2} }}.$$
Where µa is true absorption coefficient; ρ is density; σ is thermal diffusivity; τ is laser pulse duration; k is adjust coefficient.
The parameters to compute laser energy deposition are as follows (Bowden & Knowles, Reference Bowden and Knowles2009): ρ is 2.27 g/cm3, µa is 1.0 × 104 cm2/g, σ is 0.94 cm2/s, ɛd is 29.63 kJ/g, r is 0.413.
ABLATION LAYER MATERIAL PHASE TRANSITION
Ablation layer under laser loading undergoes ablation and evaporation. Gas-solid mixture model and phase transformation volume fraction have been adopted to describe ablation layer phase transition from solid to gas. Ablation layer calculation element can be seen as a mixture comprised of solid and gas. Solid volume fraction of calculation element is 1 before laser pulse, indicating no gas. During laser loading, solid ablation material transforms into gas. According to solid and gas volume fraction, film ablation and evaporation extent can be judged. The continuity, momentum and energy equations can be obtained by summing the individual continuity, momentum and energy equations for all phases. They can be expressed as
 $$\displaystyle{\partial \over {\partial t}}\left({\rm \alpha} _S {\rm \rho} _S+{\rm \alpha} _V {\rm \rho} _V \right)+\nabla \cdot \left({\rm \alpha} _S {\rm \rho} _S \vec{v} + {\rm \alpha} _V {\rm \rho} _V \vec{v}\right)= S_m \comma \;$$
 $$\eqalign{\displaystyle{\partial \over \partial t} \left({\rm \rho}_m \vec{v}_m\right)+ \nabla \cdot \,\left({\rm \rho} _m \vec{v}_m \vec{v}_m\right) &= - \nabla P + \nabla \cdot \,\big[ {\rm \mu} _m \left(\nabla \vec{v}_m + \nabla \vec{v}_m^{\,T}\right)\big] \cr &\quad + {\rm \rho} _m \vec{g} + \vec{F} + \nabla \cdot \left(\vec{v}_{dr} \vec{v}_{dr} {\rm \rho}_m\right)\comma \; }$$
 $$\eqalign{&\displaystyle{\partial \over {\partial t}}\left({\rm \alpha} _S {\rm \rho} _S E_S + {\rm \alpha} _V {\rm \rho} _V E_V \right)+ \nabla \cdot \lsqb {\rm \alpha} _S \left({\rm \rho} _S E_S + P\right)\vec{v}_S \cr &\quad + {\rm \alpha} _V \left({\rm \rho} _V E_V + P\right)\vec{v}_V\rsqb = \nabla \cdot \lpar k\nabla T\rpar + S_E {\rm }.}$$
In the above equations, αS, αV represent the volume fraction of solid phase and gas phase, respectively; ρS, ρV are solid phase density and gas phase density;  $\vec{F}$ denotes a body force;
 $\vec {v}_{dr}$ stands for the drift velocity for vapor phase; S m, S E represent mass source and energy source of mixture; k denotes the thermal conductivity; ρm, μm are the mixture density and viscosity.
Two more equations define the total energy per unit mass E and enthalpy h,
 $$E = h - \displaystyle{\,p \over {\rm \rho} } + \displaystyle{{{\rm \nu} ^2 } \over 2}\comma \; h_j = \vint_{T_{ref} }^T {c_{\,p\comma j} dT} .$$
Here E, h, p, ρ, v, c p, T represent total energy per unit mass, enthalpy, pressure, density, velocity, specific heat and temperature, respectively.
The first term on the right-hand side of energy Eq. (7) represents energy transfer due to heat conduction. The second term denotes any other volumetric heat source, including laser energy and phase transition heat. Laser energy can be obtained by summing the individual laser energy absorbed by solid and gas phase. Phase transition heat can be computed by multiplying mass transfer rate by latent heat.
 $$S_E = S_L - S_{\,phase} = {\rm \alpha} _S I_S+{\rm \alpha} _V I_V - \Delta mI_m .$$
In the above, S L and S phase represent laser energy deposited and phase transition heat; αS, αV are the volume fraction of solid and gas phase; I S, I V stand for laser energy absorbed by solid and gas phase; Δm is mass transfer rate; I m denote vaporization latent heat.
Based on the following temperature regimes, the mass transfer can be described as follows:
If T > T sat
 $$\dot{m} _{S { \to V}} = coeff\, {\ast}\, {\rm \alpha} _S {\rm \rho} _S \displaystyle{{T - T_{sat} } \over {T_{sat} }}$$
If T < T sat
 $$\dot{m} _{V{ \to S}} = coeff \,{\ast}\, {\rm \alpha} _V {\rm \rho} _V \displaystyle{{T_{sat} - T} \over {T_{sat} }}$$
Where  $\dot{m} _{S {\to V}}$ represents mass transfer rate from solid phase to gas phase; coeff is a relaxation time; αS, αV are volume fraction of solid and gas phase; ρS, ρV are solid density and gas density.
In the calculation, mass and energy transfer between solid and gas phase, together with laser energy are coupled into computation procedure via User Defined Function and solved simultaneously with the hydrodynamic system of Eqs. (5)–(7).
LASER BEAM INTERACTION WITH PLASMA
Since plasma absorbs laser energy on its way, laser intensity decays with spread of distance. It takes the following form (Moscicki et al., Reference Moscicki, Hoffman and Szymański2011)
 $$\displaystyle{{dI} \over {ds}} = - {\rm \kappa} I.$$
Where s is transport distance; K denotes plasma absorption coefficient, which depends on particle number and plasma temperature. The critical electron number density of plasma for laser transmission is 0.9716 × 1027/m3 at 1.064 µm wave length.
According to Zeldovich-Raizer theory (Zeldovich & Raizer, Reference Zeldovich, Raizer, Wallace and Ronald1980), free electron absorbs laser energy mainly through inverse Bremsstrahlung and photoionization mechanism when nanosecond laser irradiates on ablation material. Therefore, in this calculation, dominant absorption mechanisms in plasma: the electron-atom inverse Bremsstrahlung, the electron-ion inverse Bremsstrahlung and photoionization have been taken into account. Total continuous absorption coefficient (Moscicki et al., Reference Moscicki, Hoffman and Szymański2011) can be written as
 $${\rm \kappa} = \sum\limits_{\rm \lambda} {\lpar {\rm \kappa} _{\,ff} ^{ei} \lpar {\rm \lambda} \rpar + {\rm \kappa} _{\,fb} \lpar {\rm \lambda} \rpar + {\rm \kappa} _{\,ff} ^{ea} \lpar {\rm \lambda} \rpar \rpar } \times \left[1 - \exp \left(- \displaystyle{{hc} \over {{\rm \lambda} k_B T}} \right) \right] .$$
Here indices fb and ff denote free-bound and free-free transitions, and ei and ea denote electron-ion and electron-atom collisions. K fb(λ), K ffei(λ), K ffea(λ) are absorption coefficients due to photoionization, electron-ion inverse Bremsstrahlung and electron-atom inverse Bremsstrahlung, respectively. h is Planck constant; c is the speed of light in a vacuum; λ is laser wavelength; k B is Boltzmann constant; T is plasma temperature.
 $$\matrix{{\rm \kappa} _{fb} \lpar {\rm \lambda} \rpar = \displaystyle{{32{\rm \pi} ^2\, k_B } \over {3\sqrt 3 ch^4 }} \left(\displaystyle{{e_0 ^2 } \over {4{\rm \pi} {\rm \varepsilon} _0 }} \right) ^3 \sum\limits_z {z^2 n_{z - 1} \cdot \displaystyle{{g_{z\comma 1} } \over {U_{z - 1} }}} \displaystyle{{T_e {\rm \lambda} ^3 } \over {c^3 }} \cr \hfill \times \exp \left(- \displaystyle{{E_j } \over {k_B T_e }} \right) \left(\exp \left(\displaystyle{{h{\rm \upsilon} } \over {k_B T_e }} \right) - 1 \right) \cdot {\rm \varepsilon} \lpar T_e\comma \; {\rm \lambda} \rpar \cr \hfill {\rm \kappa} _{ff} ^{ei} \lpar {\rm \lambda} \rpar = \displaystyle{{8{\rm \pi} e_0 ^6\, k_B } \over {3m_e hc\lpar 6{\rm \pi} m_e k_B \rpar ^{1/2} \lpar 4{\rm \pi} {\rm \varepsilon} _0 \rpar }} \cdot {\rm \lambda} ^3 \cdot n_e T_e ^{ - 1/2} \cr \hfill \times \sum\limits_{z = 1} {z^2 } n_z \cdot G_{ff} \cr \hfill {\rm \kappa} _{ff} ^{ea} \lpar {\rm \lambda} \rpar = \displaystyle{{16e_0 ^2 {\rm \lambda} ^3 } \over {3\lpar 4{\rm \pi} {\rm \varepsilon} _0 \rpar \cdot c^4\, h}} \left(\displaystyle{{k_B } \over {2{\rm \pi} m_e }} \right) ^{3/2} n_a n_e T_e ^{3/2} \cr \hfill \times {\rm \sigma} _{ea} \lpar T \rpar \cdot \left[ 1 + \left( 1 + \displaystyle{{hc} \over {{\rm \lambda} k_B T_e }} \right) ^2 \right] .\hfill}$$
In the above, k B is Boltzmann constant; h is Planck constant; c is the speed of light in a vacuum; e 0 is elementary charge; ɛ0 is permittivity of vacuum; z denotes ion charge seen by free electron; n Z and n e are ion density and electron density, respectively; g and U stand for the statistical weight and partition function; λ and ν are laser wavelength and frequency; E is ionization energy; ɛ(T e, λ) is the Biberman factor; T e is electron temperature; G ff is the Gaunt factor; σea is the electron-atom scattering cross-section.
PLASMA STATE EQUATION
Since gas phase of ablation layer contains a large amount of electrification particles, ideal gas state equation is not applicable any more. Therefore, plasma state equation is necessary in calculation to take into account the effect of particles number change and the coulomb force between particles on pressure and inner energy.
Plasma pressure and inner energy (Hong et al., Reference Hong, Dou, Li, Yao and Luo2001) are given by
 $$P = \lpar 1 + {\rm \alpha} \rpar \displaystyle{R \over M}{\rm \rho} T\comma \;$$
 $$E = \displaystyle{3 \over 2}\lpar 1 + {\rm \alpha} \rpar \displaystyle{R \over M}T + N_0 \sum\limits_{i} {{\rm \alpha} _i } {I_{i}} + N_{0} \sum\limits_{i} {{\rm \alpha} _i } {{\rm \varepsilon} _{i}} .$$
In the above, the first term on the right-hand side represents the contribution of ion, atomic, and electron thermodynamic on inner energy. The effects of atomic ionization and excitation on inner energy are described as the second and third terms. α represents ionization degree; I i stands for ionization energy; ɛi denotes excitation energy; N 0 is total atomic number in per unit mass.
Based on thermodynamics, the relationship between entropy, enthalpy and Helmholtz free energy is
 $${S = - \left(\displaystyle{{\partial F} \over {\partial T}} \right)_{V\comma N}\comma \; {\rm }H=F - T \left(\displaystyle{{\partial F} \over {\partial T}} \right)_{V\comma N} - V \left(\displaystyle{{\partial F} \over {\partial V}} \right)_{T\comma N}\comma \; {\rm }Cp= \left(\displaystyle{{\partial H} \over {\partial T}} \right)_P .}$$
Here F denotes Helmholtz free energy of ionized vapor.
From Eqs. (13), (14), and (15), ionization degree is a critical parameter to compute electrification vapor state equation and thermodynamic properties. As for nanosecond laser, electron collision time is only 10−11s, far less than laser pulse width, and ion temperature is very close to electron temperature (Tong & Tang, Reference Tong and Tang2008). Therefore, the assumption of local thermodynamic equilibrium is fulfilled, ignoring the difference between electron temperature and ion temperature. In this paper, the assumption that chemical reaction and thermodynamic behavior reach equilibrium instantaneously at the moment of laser ablation has been made to calculate plasma ionization degree. Ion and electron number can be computed by iteratively solving ionization balance equations. Then ionization degree, state equation and thermodynamic properties can be obtained.
According to Saha equation, ion and electron concentration meet the following relationship (Robert et al., Reference Robert, Igor and Edvard2008).
 $$\eqalign{\displaystyle{{a_i a_e } \over {a_{i - 1} }}& = \displaystyle{2 \over n}\displaystyle{{u_{a^{i + } } } \over {u_{a^{\lpar i - 1\rpar + } } }}\left(\displaystyle{{2{\rm \pi} m_e m_{a^i } + k_B } \over {m_{a^{\lpar i - 1\rpar + } } h^2 }}\right)^{\displaystyle{3 \over 2}} T^{\displaystyle{3 \over 2}} \exp \left(- \displaystyle{{I_i - I_0 } \over {k_B T}}\right)\cr & \quad = K_i {\rm \lpar i = 1\comma \; 2\comma \; 3}.......}$$
Where K i is ionization equilibrium constant; u a, u ai+ are partition functions of atomic and ion, respectively; I i is ionization energy; m a, m ai+ are atomic mass and ion mass; m e is electron mass; n, n a, n ai+, n e are, respectively, total particle number, atomic number, ion number and electron number; a e is ionization degree; a 0, a i are atomic and ion concentration.
Additional conservation equations for element and charge are needed.
 $$a_0+\sum\limits_{i = 1}^{13} {a_i }+a_e = 1\comma \; a_e = \sum\limits_{i = 1}^{13} {ia_i } .$$
In Eqs. (16) and (17), there are I + 2 unknowns and equations, forming a closed equation set. a e can be obtained by solving the equation set. Combining a e into Eqs. (13), (14), and (15), high temperature vapor equation of state and thermodynamic properties are computed. For ablation layer C, i is equal to 6. Since computation amount is critical huge to solve high-order nonlinear equation set, only first-order ionization reaction is considered here in order to avoid computational difficulties.
The ionization degree of first-order ionization reaction is
 $$a_e = \displaystyle{{ - K_1 + \sqrt {K_1 ^2 + 4K_1 } } \over 2}.$$
Where K 1 is first order ionization equilibrium constant, which can be expressed as
 $$K_1 = \displaystyle{2 \over n}\displaystyle{{u_{a^ + } } \over {u_{a^0 } }}\left(\displaystyle{{2{\rm \pi} m_e m_{a^{i + } } k_B } \over {m_{a^0 } h^2 }}\right)^{{3 \over 2}} T^{{3 \over 2}} \exp \left(- \displaystyle{{I_i - I_0 } \over {k_B T}}\right).$$
In the numerical simulation, User-defined Real Gas Models is used in fluent for combining new state equation and thermodynamic properties into computation procedure, aiming at modeling plasma expansion behaviors.
FLYER MOTION
Dynamic mesh model has been employed to describe flyer motion. In numerical simulation, the flyer is seen as a rigid, and the boundary between flyer and plasma is a moving boundary. Flow field parameters adjacent to flyer are computed first, and then according to mechanical equilibrium, the velocity of moving boundary within time step can be computed. The grid will be regenerated and enmeshed by controlling grid volume to realize boundary moving after current location of moving boundary is obtained. The movement in next time step will be determined by current computed results.
Flyer is pushed by plasma flow field F and also subjects to resistance f in flight. Based on the theorem of momentum, flyer velocity increase Δv within Δt time can be expressed as
 $$\Delta v = \displaystyle{{\overline P \cdot S - f} \over m} \cdot \Delta t.$$
Where  $\overline P $ represents average pressure of plasma flow field on flyer; S stands for action area of plasma flow field on flyer; f is resistance; m is flyer mass; Δt is time step. Resistance f includes film fraction f film and air resistance f air. Film friction f film exists initially, and air resistance f air is decided on flyer area and velocity. Both f film and f air is closely related to flow field thrust. Therefore, in numerical simulation, the resistance f suffered by flyer is assumed to be plasma flow field thrust F multiply by resistance coefficient k. According to flyer velocity measured in experiment at some laser energy, the resistance coefficient k can be determined. Then compare calculated flyer velocity and experiment data at other laser energy to verify the validity of numerical simulation. On this basis, plasma flow field characteristic is analyzed.
RESULTS AND DISCUSSION
Flyer Velocity Analysis
Flight time of flyers traveling different distances have been measured in experiments. The following figure is the original signals measured with the photodiode and the piezo film. The yellow line is laser signal and the green line is piezoelectric signal. The onset of laser signal is taken as time zero point, and the onset of piezoelectric signal is taken as flyer arrival time. The time difference Δt between the two onsets can be seen as flyer flight time. Based on these experiment data, the double exponential form (Rupp et al., Reference Rupp, Gehr, Harper, Stahl, Sheffield and Robbins1999; Paisley et al., Reference Paisley, Luo, Greenfield and Koskelo2008) is adopted to describe the flyer plate velocity, then the changing relationship of flyer velocity to time at different laser energies have been obtained (Wang et al., Reference Wang, Chen, Wu and Sun2012). The confidence is 0.999%.
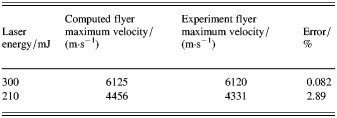
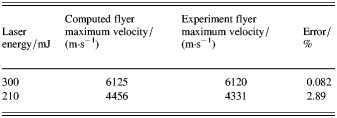
Comparison of computed flyer velocity and experiment data at laser energy of 300 mJ is plotted in Figure 10. Computed flyer maximum velocity and acceleration time are basically the same as experiment data when resistance coefficient k is 15%. A maximum velocity of 6125 m/s have been reached at about 20 ns. Though flyer velocity at accelerating stage is a little higher than experiment data, the general trend of velocity changes computed essentially agrees with experiment results. Then the value of resistance coefficient k is employed in numerical simulation at other laser energies. Computed flyer maximum velocity and experiment results are listed in Table 3. There were less than 3% error between computation and experiment data.
(Color online) Original signals measured with the photodiode and the piezo film.
(Color online) Comparison of computed flyer velocity and experiment data at 300 mJ.
Flyer maximum velocities computed and experiment data at different energies
Plasma Flow Field Analysis
Numerical simulation result at a 300 mJ laser energy is taken for example to analyze plasma flow field changing.
Typical flow field pressure distribution is depicted in Figure 11. Flyer is pushed to move by plasma flow field. As flyer velocity is closely related to the pressure of adjacent flow field, the average pressure of plasma flow field on flyer has been analyzed in Figure 12. For initial stage of laser pulse (2 ns), plasma absorbs laser energy and the average pressure increases gradually before flyer moving. After 2 ns, plasma pressure decreases rapidly as flyer moves and flow field range expands. At 20 ns, the average pressure is basically zero, indicating a maximum velocity for flyer.
(Color online) Typical flow field pressure distribution.
(Color online) Average pressure of plasma flow field on flyer.
Flow field temperature diagrams at different times are presented in Figure 13. It is obvious that at initial stage of laser pulse, flow field temperature decreases gradually along axial direction for less laser energy deposited in film. At 22 ns, temperature distribution is relatively uniform, of around 17000–30000 K. While a temperature discontinuity appears in inner flow field at 30 ns with no laser energy source, dividing the entire flow field into high temperature zone and low temperature zone. The flow field towards laser has a higher temperature, of around 14000–18000 K, and flow field adjacent to flyer has a low temperature of about 2000–10000 K.
(Color online) Flow field temperature diagrams at different times. (a) 15 ns, (b) 22 ns, (c) 30 ns.
Ionized degree is an important parameter to reflect plasma particle composition, relating to flow field temperature and particle number density. Ionized degree distributions of plasma in axial at different times are plotted in Figure 14. Plasma ionization degree at different locations has little difference during laser pulse. Ionization degree increases gradually with laser action time. At 7.5 ns, ionized degree is of around 0.063, while it increases to 0.29 at 15 ns. At 45 ns, laser pulse has already disappeared and a ionized degree discontinuity appears in flow field. The zone adjacent to transparent substrate has a higher ionized degree of 0.43–0.48, indicating more electrical particle, while the flow field near flyer is a low ionized zone with a nearly zero ionized degree, indicating mainly high temperature gas.
(Color online) Ionization degree distributions of plasma.
Flyer temperature reflects its integrity in some extent. If most of the flyer's temperature far exceeds material vaporization temperature, it may indicates that flyer has already been ablated by plasma and is not intact. Flyer has a good integrity when flyer temperature is much lower for ablating. Compared with single-layered film, insulation layer in multi-layered film can hold back laser energy and prevent flyer from being ablated. In order to clarify the role of insulation layer, temperatures of computed element in axial at 11ns are plotted in Figure 15. Temperature of plasma flow field is of around 42600–42900 K while insulation layer temperature is about 2000 K, flyer temperature basically being 300 K, much lower than its vaporization temperature. It concludes that insulation layer can effectively prevent flyer from being ablated and make sure its integrity.
(Color online) Temperatures of computed elements in axial at different times in axial at 11 ns.
In laser driven flyer theoretical calculation, Gurney energy theory is normally used to calculate flyer maximum velocity, with the assumption of plasma velocity increasing from zero to flyer velocity linearly (Lawrence & Trott, Reference Lawrence and Trott1991). In order to analyze rationality of theoretical assumption, Fig. 16 plots plasma axial velocity profile at different times. Computed results show that plasma velocity increases linearly from zero to flyer velocity along flyer motion direction, indicating the rationality of theoretical calculation assumption.
(Color online) Axial velocity profile of plasma at different times.
CONCLUSION
Laser energy absorption coefficient should be modified to obtain accurate multi-layered flyer velocity with Gurney energy theory, considering laser energy increase deposited in ablation layer induced by insulation layer. Multi-layered flyer velocity is obviously higher than single-layered flyer at a laser energy density lower than 10 J/cm2. The difference between multi-layered flyer velocity and single-layered flyer velocity decreases gradually as laser energy density increases. Ablation layer has an optical energy absorption depth for each layer material.
A two-dimensional axisymmetric computation model of laser driven flyer has been established with the consideration of plasma absorption laser energy. Analysis of laser ablation film, plasma formation and flyer motion has been conducted. Numerical simulation of laser driven flyer full process has been achieved. Flyer nearly reaches maximum velocity at the end of laser pulse. Plasma velocity is nearly linear axially during flyer acceleration time. Insulation layer can decreases flyer temperature effectively to keep flyer integrity. Plasma ionization degree distribution is relatively uniform during laser pulse. After laser pulse, ionization degree near transparent substrate is higher, while ionization degree adjacent to flyer is nearly zero, indicating no plasma.