I. INTRODUCTION
Nuclear power acting as a kind of clean energy attracts much more attention attributing to its efficiency, reliability, and economic feasibility.Reference Liu, Lu, Liu, Ji and Gao1,Reference Liu and Wen2 It is worth to point out that the first demonstration nuclear power plant of the most advanced pressurized water reactors (PWRs) in the world have been constructing in China including Advanced Passive PWR 1000 MW (AP 1000), Advanced China PWR 1400 MW (ACP 1400, also named Hua-Long 1#), European Pressurized Water Reactor (EPR) et al.Reference Liu3
Steam turbine rotors are the key components of the power plant and can affect power plants’ efficiency and safety. With the development and application of large capacity in future turbines, higher strength and toughness are required for the steam turbine rotors, and their safety under service must also be improved. NiCrMoV steels used as plant structural component applications have been used to manufacture low pressure (LP) rotors in steam turbine rotors.Reference Klueh4,Reference Chen, Gu, Han and Pan5 Since the rotor shaft is more than 13 m long and the maximum diameter of the turbine shaft is more than 3 m with the weight of more than 260 tons, it is hard to achieve an integral forging rotor with uniform and high quality. Compared to forging rotors, welding processes have become an ideal means of manufacturing larger turbine components at appropriate filler metals and welding parameters.Reference Ramakrishnan and Muthupandi6 This method overcomes the conventional constraints on forging capacity and has great flexibility in structure design while also reducing the cost and fully utilizing the unique properties of different materials.Reference Shige, Magoshi, Itou, Ichimura and Kondou7
Multilayer and multipass welding techniques are often applied to components with thick walls.Reference Shige, Magoshi, Itou, Ichimura and Kondou7–Reference Murugan, Kumar, Raj and Bose9 The narrow-gap submerged-arc welding (NG-SAW) process is a high efficiency welding process with high deposition efficiency and excellent welding quality.Reference Karaoğlu and Seçgin10,Reference Gunaraj and Murugan11 During the welding process, the underlying layer is heat-treated by several subsequent layers, forming different microstructures including the column crystal zone and the reheated zone in each layer. The mechanical behavior of the welded metal is much more complex than that of single layer systems.Reference Lu, Liu, Wang, Wu, Cui and Huo12,Reference Prasad and Dwivedi13
For turbine rotors, excellent creep and fatigue properties are essential, but adequate toughness at ambient temperature should also be taken into account to avoid problems which possibly occur during the startup and shutdown of the nuclear power plant.Reference Liu, Cai, Deng and Lu14 Therefore, the evaluation of the toughness properties of inhomogeneous welded joint of welded rotors is vital. It is widely accepted that the existence of the martensite–austenite (M–A) constituent in the heat affected zone (HAZ) in the base metal causes a reduction on impact toughness.Reference Yu, Wang, Wang, Huang, Hou and Wu15–Reference Chen, Kikuta, Araki, Yoneda and Matsuda17 The intercritically reheated coarse-gained HAZ (ICCGHAZ) has the lowest impact toughness because of the thermal cycles introduced by multipass welding.Reference Di, An, Cheng, Wang, Guo and Xue16–Reference Lan, Qiu, Song and Zhao20 The peak temperatureReference Davis and King21–Reference Zhu, Kuzmikova, Li and Barbaro23 and the heat inputReference Di, An, Cheng, Wang, Guo and Xue16,Reference Shi and Han22,Reference Moeinifar, Kokabi and Hosseini24 during the welding thermal cycles are the key parameters resulting in the variation of the volume fraction, morphology, and distribution of the M–A constituent, which are the important factors of the toughness degradation. Zhu et al.Reference Zhu, Kuzmikova, Li and Barbaro23 pointed out that the fracture toughness of the CGHAZ is significantly reduced following exposure to a subsequent intercritical thermal cycle due to the presence of isolated large M–A constituent. Fracture toughness of the ICCGHAZ gradually improved as the intercritical temperature was increased. Di et al.Reference Di, An, Cheng, Wang, Guo and Xue16 found out that the M–A constituent with the necklace structure at lower second peak temperature led to worse toughness. And the increase of heat input at high second peak temperature would deteriorate toughness. Davis and KingReference Davis and King19,Reference Davis and King21 reported that the minimum impact toughness was not simply associated with the maximum amount of M–A constituent. The one with a near-connected grain boundary network of the blocky M–A constituent led to initiation of crack, which seemed to be more detrimental to toughness. Lan et al.Reference Lan, Qiu, Song and Zhao20 also reported that the M–A constituent could assist the formation of microcracks by interface debonding mechanism. According to the classical Griffith theory, the decrease in the crack initiation absorbed energy was mainly attributed to coarse M–A constituent. By contrast, Li et al.Reference Li and Baker18 supported the view that the elongated stringer M–A constituent was more likely to debond from the matrix while the blocky M–A constituent was more likely to crack. When the triaxial stresses were high, cracking of the blocky M–A constituent was the most important factor in the initiation of brittle fracture, but in other parts of the microstructure where the triaxial stresses were lower, decohesion associated with the stringer M–A constituent with a lower interfacial energy developed into voids leading to the formation of cracks. However, the influence of the M–A constituent on toughness of the weld metals has not been investigated as fully as that on the HAZ of the base metal. Most of the research articles attribute the toughness deterioration to the M–A constituent, but they don’t refer to the properties of the weld metal. This is maybe due to the difficulty of evaluating the mechanical properties of the reheated zone separately since the reheated zone is too narrow.Reference Matsuda, Fukada, Okada, Shiga, Ikeuchi, Horii, Shiwaku and Suzuki25
The present work focused on the toughness weak zone of the welded joint in NiCrMoV steel. The cross-zone quasi-static fracture toughness test was used to determine the local brittle zone of the welded joint and thermal simulated specimens were used to investigate the influence of the M–A constituent on toughness in the weak zone. These results intend to be used for future improvements to the manufacturing of larger turbine components with the aim of increasing the toughness of welded NiCrMoV steel components.
II. MATERIALS AND EXPERIMENTAL PROCEDURES
A. Materials and test component manufacturing
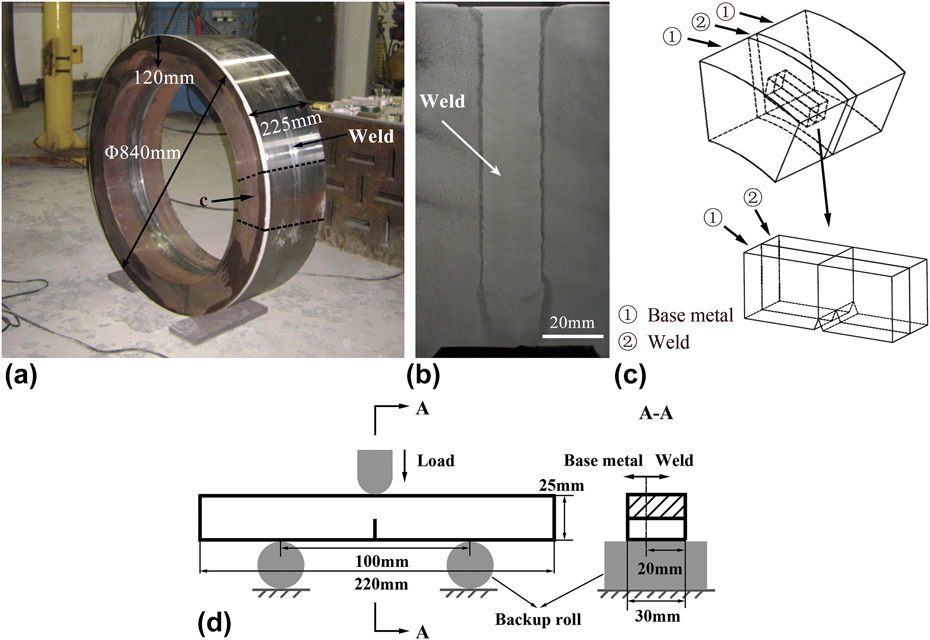
A welded nuclear power rotor circular test component of 25Cr2Ni2MoV steel was manufactured using NG-SAW (Polysoude S.A.S., Nantes, France) in a multilayer and multipass process. The outside diameter and the internal diameter of the test component are 840 mm and 600 mm, respectively. The depth of the welds is 120 mm, and a U-type groove is used with 1° angle. The width of the welds at the bottom is about 20 mm. Each layer is filled with two weld passes. Figure 1 shows the outside [Fig. 1(a)] and welded joint design [Fig. 1(b)] of the test component. The compositions of the base metal and weld metal used in this study are given in Table I. The welding current and voltage for each pass were around 450 A and 28 V, respectively. The welding speed was 8 mm/s. The preheating temperature and interpass temperature were 200 °C and 280 °C, respectively. The heat input for each pass and layer was optimized to be 15.75 kJ/cm. The welding wire diameter was 3.2 mm.
The welded rotor component of 25Cr2Ni2MoV steel and the schematic of cross-zone fracture toughness test: (a) the welded rotor test component, (b) the multilayer and multipass welded joint, (c) the method to machine the cross-zone fracture toughness test specimen from the welded component, and (d) schematic of the cross-zone quasi-static fracture toughness test.

Chemical compositions of base metal (25Cr2Ni2MoV steel) and weld (wt%).

B. Cross-zone quasi-static fracture toughness test
To compare the difference of toughness among the welds, the HAZ and the base metal in the welded joint, a particular cross-zone quasi-static fracture toughness specimen of the welded joint was prepared. Generally, the plain strain fracture toughness is a property of homogeneous materials, which means crack starts and propagates in the homogeneous material. In this test, the crack tip included the welds, the HAZ, and the base metal at the same time. The way of machining specimen from the test component is shown in Fig. 1(c).
Three-point bending quasi-static fracture toughness test was conducted on precracked rectangular bar specimen whose shape and dimensions are shown in Fig. 1(d). The specimen was cut into 220 × 30 × 25 mm. The width of the base metal and the HAZ was 10 mm and the width of the welds was 20 mm in the specimen. The initial machined-notch depth was 10 mm. The fatigued precrack was introduced into the specimen with the depth of 3–5 mm. The test was conducted at a cross-head speed of 0.02 mm/s by an MTS 810-50T universal testing machine (MTS Systems Corporation, Eden Prairie, Minnesota) according to ISO 12135:2002 standards at room temperature. To investigate fracture modes, the fracture surface was observed by using a scanning electron microscope (SEM; TESCAN LYRA3, TESCAN, Brno, Czech Republic).
C. Thermal simulation test
The end of the column crystal in the underlying layer of the welds is reheated by several subsequent layers during the multilayer and multipass welding forming the tempered zone, the incomplete phase transition zone, and the normalized zone as similar as the HAZ of the base metal in the welds. The toughness of the reheated zone in the welds tends to be deteriorated by the complex thermal cycles. The real reheated zone in the welds is too narrow with the width of less than 1 mm. Therefore, it is difficult to distinguish the different zones suffering from different reheated peak temperatures in the reheated zone and evaluate the mechanical properties. To overcome this problem, two-cycle thermal simulation test was used to magnify the zone of the fine structure in the reheated zone and investigate the temperature effect of welding on the variation of the metallurgical and mechanical characteristics.
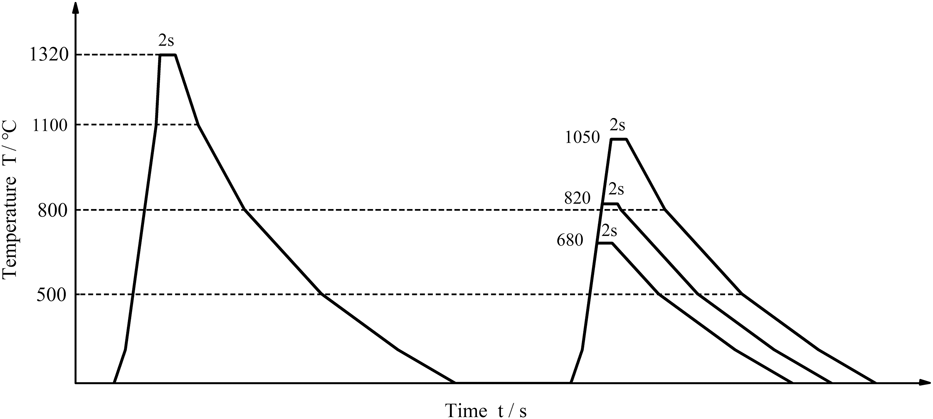
The specimens were cut into 60 × 11 × 11 mm for the welding thermal cycle simulation from the center of the welds in the as-welded condition. The test was conducted on Gleeble 1500D (Data Sciences International, Inc., Saint Paul, Minnesota). The schematic illustration of simulated thermal cycles is shown in Fig. 2. The maximum temperature, heating rate, holding time, and cooling rate of the thermal cycle parameters were selected according to the welding process during submerged arc welding. During the first thermal cycle, the specimens were heated to the peak temperature of 1320 °C at a rate of 200 °C/s and kept for 2 s. The cooling time of temperature dropping from 800 °C to 500 °C was 25 s. The welds transformed to the equiaxed crystal during the first thermal cycle. The Ac1 (the initial temperature of the austenite transition) and Ac3 temperatures (the final temperature of the austenite transition) of the welds were measured as 740 and 890 °C by using the dilatometer before the thermal simulation test. Therefore, three second-peak temperatures were chosen to simulate the tempered zone, incomplete phase transition zone, and normalized zone in the reheated zone of welds with the peak temperature of 680, 820, and 1050 °C during the second thermal cycle. The cooling time of temperature dropping from 800 to 500 °C and the holding time at the peak temperature were the same as the first thermal cycle.
Schematic of thermal cycle curve under different second peak temperature.

After the thermal simulation test, the simulated specimens were cut and ground to the standard Charpy size of 10 × 10 × 55 mm. The Charpy impact test was carried out at −50 °C according to the ISO 148-1:2006 standards.
D. Metallographic observations
Microstructure of the cross-zone quasi-static fracture toughness specimen and the simulated reheated zone of weld were observed by using an optical microscope (OM; Olympus CX14, Olympus Corp., Tokyo, Japan) and a SEM. The chemical composition was analyzed by an energy dispersive X-ray detector (EDS) attached to the SEM. All sectioning of specimens was carried out using the wire-cut electric discharge machine. The sectioned specimens were polished using conventional metallographic procedures and chemically etched by 4 vol% Nital. The fraction of the M–A constituent and the average length and width of the M–A constituent were measured on SEM micrographs using Adobe Photoshop CS6 (Adobe Systems Software, Dublin, Ireland) and Image Pro Plus 6.0 (Media Cybernetics, Rockville, Maryland).
For fine structure analysis of the M–A constituent, thin foil transmission electron microscopy (TEM) specimens were prepared from 3-mm-diameter cylinders removed from the reheated zone of the weld and around. The cylinders were cut into disks with the thickness of 500 μm, and then, the disks were ground to a final thickness of 60 μm using SiC paper and further disks were electropolished to the thickness of less than 100 nm using a Struers TenuPol-5 electropolisher (Struers Inc., Cleveland, Ohio) with a 5% perchloric acid/methanol solution cooled to −25 °C. Twin jet electropolishing at a current of 30–40 mA was used. The TEM specimens were observed by JEOL JEM 2010F (JEOL Ltd., Tokyo, Japan) with the electric voltage of 200 kV.
III. RESULTS AND DISCUSSION
A. Determination of the toughness weak zone of welded joint
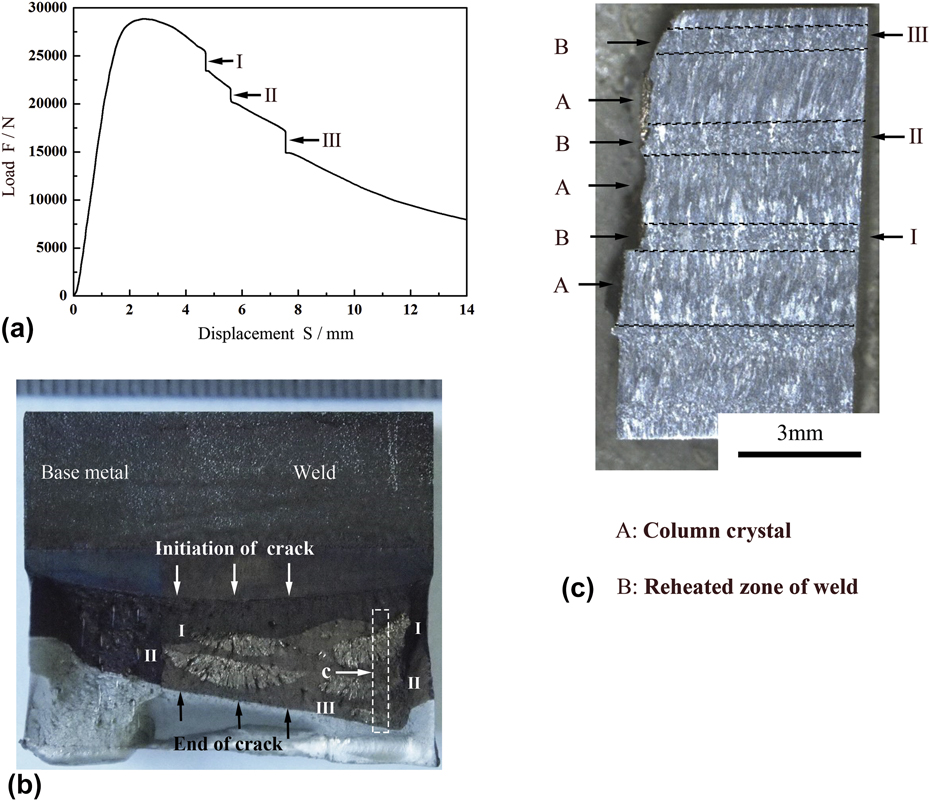
The load–displacement curve of the cross-zone quasi-static fracture toughness test is shown in Fig. 3(a) and the corresponding fracture appearance is shown in Fig. 3(b). The left part of the fracture surface shown in Fig. 3(b) locates in the base metal and right part of the fracture surface locates in the welds. The boundary of the two parts is clear. The length of crack propagation in the base metal is shorter than that in the welds at the same test load which indicates that the quasi-static fracture toughness of the base metal is better than that of the welds.
Test results of cross-zone fracture toughness: (a) the load–displacement curve, (b) the macrograph of the fracture surface, and (c) the macrograph of metallograph [the direction of observation along the white arrow in (b)].

The crack propagates in a stable manner at the ascent stage of the curve both in the base metal and the welds as shown in Figs. 3(a) and 3(b). However, it can be found out that there are three unloading points numbered from I to III in the load–displacement curve during the declining stage of the curve, and correspondingly, there are several silver sector areas with brittle fracture appearances on the fracture surface of the welds as shown in Fig. 3(b). There is one-to-one correspondence between the uploading points and the local brittle fracture zones. The local brittle fracture zones in the welds are the toughness weak zones of the welded joint relatively.
To determine the location of the local brittle zones in the welds, the metallographic specimen was prepared. The specimen was carried out along the white dotted box marked in Fig. 3(b) using the wire cut electric discharge machine. The direction of the metallographic observation is indicated by the white arrow as shown in Fig. 3(b). Figure 3(c) shows the macrograph of the metallograph. It is obvious that the local brittle zones locate between two weld layers. The brittle fracture areas are the reheated zones locating in the underlying weld layer heat-treated by several subsequent layers.
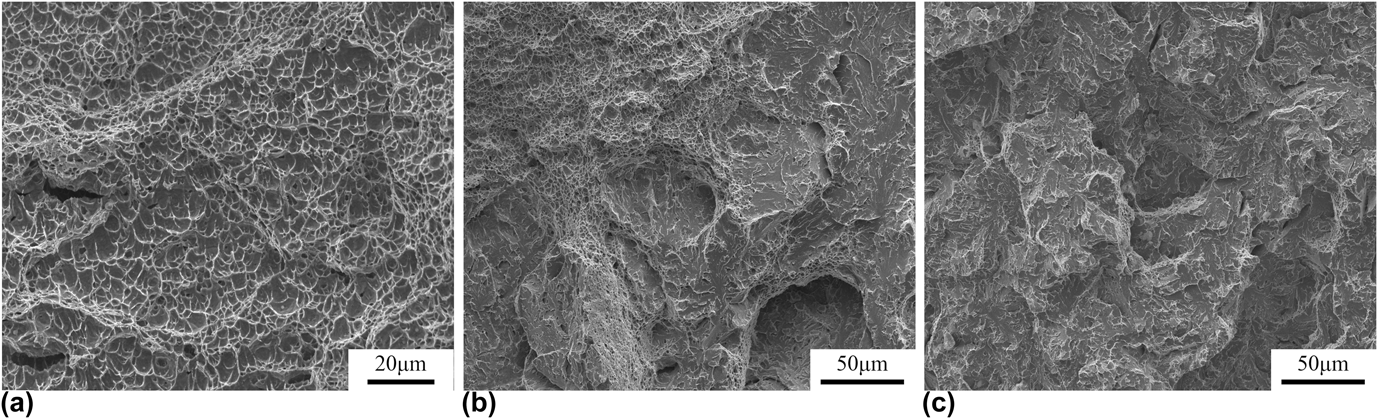
Further correlation of the fracture appearance and the metallographic structure are shown in Fig. 4. The fracture surfaces shown in Fig. 3(b) were characterized by SEM to evaluate the fracture mode. It can be seen that the fracture appearance of the column crystal is in dimples [Fig. 4(a)], which means a ductile fracture. It is worth noting that there exist several secondary cracks on the surface which are benefit for the improvement of toughness. Figure 4(b) is the juncture area where the fractography transfers from ductile fracture to the brittle fracture. On the brittle fracture surfaces, quasi-cleavage surfaces and dimpled-tearing ridges can be seen. The fracture appearance of the reheated zone of the welds [Fig. 4(c)] is rocky and in quasi-cleavage, which means a typical brittle fracture. The characteristics of brittle fracture are consistent with the unstable propagation of the crack. The cleavage facet size is associated to the average size of prior austenite grain. It can be concluded that the fractography varies from ductile fracture to a fracture mode with both brittle and ductile fracture feature. Finally, the fractography is brittle fracture completely. The crack propagates from the column crystal to the reheated zone of the welds correspondingly.
SEM micrographs of the fracture surface of the cross-zone fracture toughness specimen: (a) stable propagation of crack, (b) juncture area, and (c) unstable propagation of crack.

The reheated zone of the welds is the toughness weak zone of the welded joint at the case of the crack propagation direction shown in the cross-zone quasi-static fracture toughness test. The metallurgical and mechanical characteristics of the reheated zone of the welds need to be future investigated to make clear the brittle fracture.
B. Effect of the M–A constituent in the reheated zone of weld on toughness
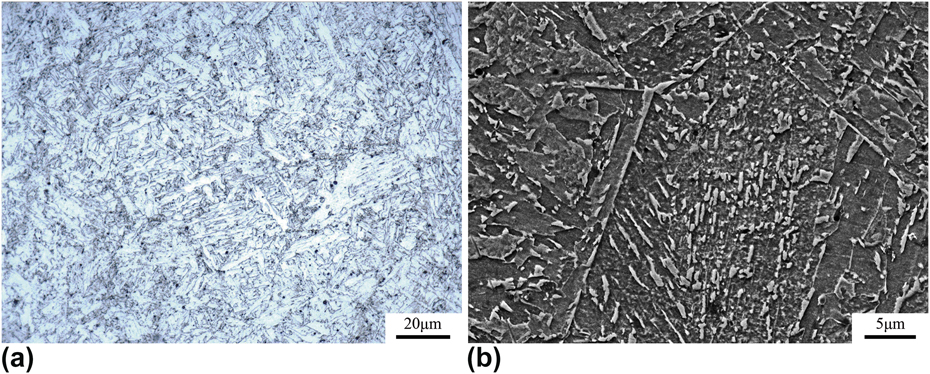
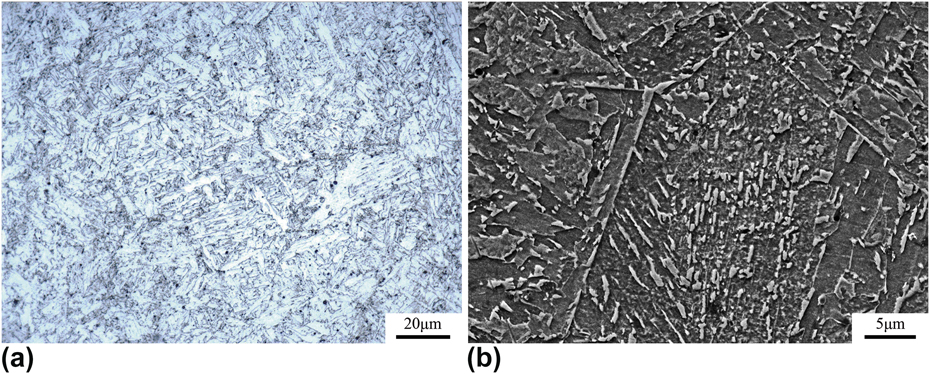
OM metallograph and SEM micrograph of the real reheated zone of the welds are shown in Figs. 5(a) and 5(b). The microstructure of the reheated zone in the welds is the fine grain zone. The average diameter of the fine grains is about 50 μm, which is consistent with the size of cleavage facet size shown in Fig. 4(c). The carbon-enriched constituent is observed along the austenite grain boundaries and inside the grains in Fig. 5(a). According to the morphology characteristics shown in Fig. 5(b), the carbon-enriched constituent is M–A constituent. Two morphologies of the M–A constituent with the shape of slender and blocky are observed in the micrograph. The M–A constituent along the prior austenite grain boundaries is mainly slender particles with the width of 0.4 μm approximately and the length greater than 2 μm. The longest one is nearly 6 μm. While both blocky and slender M–A constituents are observed in the prior austenite grains along the bainitic ferrite lath forming the structure of ‘necklace’. There are three kinds of bainitic ferrite including BI, BII, and BIII bainitic ferrite.Reference Hiroshi, Hiroaki and Toyoaki26 Among them, BI usually named carbon-free bainitic ferrite is the main reason of toughness reducing because of the bainitic ferrite coexisting with the M–A constituent.
Images show the reheated zone in multilayer welds: (a) OM metallograph and (b) SEM micrograph.
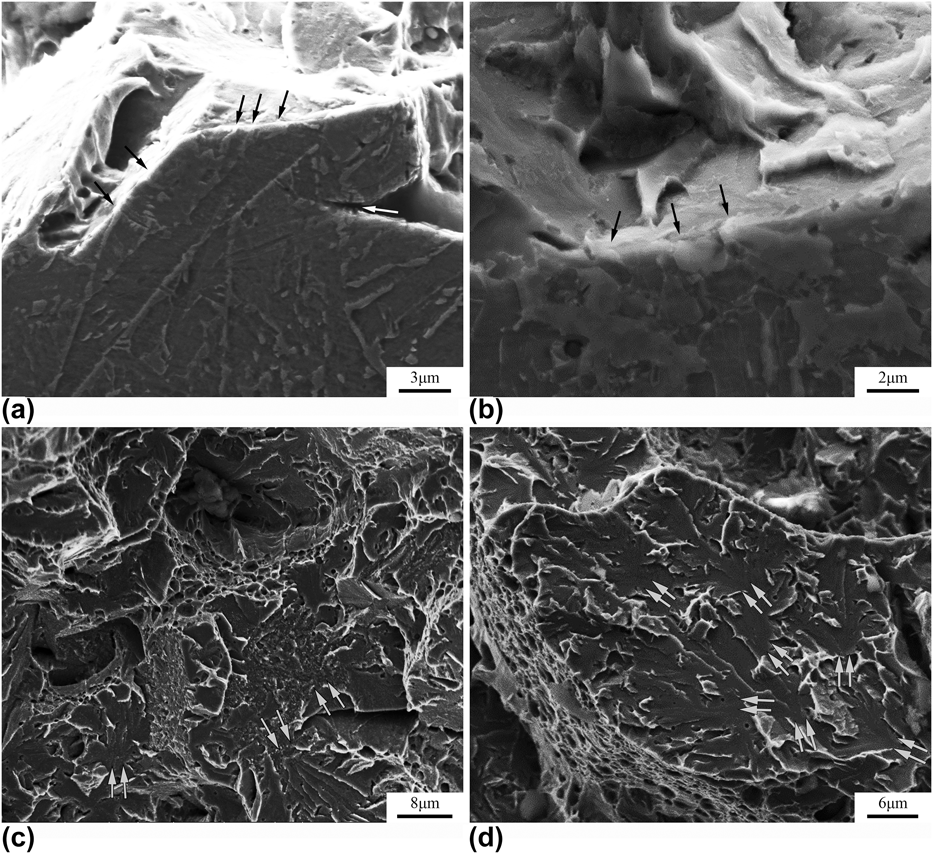
Figures 6(a) and 6(b) show the SEM micrographs of the reheated zone of the welds near the fracture surface. The large blocky M–A constituent is found close to the fracture surface indicated by the black arrows and white arrow in the images. A slender M–A constituent is also indicated by the leftmost arrow in Fig. 6(a).
SEM micrographs of cleavage initiated by the M–A constituent within the reheated zone of the welds in the fracture toughness test specimen: (a) and (b) initiating particles near the fracture surfaces (the white and black arrows indicate the M–A constituent), and (c) and (d) the initiation sites on the fracture surfaces.

Several investigationsReference Yu, Wang, Wang, Huang, Hou and Wu15,Reference Di, An, Cheng, Wang, Guo and Xue16,Reference Kim, Lee, Kim and Lee27–Reference Li, Fan, Ma, Subramanian and Shang29 have shown that the M–A constituent is the main cause of the deterioration on toughness in low alloy steels, which have suffered from complex welding thermal cycles. Some possible mechanisms have been proposed in the research articlesReference Chen, Kikuta, Araki, Yoneda and Matsuda17,Reference Li and Baker18,Reference Davis and King21,Reference Akselsen, Grong and Solberg30–Reference Lanzillotto and Pickering32 to explicate the M–A constituent causing the reduction in toughness. They have been summarized by Davis and KingReference Davis and King19 in their research article.
On the one hand, the M–A constituent is a kind of brittle phase. They can rupture into pieces with the cracks propagating across them. The example of crack propagating through the M–A constituent is seen in Fig. 6(a) indicated by the white arrow. The M–A constituent appears in two distinct morphologies including slender particles and blocky particles. The research results of Davis et al.Reference Chen, Kikuta, Araki, Yoneda and Matsuda17,Reference Davis and King19,Reference Sakuma, Matsumura and Takechi33,Reference Lee, Kim and Lee34 point out that the slender M–A constituent shows the crack readily and provide no effective obstacle to crack propagation. Li and BakerReference Li and Baker18 observe the cracking of both the slender and blocky types of M–A constituents on the vertical sections close to the fracture surface and on the fracture surface. The same phenomena are observed in the present work shown in Figs. 6(a) and 6(b) marked by black arrows. On the other hand, microcracks can be formed at the boundary between the M–A constituent and the bainitic ferrite matrix. These microcracks initiate cleavage fracture in the bainitic ferrite matrix. Through interfacial decohesion, the microcracks propagate either in a brittle manner or via the linking of other debonded regions.Reference Chen, Kikuta, Araki, Yoneda and Matsuda17,Reference Davis and King19,Reference Ranade, Barbara, Williams, Munroe and Krauklis35 In the present work, several initiation sites are observed in the cleavage fracture surfaces of the reheated zone in the welds shown in Figs. 6(c) and 6(d) marked by white arrows. The fractographic investigation presents that the microcracks propagate in a brittle manner [Fig. 6(c)] and via the linking of other debonded regions [Fig. 6(d)].
During welding thermal cycles, subsequent layers cause additional thermal influence on the existing reheated zone of the welds. Retransformation partially occurs at the prior austenite grain boundaries.Reference Moeinifar, Kokabi and Hosseini36 When cooling, the austenite transforms to the M–A constituent. The austenite to martensite transformation introduces a dilatational component of 0.04Reference Porter, Easterling and Sherif37 resulting in significant elastic and plastic strains in the surrounding bainitic ferrite matrix.Reference Lanzillotto and Pickering32 The residual stress will promote the cleavage fracture. In addition, the M–A constituent has a higher hardness than the surrounding bainitic ferrite matrix. The EDS results in the present work show that the carbon content in the M–A constituent is 0.97 mass%; however, the carbon content in the surrounding matrix is 0.07 mass%. Matsuda et al. suggest that the hardness of the M–A constituent is increased with the carbon content.Reference Matsuda, Fukada, Okada, Shiga, Ikeuchi, Horii, Shiwaku and Suzuki25 The investigation of Komizo et al.Reference Komizo and Fukada38,Reference Mohseni, Solberg, Karlsen, Akselsen and Østby39 shows that the peak points in carbon content of the M–A constituent are 1.07–1.32 mass%, although the carbon contents in the base metal are 0.025–0.19 mass%. The Vickers hardness of the M–A constituent shows higher values of Hv = 650–700 than the matrix with the Vickers hardness values of Hv = 215–221. Therefore, there is a significant inhomogeneity of mechanical properties between the M–A constituent and the matrix surrounding them. When loading at a certain point, the matrix begins to deform plastically and shed load to the M–A constituent. This may cause microcracks forming at the boundary between the M–A constituent and the bainitic ferrite matrix.Reference Li and Baker18,Reference Davis and King19 As load increases, the microcracks initiate cleavage fracture in the bainitic ferrite matrix.
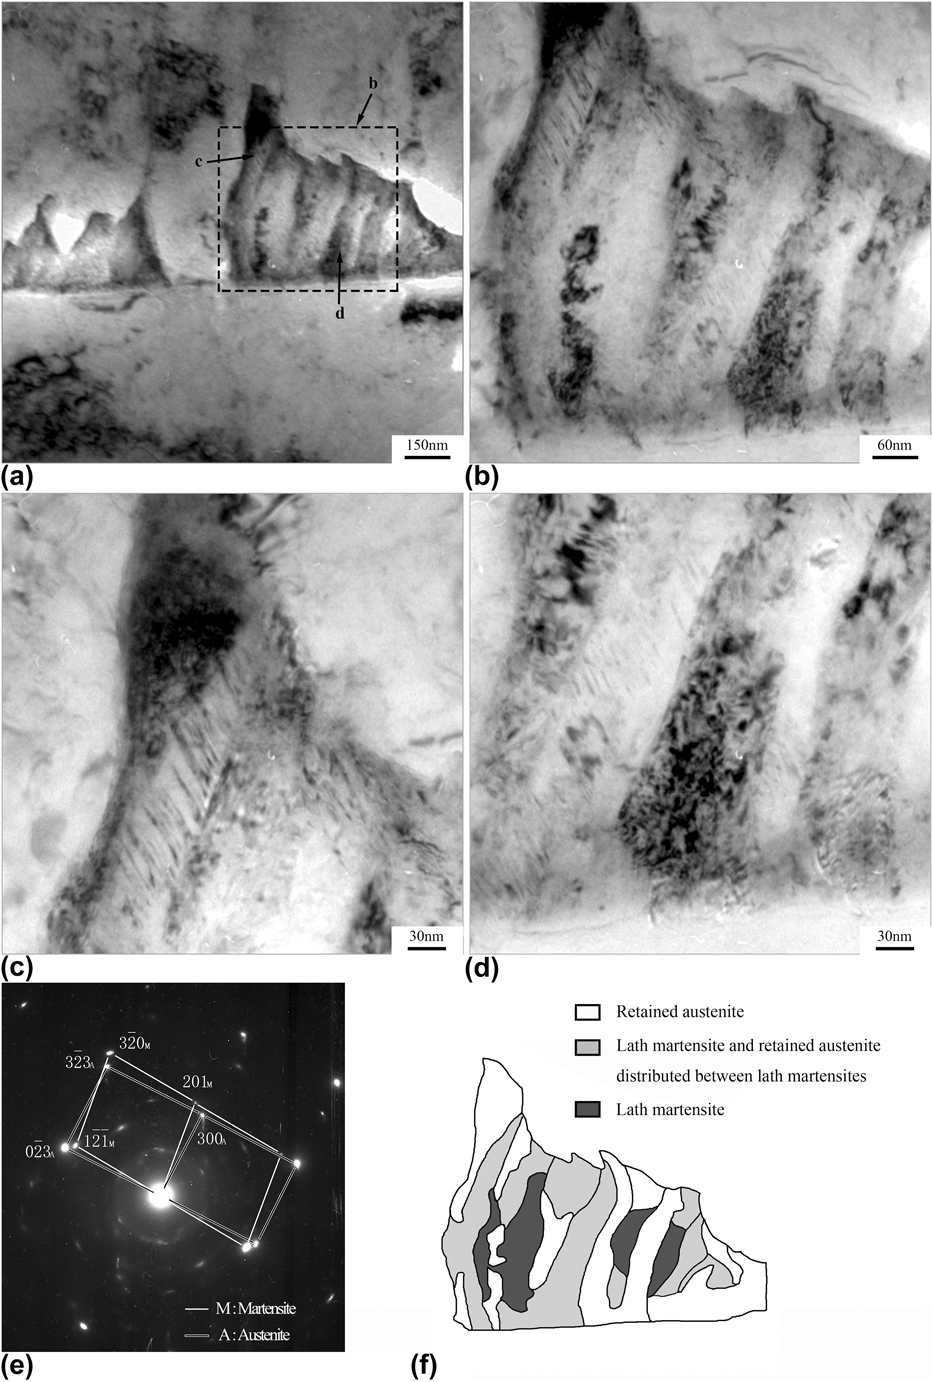
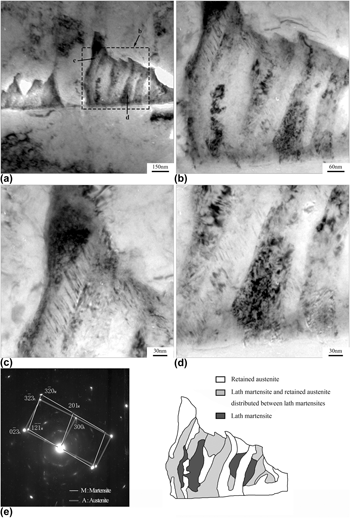
Figure 7 shows the typical morphology of the M–A constituent forming in the reheated zone of the welds. A bright image shown in Fig. 7(a) exhibits the M–A constituent along a straight prior austenite grain boundary. The fine structure of the M–A constituent marked by dotted box is shown in Fig. 7(b). Figures 7(c) and 7(d) are the enlargements marked by the arrows in Fig. 7(a). The black areas in the enlarged parts represent the retained austenite. The bright areas represent the martensite. The bright areas with black films in it represent the distribution of lath martensite and retained austenite in the M–A constituent. In the M–A mixture microstructure, the generated martensite laths are side by side and the black retained austenite films are distributed along martensite laths. The selected area electron diffraction [Fig. 7(d)] taken from Fig. 7(c) includes  ${\left[ {2\;3\;\bar{4}} \right]_{\rm{M}}}$ (martensite, body-centered cubic structure) and
 ${\left[ {0\;\bar{3}\;2} \right]_\gamma }$ (austenite, face-centered cubic structure). The illustration of the fine structure of the M–A constituent shown in Fig. 7(a) marked by dotted box displays in Fig. 7(f). The white areas represent the retained austenite. The light gray areas represent the lath martensite and retained austenite distributed between martensite laths. The dark gray areas represent the lath martensite. The proportion of the retained austenite is the same as that of M–A mixture microstructure which is higher than that of lath martensite.
TEM results of fine structure of M–A constituent: (a) bright image of M–A constituent along grain boundary, (b), (c), and (d) enlargements of area marked by black arrows in (a), (e) electron diffraction pattern, and (f) illustration of fine structure of M–A constituent.

C. Effect of the second peak temperature on the M–A constituent and impact toughness
Two-thermal-cycle simulation test was used to magnify the fine structure of the reheated zone and investigate the effect of different second temperature on the variation of the metallurgical characteristics and toughness.
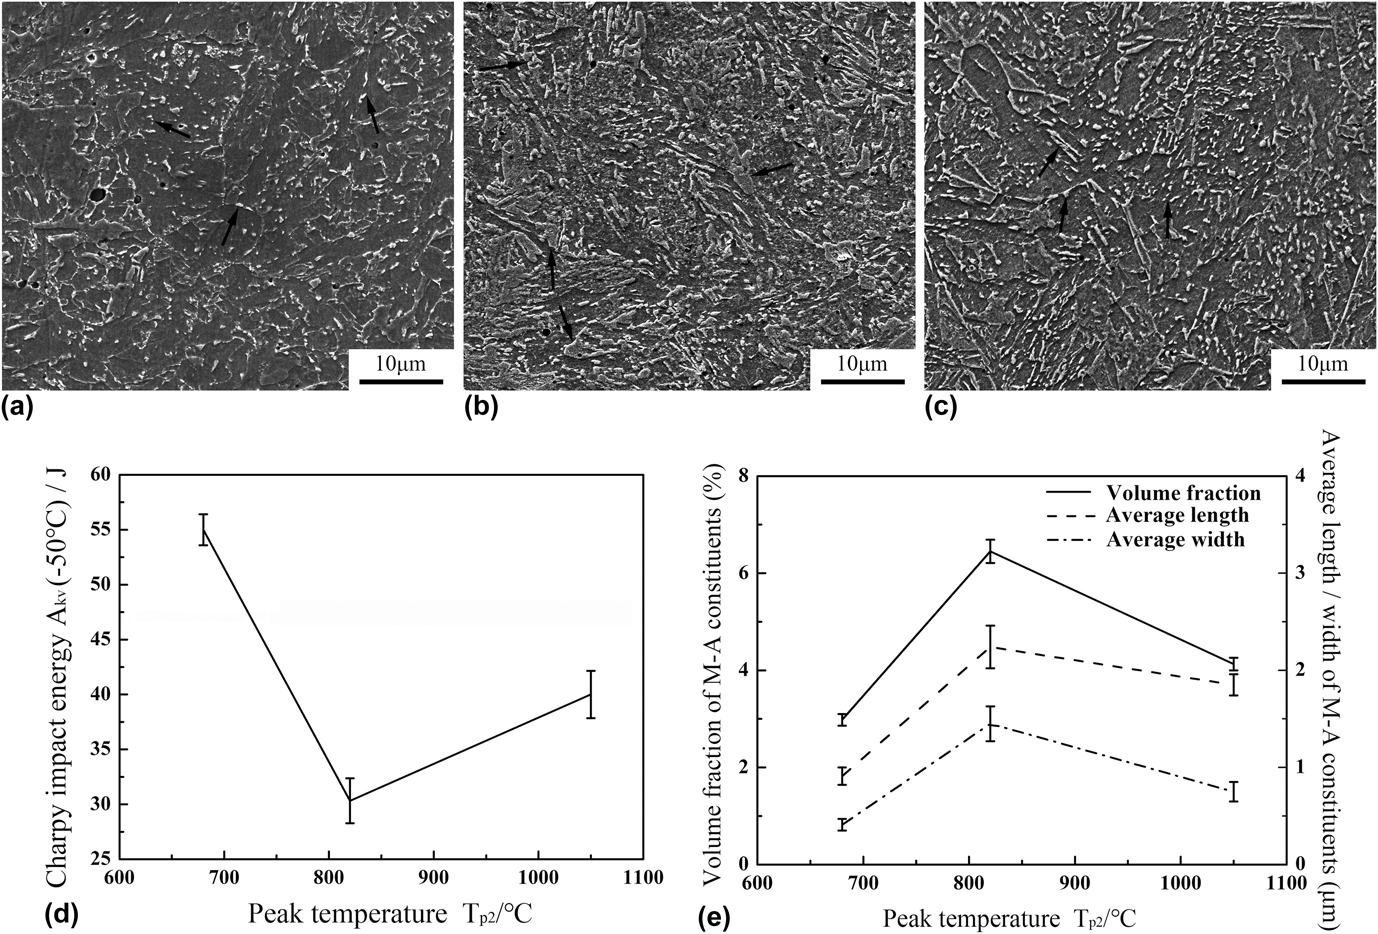
Figure 8 shows the result of metallurgical and mechanical investigations of the M–A constituent that have suffered from different second peak temperature. The SEM micrographs of the simulated specimens near the thermocouple are shown in Figs. 8(a)–8(c). The typical M–A constituent is marked by black arrows in the images. The Charpy impact energy of the simulated specimens at −50 °C is shown in Fig. 8(d). The values of the Charpy impact energy were calculated by averaging three specimens suffering the same thermal cycles. The simulated incomplete phase transition zone in the reheated zone of the welds exhibits the lowest Charpy impact energy with the value of 30.3 J. The simulated normalized zone in the reheated zone of the welds exhibits relatively high Charpy impact energy level (40.0 J). The Charpy impact energy of the simulated tempered zone in the reheated zone of the welds is the highest and the average value is about 55.0 J. In addition, the Charpy impact energy values for simulated incomplete phase transition zone and the simulated normalized zone are relatively scattered in contrast to the simulated tempered zone.
Metallurgical and mechanical investigations of the M–A constituent that have suffered from different second peak temperature: (a)–(c) SEM micrographs illustrate the distribution and morphology of the M–A constituent [(a) T p2 = 680 °C, (b) T p2 = 820 °C, and (c) T p2 = 1050 °C)], (d) variation of Charpy impact energy at −50 °C with different second peak temperature, and (e) characteristic parameters of M–A constituent.

Characteristic parameters of the M–A constituent that have suffered from different second peak temperature are shown in Fig. 8(e). The size of the M–A constituent is defined by measuring the length and width. The volume fraction and size of the M–A constituent were calculated by averaging at least four SEM micrographs. It is found that the volume fraction of the M–A constituent in the simulated incomplete phase transition zone exhibits the highest with the value of more than 6%. A lot of blocky M–A constituent exists along the prior austenite grain boundaries and inside the grains [Fig. 8(b)]. The average width and length of the M–A constituent are more than 1 μm and 2 μm, respectively. However, the simulated normalized zone exhibits relatively low volume fraction of the M–A constituent (4.13%). In the simulated normalized zone [Fig. 8(c)], more slender M–A constituents exist along the prior austenite grain boundaries and inside the grains. The amount of the M–A constituent inside the grains is less at the same time. The average width and length of the M–A constituent are 0.81 μm and 1.85 μm, respectively. Furthermore, the lowest volume fraction of the M–A constituent occurs in the simulated tempered zone with the value of 2.98%. In the simulated tempered zone, the fine particles of the M–A constituent distribute along the prior austenite grain boundaries and inside the grains in a homogeneous dispersion state. Part of the prior austenite grain boundaries are difficult to identify. The amount of the M–A constituent in the simulated tempered zone is much less than that of the M–A constituent in the simulated incomplete phase transition zone. The average width and length of the M–A constituent in the simulated tempered zone are only 0.48 μm and 0.91 μm, respectively. It is found that the impact toughness deteriorated gradually with the increase of the M–A constituent volume fraction. The maximum deterioration on toughness occurs at the second peak temperature of 820 °C which is between the Ac1 temperature and Ac3 temperature. The typical morphology of the M–A constituent transforms from the shape of slender to the shape of blocky at the same time. The result in the present work is similar to previous investigations. Davis and Zhu et al.Reference Davis and King21–Reference Zhu, Kuzmikova, Li and Barbaro23,Reference Zhu, Kuzmikova, Li and Barbaro40 suggest that maximum deterioration on toughness occurs at the second peak temperature just above the Ac1 temperature where the blocky M–A constituent formed along the grain boundaries in the shape of a necklace pattern.
The incomplete phase transition zone is the region where only part of the microstructure transforms into austenite in the second thermal cycle. Moeinifar et al.Reference Moeinifar, Kokabi and Hosseini24 suggest that the transformation of ferrite to austenite occurred particularly where austenite is stable. Therefore, the existing M–A constituent having formed during the first thermal cycle and the prior austenite grain boundaries are expected to act as preferential nucleation of the newly formed austenite during the second thermal cycle. At the same time, the carbon diffuses from the surrounding bainitic ferrite matrix to the newly formed austenite because of the solubility difference. Due to the stabilizing effect of the high carbon content, carbon-enriched austenite island partially transforming to large blocky M–A constituent on the cooling stage contributes to the generation of much more blocky M–A constituents. A concentration of large blocky M–A constituent at prior austenite grain boundaries and inside prior austenite grains is observed in Fig. 8(b), which connects with each other to form a network. The formation of blocky M–A constituent is the dominant contributor to the toughness deterioration.Reference Matsuda, Fukada, Okada, Shiga, Ikeuchi, Horii, Shiwaku and Suzuki25 Okada et al.Reference Okada, Ikeuchi, Matsuda and Hrivnak41 suggest that there appears to be poor correlation between the impact toughness and the volume fraction of slender M–A constituent, but a good correlation between the impact toughness and the volume fraction of blocky M–A constituent. The lower toughness of the ICCGHAZ may be attributed to preferential distribution of the blocky M–A constituent along the prior austenite grain boundaries. In our work, the blocky M–A constituent distributes not only along the prior austenite grain boundaries but also inside the grains which may be more detrimental to the toughness. When the second peak temperature is 680 °C, the peak temperature is lower than the Ac1 temperature and the simulated tempered zone suffers a high temperature tempering. The retained austenite in the M–A constituent partly decomposes to a softer ferrite matrix with the supersaturated carbon precipitating from the matrix. The lath martensite in the M–A constituent with relatively high carbon content transforms to the tempered martensite with carbide precipitates. So, the majority of the M–A constituent disappears, which leads to the improvement of impact toughness. For the normalized zone, the second peak temperature is 1050 °C, which is much higher than the Ac3 temperature. The microstructure transforms into austenite completely in the second thermal cycle. The carbon diffuses from the carbon-enriched areas to the newly formed austenite uniformly resulting in the reduction of the inhomogeneity of the microstructure because of the higher temperature.
D. Methods of improving toughness
To weaken the detrimental effect of the M–A constituent, the welding heat input is one of the critical factors.Reference Di, An, Cheng, Wang, Guo and Xue16,Reference Shi and Han22,Reference Xu, Wang, Pan and Yang42 With the reduction of the welding heat input, the width of the reheated zone in the welds suffering the temperature between Ac1 and Ac3 could be reduced. Meanwhile, smaller heat input could improve cooling rateReference Moeinifar, Kokabi and Hosseini24,Reference Matsuda, Fukada, Okada, Shiga, Ikeuchi, Horii, Shiwaku and Suzuki25 and the diffusion of carbon is limited to a lower extent resulting in the reduction of the inhomogeneity of the mechanical properties between the M–A constituent and bainitic ferrite matrix surrounding them.
Besides reducing the welding heat input, a suggestion of optimizing weld wire chemical compositions by increasing Mo element content and reducing Ni element content at the same time is proposed. Ni element is an important alloy ingredient to improve mechanical properties. However, the addition of Ni element decreases Ac1 temperature of steels obviously while affects Ac3 temperature not obvious, which enlarges the austenite formation temperature range between Ac1 temperature and Ac3 temperature. On the other hand, austenite formation temperature range could also be narrowed by the addition of Mo element, which increases the Ac1 temperature of steels. Since the M–A constituent in the welds has an obvious influence on toughness and reducing the amount of the M–A constituent is helpful to improve the toughness, increasing Mo element content and reducing Ni element content could decrease austenite formation temperature range to weaken the condition for generation of M–A constituent. What is more, Mo element is helpful to reduce tempering brittleness during the cooling process since large components have to be cooled slowly to reduce thermal stress. The optimum chemical compositions of Ni element and Mo element need further investigations.
IV. CONCLUSIONS
The local brittle zone of the welded joint in NiCrMoV steel nuclear power LP rotor test component was investigated and the effect of M–A constituent in the reheated zone of welds on toughness was analyzed. The following conclusions can be reached.
(1) Cross-zone quasi-static fracture toughness was used to find out the weak zone of toughness in the welded joint. Metallographic analysis and fracture analysis displayed that the quasi-static fracture toughness of the base metal was better than that of the welds and the reheated zone in multilayer and multipass welds was the weakest zone of the toughness in the welded joint.
(2) The M–A constituent in the reheated zone of welds promoted the initiation and propagation of crack which was disadvantageous to the fracture toughness. The fine structure of the M–A constituent contained retained austenite areas, martensite areas, and M–A mixture microstructure in which the generated lath martensite was side by side and the retained austenite film was distributed along martensite laths.
(3) The morphology and distribution of the M–A constituent were strongly influenced by second peak temperature in the simulated reheated zone of welds. The investigation showed that the impact toughness of incomplete phase transition zone was lower than that of tempered zone and normalized zone in the simulated reheated zone of welds. The impact toughness deteriorated drastically in the incomplete phase transition zone related to the formation of mixture microstructure in which large blocky M–A constituent at prior austenite grain boundaries and inside prior austenite grains connected with each other to form a network.
ACKNOWLEDGMENT
The authors gratefully acknowledge the financial support by the National Natural Science Foundation of China under Grant No. 51775300.