1. Introduction
Financial and insurance companies have a primary objective of assessing risks associated with financial losses or insurance claims. The value-at-risk (VaR) measure, introduced in J.P.Morgan/Reuters (1996), has been widely used for quantifying these risks. However, studies have shown that assuming normality in returns or losses is unrealistic due to heavy tails and excess kurtosis, as highlighted among others by McNeil (Reference McNeil1997), McNeil et al. (Reference McNeil, Frey and Embrechts2015), Embrechts et al. (Reference Embrechts, McNeil, Straumann, Dempster and Moffatt2001), Eling (Reference Eling2012) and Ignatieva and Landsman (Reference Ignatieva and Landsman2015, Reference Ignatieva and Landsman2019, Reference Ignatieva and Landsman2021).
To address the limitations of VaR and the unrealistic assumption of normality in financial and insurance data, numerous studies have sought alternative approaches. The foundation for developing and applying multivariate symmetric distributions, particularly elliptical distributions, was laid by Fang et al. (Reference Fang, Kotz and Ng1990), providing a comprehensive framework for constructing these distributions. Barndorff-Nielsen (Reference Barndorff-Nielsen1977, Reference Barndorff-Nielsen1978) introduced the (univariate) generalised hyperbolic (GH) distribution, which was later explored by Ignatieva and Landsman (Reference Ignatieva and Landsman2015) to derive conditional risk measures, with a focus on tail conditional expectation (TCE) for assessing tail risk in loss severity. The most recent work by Ignatieva and Landsman (Reference Ignatieva and Landsman2021) extends this framework by introducing the generalised hyper-elliptical (GHE) distribution, a broader class that combines elliptical distributions with the generalised inverse Gaussian (GIG) distribution, providing theoretical results for TCE within this expanded class. The TCE provides a means to quantify the expected level of risk in unfavourable scenarios, where the risk factors surpass a predefined threshold value. Unlike VaR, the TCE takes into account both the minimum and expected losses incurred in the most extreme cases, offering a more precise evaluation of financial and insurance risks. The authors demonstrate that the TCE derived for the GHE family yields an excellent and more conservative and realistic estimation of risk in the extreme tail. This addresses a significant challenge faced by financial and insurance companies, which revolves around accurately quantifying the risks associated with extreme losses.
Despite the advancements made in risk quantification through the use of the TCE risk measure, there is still a need for further improvement in exploiting the information regarding risk at the extreme tails of the distribution. An additional measure, known as tail variance (TV), offers a more comprehensive and realistic evaluation of risks. The TV measure plays a significant role in providing valuable insights into the heavy-tailed behaviour of a distribution by quantifying the rate at which the variance of the distribution increases as we move towards the extreme tails. The significance of incorporating TV to assess tail riskiness for elliptical and symmetric GH distributions has been extensively discussed in Furman and Landsman (Reference Furman and Landsman2006) and Ignatieva and Landsman (Reference Ignatieva and Landsman2015), respectively. The rationale behind using TV stems from the observation made in Ignatieva and Landsman (Reference Ignatieva and Landsman2015) that the limit of TV for the quantile level q approaching one can be either zero (in the case of a Normal distribution), infinity (in the case of Student-t distribution), or a positive constant. Consequently, the asymptotic behaviour of TV naturally provides a categorisation of riskiness at the tails. Furthermore, integrating TCE and TV risk measures enables the derivation of an upper bound for the risk. This upper bound provides a high level of confidence that the risk will not exceed its threshold, further enhancing the paper’s contributions to risk assessment practices.
This paper presents an integrated framework that extends the GHE family of distributions by incorporating the TV as an additional risk measure. We derive a theoretical closed-form expression for TV within the GHE framework, addressing two key aspects: capturing the distributional characteristics of financial and insurance data and effectively accounting for extreme tail events. Additionally, TV confirms the confidence of using TCE as an estimator for extreme losses (Duan et al., Reference Duan, Landsman and Yao2024), supporting its effectiveness in risk aggregation. This makes it a valuable asset in portfolio risk management, as well as in financial and insurance applications. However, the TV for the GHE class of distributions remains unexplored in Duan et al. (Reference Duan, Landsman and Yao2024)’s analysis. In this paper, we address this gap by introducing a novel approach that provides a precise and tractable formula for calculating TV for the GHE distribution. In contrast to the prior work by Ignatieva and Landsman (Reference Ignatieva and Landsman2021), which focused on TCE as the primary measure of tail risk, this study enhances the framework by introducing the TV. TV captures the variability within the tail of the distribution, offering deeper insights into extreme tail behaviour that TCE alone cannot provide. The combination of TCE and TV offers a more comprehensive evaluation of risk, including the derivation of an upper bound, further strengthening its practical relevance. This contribution significantly broadens the theoretical scope and utility of the GHE framework, allowing for a more robust assessment of tail risk. The framework proposed in this paper enables a more accurate and holistic evaluation of risks, complementing traditional TCE-based assessments. It provides practitioners with a deeper understanding of tail risk, aiding in more informed decision-making in areas such as risk assessment, extreme value analysis, portfolio management and outlier detection. By leveraging the TV measure alongside the GHE distributions, we offer an innovative solution to overcome key challenges in risk quantification, ultimately enhancing risk management practices in financial and insurance sectors.
The rest of the paper is structured as follows. Section 2 presents a GHE family of distributions and its special cases, namely, the Laplace – GIG and the Student-t – GIG mixtures. Section 3 discusses the concept of the TV and presents innovative theoretical results for calculating the TV. The analysis is extended to include portfolio risk decomposition in Section 4, where we aggregate individual risks and derive key theoretical results for the multivariate portfolio. To demonstrate the practical application of our theoretical findings, we present an empirical analysis in Section 5. Section 6 concludes the paper and provides final remarks.
2. The generalised hyper-elliptical family
A recent work by Ignatieva and Landsman (Reference Ignatieva and Landsman2021) introduces the GHE distributions, which combine elliptical distributions with the GIG family. Specifically, a random vector
 $\mathbf{X}=(X_{1},...,X_{d})^{T}$
follows a multivariate elliptical mean variance mixture if it can be expressed as:
 \begin{equation}\mathbf{X}=\boldsymbol{\mu }+W\boldsymbol{\gamma }+\sqrt{W}A\mathbf{Z},\end{equation}
where
 $\boldsymbol{\mu}$
is the location vector,
 $\boldsymbol{\gamma}$
captures skewness (with
 $\boldsymbol{\gamma}=0$
indicating a symmetric distribution),
 $\mathbf{Z} \sim E_{k}(0,I_{k},g_k)$
follows an elliptical distribution, matrix
 $A \in \mathbb{R}^{d\times k}$
, and
 $W^{1/l} \sim GIG(\lambda, \chi, \psi)$
follows GIG distribution (see Klugman et al., Reference Klugman, Panjer and Willmot2019, p. 438). The distribution of
 $\mathbf{X}$
introduced in this framework is referred to as the GHE distribution. For any positive l, the exponent
 $1/l$
in the random variable W makes the chosen class of mixture distributions even more flexible than the GIG class. This is because we can utilise both the GIG distribution itself (when
 $ l = 1 $
) and its scaled versions (when
 $ l \neq 1 $
). This flexibility is particularly important as it allows to include additional members in the class of GHE distributions. As an example, we can consider the Laplace-GIG mixture (see Ignatieva and Landsman Reference Ignatieva and Landsman2021, Section 4.1), where
 $l = 2$
, that is,
 $W^{1/2} \sim \text{GIG}(\lambda, \chi, \psi)$
(see Eq. (4.7) in the cited paper). When
 $l=1$
and
 $\mathbf{Z}$
is
 $N_k(0,I_k)$
, the random vector
 $\mathbf{X}$
follows the skewed GH distribution as in McNeil et al. (Reference McNeil, Frey and Embrechts2015) and Ignatieva and Landsman (Reference Ignatieva and Landsman2019). This demonstrates the connection between the GHE and skewed GH distributions. The probability density function (pdf) of
 $W^{1/l}$
is
 \begin{equation}f_{W^{1/l}}(w)=c_{\lambda,\chi,\psi}w^{\lambda -1}\exp \left(-\frac{1}{2}\left(\chi w^{-1}+\psi w\right)\right),\end{equation}
where
 $w\unicode{x003E} 0$
,
 $\chi \geq 0$
,
 $\psi \geq 0$
,
 $\lambda \in \mathbb{R}$
and
 $c_{\lambda,\chi,\psi}$
given by:
 \begin{equation}c_{\lambda,\chi,\psi}=\frac{\chi\!^{-\lambda }(\sqrt{\chi \psi })^{\lambda }}{2K_{\lambda }(\sqrt{\chi \psi })},\end{equation}
with
 $K_{\lambda}(\cdot)$
being the modified Bessel function of the third kind. We notice that since
 $W^{1/l}\sim GIG(\lambda, \chi, \psi )$
, we can write the pdf of W as:
 \begin{equation}f_{l,\lambda, \chi, \psi }(w) =\,f_{W}(w)=f_{W^{1/l}}(w^{1/l})\frac{1}{l}w^{1/l-1}=c_{\lambda, \chi, \psi }\frac{1}{l}w^{\lambda /l-1}\exp\!\left(-\frac{1}{2}\left(\chi w^{-1/l}+\psi w^{1/l}\right)\right).\end{equation}
This framework provides a flexible and powerful model for capturing the characteristics of the GHE distributions, allowing for the analysis of multivariate risk scenarios. Ignatieva and Landsman (Reference Ignatieva and Landsman2021) offer a thorough analysis of this distribution class. The distribution of
 $\mathbf{X} \mid W = w$
is elliptical, denoted as
 $E_d(\boldsymbol{\mu} + w\boldsymbol{\gamma}, w\Sigma, g_d)$
, with pdf:
 \begin{equation}f_{\mathbf{X}}(\mathbf{x}|W=w)=\frac{c_{d}}{\sqrt{|\Sigma |} \sqrt{w}}g_{d}\left( \frac{1}{2w}(\mathbf{x}-\boldsymbol{\mu -}w\boldsymbol{\gamma })^{T}\Sigma ^{-1}(\mathbf{x}-\boldsymbol{\mu -}w\boldsymbol{\gamma })\right),\end{equation}
where
 $g_{d}\left( u\right)$
is the density generator,
 $u\geq 0$
;
 $\Sigma =AA^{T}\unicode{x003E} 0$
is a positive definite
 $d\times d$
scale matrixFootnote
1
, and a constant
 $c_{d}$
:
 \begin{eqnarray}c_{d}=\frac{\Gamma \left( d/2\right) }{\left( 2\pi \right) ^{d/2}}\left[\int_{0}^{\infty }x^{d/2-1}g_{d}(x)dx\right] ^{-1}.\end{eqnarray}
The pdf of
 $\mathbf{X}$
is then given by:
 \begin{equation}f_{\mathbf{X}}(\mathbf{x})=\frac{c_{d}}{\sqrt{|\Sigma |}}\int\limits_{0}^{\infty }\frac{1}{\sqrt{w}}g_{d}\left( \frac{1}{2w}(\mathbf{x}-\boldsymbol{\mu}-w\boldsymbol{\gamma })^{T}\Sigma ^{-1}(\mathbf{x}-\boldsymbol{\mu}-w\boldsymbol{\gamma })\right) f_{W}(w)dw.\end{equation}
Ignatieva and Landsman (Reference Ignatieva and Landsman2021) show that if
 $\mathbf{X} \sim GHE_{d}(\boldsymbol{\mu}, \Sigma, g_{d}, \boldsymbol{\gamma}, l, \lambda, \chi, \psi)$
and we define
 $\mathbf{Y} = B\mathbf{X} + \mathbf{b}$
, where matrix B has dimension
 $(m \times d)$
and column vector
 $\mathbf{b}$
is of length k, then
 $\mathbf{Y} \sim GHE_{m}(B\boldsymbol{\mu} + \mathbf{b}, B\Sigma B^{T}\!, g_{m}, B\boldsymbol{\gamma}, l, \lambda, \chi, \psi)$
. The univariate version follows similarly, where X is represented by:
 \begin{equation}X = \mu + W\gamma + \sqrt{W}\sigma Z,\end{equation}
with
 $Z \sim E_1(0,1,g)$
, and the univariate pdf is
 \begin{equation}f_{X}(x) = \frac{c}{\sigma}\int\limits_{0}^{\infty}\frac{1}{\sqrt{w}}g\left(\frac{1}{2w\sigma^2}(x-\mu-w\gamma)^2\right)f_{W}(w)dw.\end{equation}
Two specific examples of the GHE family are the Laplace – GIG mixture and the Student-t – GIG mixture. For the Laplace – GIG mixture, we examine a univariate Laplace random variable Z with mean zero and variance one, having the pdf:
 \[f_Z(z)=\frac{1}{\sqrt{2}}\exp\!(-\sqrt{2}|z|), \quad -\infty\unicode{x003C} z\unicode{x003C} \infty.\]
The cumulative distribution function (cdf) is given by:
 \[F_Z(z)=\begin{cases}1-\frac{1}{2}\exp\!(-\sqrt{2}z), & z \geq 0, \\\frac{1}{2}\exp\!(\sqrt{2}z), & z \unicode{x003C} 0.\end{cases}\]
The tail-type cumulative generator
 $\bar{G}(z)$
is
 \begin{equation}\bar{G}(z)=\frac{1}{\sqrt{2}}(\sqrt{z}+\frac{1}{2})\exp\!(-2\sqrt{z}).\end{equation}
The pdf of X is derived in Ignatieva and Landsman (Reference Ignatieva and Landsman2021) and is given by:
 \begin{eqnarray}\nonumber f_{X}(x)&=&\frac{1}{\sqrt{2}\sigma }\int_{0}^{\infty }\frac{1}{\sqrt{w}}\exp\left( -\frac{|x-\mu -w\gamma |\sqrt{2}}{\sqrt{w}\sigma }\right) f_{W}(w)dw.\\&=&\left\{\begin{array}{l}\frac{1}{\sqrt{2}\sigma }c_{\lambda, \chi, \psi }\left( \frac{F_{GIG}\left(\sqrt{Q_{1}},\chi ^{\prime}\!,\psi ^{\prime},\lambda ^{\prime }\right) }{c_{\lambda ^{\prime},\chi ^{\prime},\psi ^{\prime }}}+\frac{\bar{F}_{GIG}\left( \sqrt{Q_{1}},\chi ^{\prime \prime}\!,\psi ^{\prime \prime},\lambda ^{\prime \prime }\right) }{c_{\lambda ^{\prime \prime}\!,\chi^{\prime \prime}\!,\psi ^{\prime \prime }}}\right), x\unicode{x003E} \mu, \gamma \unicode{x003E} 0 \\\frac{1}{\sqrt{2}\sigma }\frac{c_{\lambda, \chi, \psi }}{c_{\lambda^{\prime}\!,\chi ^{\prime \prime}\!,\psi ^{\prime \prime }}}\bar{F}_{GIG}\left( 0,\chi ^{\prime \prime}\!,\psi ^{\prime \prime}\!,\lambda^{\prime \prime }\right), x\unicode{x003C} \mu, \gamma \unicode{x003E} 0 \\\frac{1}{\sqrt{2}\sigma }\frac{c_{\lambda, \chi, \psi }}{c_{\lambda^{\prime}\!,\chi ^{\prime}\!,\psi ^{\prime }}},\;x\unicode{x003E} \mu, \gamma \unicode{x003C} 0 \\\frac{1}{\sqrt{2}\sigma }c_{\lambda, \chi, \psi }\left( \frac{\bar{F}_{GIG}\left( \sqrt{Q_{1}},\chi ^{\prime}\!,\psi ^{\prime}\!,\lambda ^{\prime}\right) }{c_{\lambda ^{\prime}\!,\chi ^{\prime}\!,\psi ^{\prime }}}+\frac{F_{GIG}\left( \sqrt{Q_{1}},\chi ^{\prime \prime}\!,\psi ^{\prime \prime},\lambda ^{\prime }\right) }{c_{\lambda ^{\prime \prime}\!,\chi ^{\prime\prime}\!,\psi ^{\prime \prime }}}\right), x\unicode{x003C} \mu, \gamma \unicode{x003C} 0.\end{array}\right.\end{eqnarray}
For the Student-t – GIG mixture, we examine a univariate Student-t random variable Z with the pdf
 \[f_Z(z)=c_p\left(1+\frac{z^2}{\nu}\right)^{-p},\]
where the constant
 \begin{equation} c_p=\frac{1}{\sqrt{\nu}B \left(\frac{1}{2},p-\frac{1}{2}\right)}=\frac{\Gamma(p)}{\sqrt{\pi\nu}\Gamma(p-\frac{1}{2})},\end{equation}
and
 $p \unicode{x003E} 3/2$
. Then, it holds
 \[\bar{G}(z)=\frac{c_p\nu/2}{p-1}\left(1+\frac{2z}{\nu}\right)^{1-p}.\]
The pdf of X is derived in Ignatieva and Landsman (Reference Ignatieva and Landsman2021) and corresponds to
 \begin{eqnarray} f_{X}(x)&=&\frac{c_pc_{\lambda,\chi,\psi}}{\sigma}\int_0^{\infty}\left(1+\frac{1}{\nu}\left(\frac{x-\mu-\gamma w}{\sigma \sqrt{w}}\right)^2\right)^{-p}w^{\lambda-3/2}\exp\left(-\frac{1}{2}\left(\frac{\chi}{w}+\psi w\right)\right)dw. \notag \\\end{eqnarray}
3. Tail variance
In this section, we explore new theoretical insights into the TV of the GHE family. TV is a risk measure that captures the variability within the tail of a distribution, providing insights into the magnitude and uncertainty of extreme events. Unlike TCE, which focuses on expected losses, TV emphasises the dispersion of losses in the extreme tail. It can be defined as:
 \begin{eqnarray}TV_q[X] = \mathrm{Var}[X \mid X \unicode{x003E} x_q], \quad \text{where} \quad \mathbb{P}(X \leq x_q) = q,\end{eqnarray}
which was first introduced in Furman and Landsman (Reference Furman and Landsman2006) (Eq. (1.3)) and is consistent with the definition provided in Kim and Kim (Reference Kim and Kim2019) (Eq. (55)). TV is particularly useful for assessing risk in heavy-tailed distributions, as it reflects not only the expected level of tail risk but also its potential variability. Moreover, TV enhances the reliability of using TCE as an estimator of extreme losses (see Duan et al., Reference Duan, Landsman and Yao2024) ensuring that it performs well in risk aggregation, making it a valuable tool in portfolio risk management as well as financial and insurance applications.Footnote
2
For the sake of completeness, we briefly summarise the main result here. We denote
 $x_q$
to be the solution of
 \begin{equation}\bar{F}_{GHE,1}(x_q,\mu,\sigma^2,g,\gamma,l,\lambda,\chi,\psi)=1-q,\end{equation}
with
 $\bar{F}_{GHE,1}(\cdot)=1-F_{GHE,1}(\cdot)$
, where
 $F_{GHE,1}(x,\mu,\sigma^2,g,\gamma,l,\lambda,\chi,\psi)$
is a cdf of a GHE random variable X. Alternatively, we can write
 \begin{equation*}x_{q}=VaR_q(X;\ \mu, \sigma ^{2},g,\gamma, l,\lambda, \chi, \psi )\end{equation*}
with
 $VaR_q(\cdot)$
denoting VaR at level q. Assuming the existence of the variance within the elliptical family, that is,
 \begin{equation}Var(Z)=\sigma _{Z}^{2}\unicode{x003C} \infty,\end{equation}
Ignatieva and Landsman (Reference Ignatieva and Landsman2021) show in Theorem 3.1 that the TCE can be computed as follows:
 \begin{eqnarray}\nonumber TCE_{q}(X)&=&\mu +\frac{\gamma }{1-q}k_{\lambda, \tilde{\lambda}}\bar{F}_{GHE,1}(x_{q};\ \mu, \sigma ^{2},g,\gamma, l,\tilde{\lambda},\chi, \psi )\\&&+ \, \frac{\sigma ^{2}}{1-q}k_{\lambda, \tilde{\lambda}}\sigma_Z^2 f_{GHE,1}(x_q;\ \mu, \sigma ^{2},G,\gamma, l,\tilde{\lambda},\chi, \psi ),\end{eqnarray}
where a constant
 $k_{\lambda, \tilde{\lambda}_j}$
is given by:
 \begin{equation}k_{\lambda, \tilde{\lambda}_j}=\left( \sqrt{\frac{\chi }{\psi }}\right) ^{\tilde{\lambda}_j-\lambda}\frac{K_{\tilde{\lambda}_j}(\sqrt{\chi \psi })}{K_{\lambda}(\sqrt{\chi \psi })}.\end{equation}
Consider
 $\tilde{\lambda}_j=\lambda+\frac{jl}{2}$
, where
 $j=1,2,3,4$
. Let
 $F_{GHE,1}(x_{q},\mu, \sigma ^{2},g,\gamma, l,\tilde{\lambda}_j,\chi, \psi)$
denote the cdf of a GHE-distributed random variable
 $X_j$
with the parameter
 $\tilde{\lambda}_j$
,
 $f_{GHE,1}(x,\mu, \sigma ^{2},G,\gamma, l,\tilde{\lambda}_j,\chi, \psi )$
denote the pdf of the GHE random variable
 $X^{\ast }_j$
associated with
 $X_j$
and
 $\bar{F}_{GHE,1}(x_{q};\ \mu, \sigma ^{2},G,\gamma, l,\tilde{\lambda}_2,\chi, \psi )$
denote the cdf of a GHE-distributed random variable
 $X^{\ast }_2$
. We note that
 $\tilde{\lambda}=\tilde{\lambda}_2$
in Eq. (3.4) and, thus,
 $k_{\lambda, \tilde{\lambda}}=k_{\lambda, \tilde{\lambda}_2}$
. This brings us to the following theorem.
Theorem 3.1. Suppose that the condition in Equation (3.3) is satisfied. Then
 \begin{eqnarray}\nonumber TV_{q}(X)&=&\frac{\sigma^2\sigma_{Z}^2}{1-q}k_{\lambda, \tilde{\lambda}_2}\bar{F}_{GHE,1}(x_{q};\ \mu, \sigma ^{2},G,\gamma, l,\tilde{\lambda}_2,\chi, \psi )\!\left(\!1+(x_q-\mu)\frac{f_{GHE,1}(x_{q};\ \mu, \sigma ^{2},G,\gamma, l,\tilde{\lambda}_2,\chi, \psi )}{\bar{F}_{GHE,1}(x_{q};\ \mu, \sigma ^{2},G,\gamma, l,\tilde{\lambda}_2,\chi, \psi )}\!\right)\notag\\&+&\frac{k_{\lambda, \tilde{\lambda}_4}}{1-q}\bar{F}_{GHE,1}(x_{q};\ \mu, \sigma ^{2},g,\gamma, l,\tilde{\lambda}_2,\chi, \psi)\gamma\!\left(\gamma+\sigma^2\frac{f_{GHE,1}(x_{q};\ \mu, \sigma ^{2},G,\gamma, l,\tilde{\lambda}_4,\chi, \psi )}{\bar{F}_{GHE,1}(x_{q};\ \mu, \sigma ^{2},g,\gamma, l,\tilde{\lambda}_4,\chi, \psi )}\right)\notag\\&-&\frac{k_{\lambda, \tilde{\lambda}_2}^2}{(1-q)^2}\bar{F}_{GHE,1}(x_{q};\ \mu, \sigma ^{2},g,\gamma, l,\tilde{\lambda}_2,\chi, \psi)^2\!\left(\gamma+\sigma^2\sigma_Z^2\frac{f_{GHE,1}(x_{q};\ \mu, \sigma ^{2},G,\gamma, l,\tilde{\lambda}_2,\chi, \psi )}{\bar{F}_{GHE,1}(x_{q};\ \mu, \sigma ^{2},g,\gamma, l,\tilde{\lambda}_2,\chi, \psi )}\right)^2.\nonumber\\\end{eqnarray}
Proof. Refer to Appendix A.2.
We note that the obtained result of Theorem 3.1 not only conforms with but also extends the findings of Kim and Kim (Reference Kim and Kim2019) who derive TV for the normal mean-variance mixture distributions.
4. Tail risk decomposition
In this section, we focus on a multivariate portfolio scenario, assuming that an insurance company operates across multiple lines of business or an investor manages a diverse investment portfolio with multiple constituents. By considering the multivariate nature of the scenario, we gain a more comprehensive understanding of the joint behaviour and risk profile associated with such multivariate portfolio.
We examine a multivariate GHE vector
 $\mathbf{X} = (X_1, \dots, X_d)^T$
, where each
 $X_i$
, for
 $i = 1, \dots, d$
, can be interpreted as an insurance loss or the return on a financial asset. We are interested in the contribution of the variability of each constituent,
 $X_i$
to the TV of the sum of individual components in the multivariate portfolio,
 $S=\sum_{i=1}^{d}X_{i}$
. We observe that, given a multivariate vector
 $\mathbf{X}\sim GHE_{d}(\boldsymbol{\mu },\Sigma, g_{d},\boldsymbol{\gamma },l,\lambda, \chi, \psi )$
, where
 $\mu _{i}$
s are the univariate means of constituents
 $X_{1},...,X_{d}$
,
 $\sigma _{ij}$
are the elements of the variance–covariance matrix
 $\Sigma $
and
 $\gamma _{i}$
s are the components of the vector
 $\boldsymbol{\gamma }$
, the sum S has a univariate GHE distribution:
 $S\sim GHE_{1}(\mu _{S},\sigma _{S}^{2},g,\gamma_{S},l,\lambda, \chi, \psi )$
, where
 $\mu _{S}=\sum_{i=1}^{d}\mu _{i},\sigma_{S}^{2}=\sum_{i=1}^{d}\sum_{j=1}^{d}\sigma _{ij},\gamma_{S}=\sum_{i=1}^{d}\gamma _{i}.$
We recall from Theorem 2 in Ignatieva and Landsman (Reference Ignatieva and Landsman2021) that the conditional expectation
 $E(X_{i}|S\unicode{x003E} s_{q})$
can be written as:
 \begin{eqnarray}K_{i} &=&E(X_{i}|S\unicode{x003E} s_{q})=\mu _{i}+\frac{\gamma _{i}}{1-q}k_{\lambda, \tilde{\lambda}}\bar{F}_{GHE,1}(s_{q},\mu _{S},\sigma _{S}^{2},g,\gamma _{S},l,\tilde{\lambda},\chi, \psi ) \\&&+ \, \frac{\sigma _{iS}}{1-q}\sigma _{Z}^{2}k_{\lambda, \tilde{\lambda}}f_{GHE,1}(s_{q},\mu _{S},\sigma _{S}^{2},G,\gamma _{S},l,\tilde{\lambda},\chi, \psi ),i=1,...,d.\nonumber\end{eqnarray}
Here, each
 $K_i$
represents TCE-based allocations of the
 $i{\rm th}$
constituent in the multivariate portfolio, that is, summing
 $K_{i}$
with
 $i=1,...,d$
we naturally obtain TCE of the sum, that is,
 $\sum_{i=1}^{d}K_{i}=TCE_{q}(S)$
.
The TV of each constituent variable
 $X_i$
within the multivariate portfolio represents the individual contribution of its variability to the overall variance in the extreme tail region. By quantifying the impact of each component’s variability, we gain insights into the relative importance of different constituents in shaping the tail risk of the portfolio. This would allow us to assess the significance of each variable’s contribution to the overall risk profile and make informed decisions regarding risk management and portfolio optimisation. We can write
 \begin{eqnarray}\nonumber TV_{q}(X_i|S)&=&Var(X_i|S\unicode{x003E} s_{q})=E\left((X_{i}-TCE_q(X_i|S))^2|S\unicode{x003E} s_q\right)\\&=&E\left(X_{i}^2|S\unicode{x003E} s_q\right)-TCE_q(X_i|S)^2\end{eqnarray}
where
 $s_{q}$
denotes the
 $q-$
level quantile of S and
 $TCE_q(X_i|S)=E(X_i|S\unicode{x003E} s_q)$
. For simplicity of exploration, we concentrate on the two-dimensional scenario of our model. We assume that a bivariate vector
 $\mathbf{Y=(}Y_{1},Y_{2})^{T}\sim GHE_{2}(\boldsymbol{\mu },\Sigma, g_{2},\boldsymbol{\gamma },l,\lambda, \chi, \psi )$
where
 $\Sigma$
is a bivariate variance–covariance matrix:
 \[\Sigma = \left(\begin{array}{cc}\sigma _{11} & \sigma _{12} \\\sigma _{12} & \sigma _{22}\end{array}\right).\]
We note that
 $E(X_{i}|S\unicode{x003E} s_{q})$
has been derived in Ignatieva and Landsman (Reference Ignatieva and Landsman2021). Here, we first derive the quantity
 $E(Y_{1}^2|Y_{2} \unicode{x003E} y_{2,q})$
and then set
 $Y_{1}=X_{i}$
and
 $Y_{2}=S$
.
Lemma 4.1.
Tail variance of
 $Y_1$
given
 $Y_2 \unicode{x003E} y_{2,q}$
has the following analytical representation
 \begin{align}\nonumber TV(Y_{1}|Y_{2})=Var(Y_{1}|Y_{2} \unicode{x003E} \ &y_{2,q})=\gamma _{1}^{2}k_{\lambda, \tilde{\lambda}_{4}}\frac{1}{1-q}\bar{F}_{GHE,1}(y_{2,q};\ \mu _{2},\sigma _{2}^{2},g,\gamma _{2},l,\tilde{\lambda}_{4},\chi, \psi ) \\\nonumber&+2\gamma _{1}\sigma _{1}\sigma _{2}\rho _{12}\sigma _{Z}^{2}k_{\lambda, \tilde{\lambda}_{5}}\frac{1}{1-q}f_{GHE,1}(y_{2,q},\mu _{2},\sigma_{2}^{2},G,\gamma _{2},l,\tilde{\lambda}_{5},\chi, \psi ) \\\nonumber&+\sigma _{1}^{2}\sigma _{Z}^{2}k_{\lambda, \tilde{\lambda}_{2}}\frac{1}{1-q}\bar{F}_{GHE,1}(y_{2,q};\ \mu _{2},\sigma _{2}^{2},G,\gamma _{2},l,\tilde{\lambda}_{2},\chi, \psi ) \\\nonumber&+\sigma _{1}^{2}\sigma _{2}\sigma _{Z}^{2}\rho _{12}^{2}\frac{(y_{2,q}-\mu_{2})}{\sigma _{2}}k_{\lambda, \tilde{\lambda}_{2}}\frac{1}{1-q}f_{GHE,1}(y_{2,q};\ \mu _{2},\sigma _{2}^{2},G,\gamma _{2},l,\tilde{\lambda}_{2},\chi, \psi ) \\\nonumber&-\sigma _{1}^{2}\sigma _{Z}^{2}\rho _{12}^{2}\gamma _{2}k_{\lambda, \tilde{\lambda}_{4}}f_{GHE,1}(y_{2,q};\ \mu _{2},\sigma _{2}^{2},G,\gamma_2, l,\tilde{\lambda}_{4},\chi, \psi ) \\\nonumber&-\gamma _{1}^{2}k_{\lambda, \tilde{\lambda}_{2}}^{2}\frac{1}{(1-q)^{2}}\bar{F}_{GHE,1}(y_{2,q},\mu _{2},\sigma _{2}^{2},g,\gamma _{2},l,\tilde{\lambda}_{2},\chi, \psi )^{2} \\\nonumber&-\sigma _{12}^{2}\sigma _{Z}^{4}k_{\lambda, \tilde{\lambda}_{2}}^{2}\frac{1}{(1-q)^{2}}f_{GHE,1}(y_{2,q},\mu _{2},\sigma _{2}^{2},G,\gamma _{2},l,\tilde{\lambda}_{2},\chi, \psi )^{2} \\\nonumber&-2\gamma _{1}k_{\lambda, \tilde{\lambda}_{2}}\frac{1}{1-q}\bar{F}_{GHE,1}(y_{2,q},\mu _{2},\sigma _{2}^{2},g,\gamma _{2},l,\tilde{\lambda}_{2},\chi, \psi ) \\&\times \sigma _{12}\sigma _{Z}^{2}k_{\lambda, \tilde{\lambda}_{2}}\frac{1}{1-q}f_{GHE,1}(y_{2,q},\mu _{2},\sigma _{2}^{2},G,\gamma _{2},l,\tilde{\lambda}_{2},\chi, \psi ),\end{align}
where
 $y_{2,q}$
 $=$
 $VaR_{q}(Y_{2}),$
 $\sigma _{i}^{2}=\sigma _{ii},i=1,2.$
Proof. Refer to Appendix A.3.
Corollary 4.1.
For a special case of symmetry when
 $\gamma _{1},\gamma _{2}=0$
we obtain:
 \begin{align*}E(Y_{1}^{2}|Y_{2} \unicode{x003E} \ &y_{2,q})=\mu _{1}^{2}+ \\&+\sigma _{1}^{2}\sigma _{Z}^{2}k_{\lambda, \tilde{\lambda}_{2}}\frac{1}{1-q}\bar{F}_{GHE,1}(y_{2,q};\ \mu _{2},\sigma _{2}^{2},G,\gamma _{2}=0,l,\tilde{\lambda}_{2},\chi, \psi ) \\&+2\mu _{1}\sigma _{1}\rho _{12}\sigma _{Z}^{2}k_{\lambda, \tilde{\lambda}_{1}}\frac{1}{1-q}f_{GHE,1}(y_{2,q},\mu _{2},\sigma _{2}^{2},G,\gamma_{2}=0,l,\tilde{\lambda}_{1},\chi, \psi ) \\&+\sigma _{1}^{2}\sigma _{Z}^{2}\rho _{12}^{2}\frac{(y_{2,q}-\mu _{2})}{\sigma _{2}}k_{\lambda, \tilde{\lambda}_{1}}\frac{1}{1-q}f_{GHE,1}(y_{2,q};\ \mu _{2},\sigma _{2}^{2},G,\gamma _{2}=0,l,\tilde{\lambda}_{1},\chi, \psi ),\hspace{+0.3cm}\mbox{and}\end{align*}
 \begin{align*}E((Y_{1}-TCE(Y_{1}|Y_{2}))^{2}|Y_{2} &\unicode{x003E} y_{2,q}) \\=&\ \sigma _{1}^{2}\sigma _{Z}^{2}k_{\lambda, \tilde{\lambda}_{2}}\frac{1}{1-q}\bar{F}_{GHE,1}(y_{2,q};\ \mu _{2},\sigma _{2}^{2},G,0,l,\tilde{\lambda}_{2},\chi, \psi ) \\&+\sigma _{1}^{2}\sigma _{2}\sigma _{Z}^{2}\rho _{12}^{2}\frac{(y_{2,q}-\mu_{2})}{\sigma _{2}}k_{\lambda, \tilde{\lambda}_{2}}\frac{1}{1-q}f_{GHE,1}(y_{2,q};\ \mu _{2},\sigma _{2}^{2},G,0,l,\tilde{\lambda}_{2},\chi,\psi ) \\=&\;Var(Y_{1})k_{\lambda, \tilde{\lambda}_{2}}[\frac{1}{1-q}\bar{F}_{GHE,1}(y_{2,q};\ \mu _{2},\sigma _{2}^{2},G,0,l,\tilde{\lambda}_{2},\chi,\psi ) \\&+\sigma _{2}\rho _{12}^{2}\frac{(y_{2,q}-\mu _{2})}{\sigma _{2}}\frac{1}{1-q}f_{GHE,1}(y_{2,q};\ \mu _{2},\sigma _{2}^{2},G,0,l,\tilde{\lambda}_{2},\chi, \psi )].\end{align*}
This result corroborates with Lemma 2 from Furman and Landsman (Reference Furman and Landsman2006), essentially providing a generalisation of its findings. By replacing
 $Y_{1}$
with
 $X_{i}$
and
 $Y_{2}$
with S in Lemma 4.1, we can formulate the following theorem.
Summary statistics for Apple, Microsoft, Amazon and Nvidia stock returns.

Theorem 4.1. For
 $ \mathrm{1} \leq i\leq n$
, tail variance of
 $X_{i}$
given
 $S\unicode{x003E} s_{q\text{ }}$
has the following analytical representation: For
 $\mathrm{1} \leq i\leq n$
, tail variance of
 $\mathrm{X}_{\mathrm{i}}$
given
 $ \mathrm{S}\unicode{x003E} \mathrm{s}_{\mathrm{q}\text{ }}$
has the following analytical representation:
 \begin{align*}TV(X_{i}|S) \,=&\,Var(X_{i}|S\unicode{x003E} s_{q})=\gamma _{i}^{2}k_{\lambda, \tilde{\lambda}_{4}}\frac{1}{1-q}\bar{F}_{GHE,1}(s_{q};\ \mu _{S},\sigma _{S}^{2},g,\gamma_{S},l,\tilde{\lambda}_{4},\chi, \psi ) \\&+2\gamma _{i}\sigma _{i}\sigma _{s}\rho _{iS}\sigma _{Z}^{2}k_{\lambda, \tilde{\lambda}_{5}}\frac{1}{1-q}f_{GHE,1}(s_{q},\mu _{S},\sigma_{S}^{2},G,\gamma _{S},l,\tilde{\lambda}_{5},\chi, \psi ) \\&+\sigma _{i}^{2}\sigma _{Z}^{2}k_{\lambda, \tilde{\lambda}_{2}}\frac{1}{1-q}\bar{F}_{GHE,1}(s_{q};\ \mu _{S},\sigma _{S}^{2},G,\gamma _{S},l,\tilde{\lambda}_{2},\chi, \psi ) \\&+\sigma _{i}^{2}\sigma _{S}\sigma _{Z}^{2}\rho _{iS}^{2}\frac{(s_{q}-\mu_{S})}{\sigma _{2}}k_{\lambda, \tilde{\lambda}_{2}}\frac{1}{1-q}f_{GHE,1}(s_{q};\ \mu _{S},\sigma _{S}^{2},G,\gamma _{S},l,\tilde{\lambda}_{2},\chi, \psi ) \\&-\sigma _{i}^{2}\sigma _{Z}^{2}\rho _{iS}^{2}\gamma _{2}k_{\lambda, \tilde{\lambda}_{4}}f_{GHE,1}(s_{q};\ \mu _{S},\sigma _{S}^{2},G,\gamma _{S},l,\tilde{\lambda}_{4},\chi, \psi ) \\&-\gamma _{i}^{2}k_{\lambda, \tilde{\lambda}_{2}}^{2}\frac{1}{(1-q)^{2}}\bar{F}_{GHE,1}(s_{q},\mu _{S},\sigma _{S}^{2},g,\gamma _{S},l,\tilde{\lambda}_{2},\chi, \psi )^{2} \\&-\sigma _{iS}^{2}\sigma _{Z}^{4}k_{\lambda, \tilde{\lambda}_{2}}^{2}\frac{1}{(1-q)^{2}}f_{GHE,1}(s_{q},\mu _{S},\sigma _{S}^{2},G,\gamma _{S},l,\tilde{\lambda}_{2},\chi, \psi )^{2} \\&-2\gamma _{i}k_{\lambda, \tilde{\lambda}_{2}}\frac{1}{1-q}\bar{F}_{GHE,1}(s_{q},\mu _{S},\sigma _{S}^{2},g,\gamma _{S},l,\tilde{\lambda}_{2},\chi, \psi ) \\&\times \sigma _{iS}\sigma _{Z}^{2}k_{\lambda, \tilde{\lambda}_{2}}\frac{1}{1-q}f_{GHE,1}(s_{q},\mu _{S},\sigma _{S}^{2},G,\gamma _{S},l,\tilde{\lambda}_{2},\chi, \psi ),\end{align*}
where notice that
 $\tilde{\lambda}=\tilde{\lambda}_{2}$
. This result essentially generalises the Theorem 2 of Furman and Landsman (Reference Furman and Landsman2006).
We note that quantity
 $TV(X_{i}|S)$
allows us to present distribution-free (in some sense) inequality for any component
 $X_{i}, i=1,...,d$
of the aggregated sum
 $S$
, when it exceeds
 $q-$
level
 $s_{q}=VaR_{q}(S)$
. The following proposition can be formulated:
Proposition 4.1.
(One-tailed Cantelli’s inequality) For any
 $k\unicode{x003E} 0$
, the following inequality holds:
 \begin{equation}\Pr \left\{ X_{i}\unicode{x003E} TCE(X_{i}|S)+k\sqrt{TV(X_{i}|S)}\;|S\unicode{x003E} s_{q}\right\} \leq\frac{1}{1+k^{2}},\hspace{+0.2cm}i=1,...,d. \end{equation}
Proof. Equation (4.4) follows directly from the classical Cantelli’s Inequality (refer to Boucheron et al. Reference Boucheron, Lugosi and Massart2013):
 \begin{equation*}\Pr \left\{ X\unicode{x003E} E(X)+\lambda \right\} \leq \frac{Var(X)}{Var(X)+\lambda ^{2}},\;\lambda \unicode{x003E} 0\end{equation*}
Estimated parameters from the univariate fit of the GHE family of distributions for Apple, Microsoft, Amazon and Nvidia stocks.

Histogram representing the empirical distribution (black) versus GHE Laplace – GIG pdf (blue) and GHE Student-t – GIG pdf (red) fitted to Apple, Microsoft, Amazon and Nvidia stock returns.

A comparison of univariate TVs and TCEs for Apple, Microsoft, Amazon and Nvidia stock returns, calculated using GHE distributions (Laplace – GIG and Student-t – GIG) across various quantile levels.

TV- and TCE-based allocations (
 $TV_q(X_i|S\unicode{x003E} s_q)$
and
 $K_i$
, respectively) computed for GHE Laplace – GIG and GHE Student-t – GIG distributions for Apple, Microsoft, Amazon and Nvidia stock returns.

Substituting
 $k=3$
into Equation (4.4), we obtain the following 90% upper bound for
 $X_{i}$
 \begin{equation*}\Pr \left\{ X_{i}\unicode{x003C} TCE(X_{i}|S)+3\sqrt{TV(X_{i}|S)}\;|\;S\unicode{x003E} s_{q}\right\}\geq 0.9,\hspace{+0.2cm} i=1,...,d.\end{equation*}
This upper bound offers a reliable upper threshold for risk estimation associated with extreme losses such that the risk will not exceed this threshold with probability 90%, as illustrated in Section 5.
5. Empirical results
This section shows how the proposed methodology can be effectively applied to quantify the risk of a portfolio. We focus on analysing the data of individual stocks that are constituents of the S&P 500 index, specifically considering four prominent stocks: Apple, Microsoft, Amazon and Nvidia. Our analysis covers a significant time frame of 15 years, starting from July 1, 2007, and ending on June 30, 2022. Throughout this period, we collected a total of 3777 return observations. Table 1 provides summary statistics of the data highlighting key measures such as mean, standard deviation, skewness and kurtosis, indicating notable skewness and high kurtosis in all data reflecting asymmetric and heavy-tailed distributions.
In the subsequent discussion, we delve into the univariate case, where we examine the suitability of the univariate GHE Laplace – GIG and GHE Student-t – GIG distributions for modelling individual stock returns. Additionally, we calculate the univariate tail values (TVs) associated with these distributions. This analysis is covered in Section 4.1.
Moving forward to Section 4.2, we shift our focus to the multivariate aspect, where we explore the fit of the GHE family to the four-dimensional portfolio return data. We also compute the TV for the combined portfolio returns and individual stock losses. To provide a meaningful comparison, we will also report the TCE.
Parameter estimates from the multivariate fit of GHE (Laplace – GIG and Student-t – GIG) and GH distributions to the Apple, Microsoft, Amazon and Nvidia stock returns. Parameters are computed using maximum likelihood estimation.

5.1 Univariate case
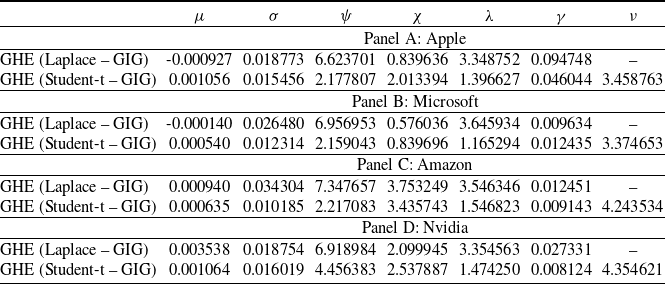
Table 2 presents the estimated parameters for the stocks of Apple, Microsoft, Amazon and Nvidia, displayed horizontally in Panels A through D, respectively.Footnote
3
We note that the skewness parameter
 $\gamma$
is positive, although it is close to zero. This suggests that the stock returns exhibit a near symmetry. Moving on to the number of degrees of freedom
 $\nu$
for the Student-t – GIG distribution, we observe a range from 3.37 to 4.35, which is common for equities.Footnote
4
The dispersion parameter
 $\sigma$
is relatively larger for the Laplace – GIG mixture, which indicates that the distribution is more spread out around the mean when compared to the Student-t – GIG distribution. The parameter
 $\psi$
is significantly larger for the Laplace – GIG distribution compared to the Student-t – GIG. This difference in
 $\psi$
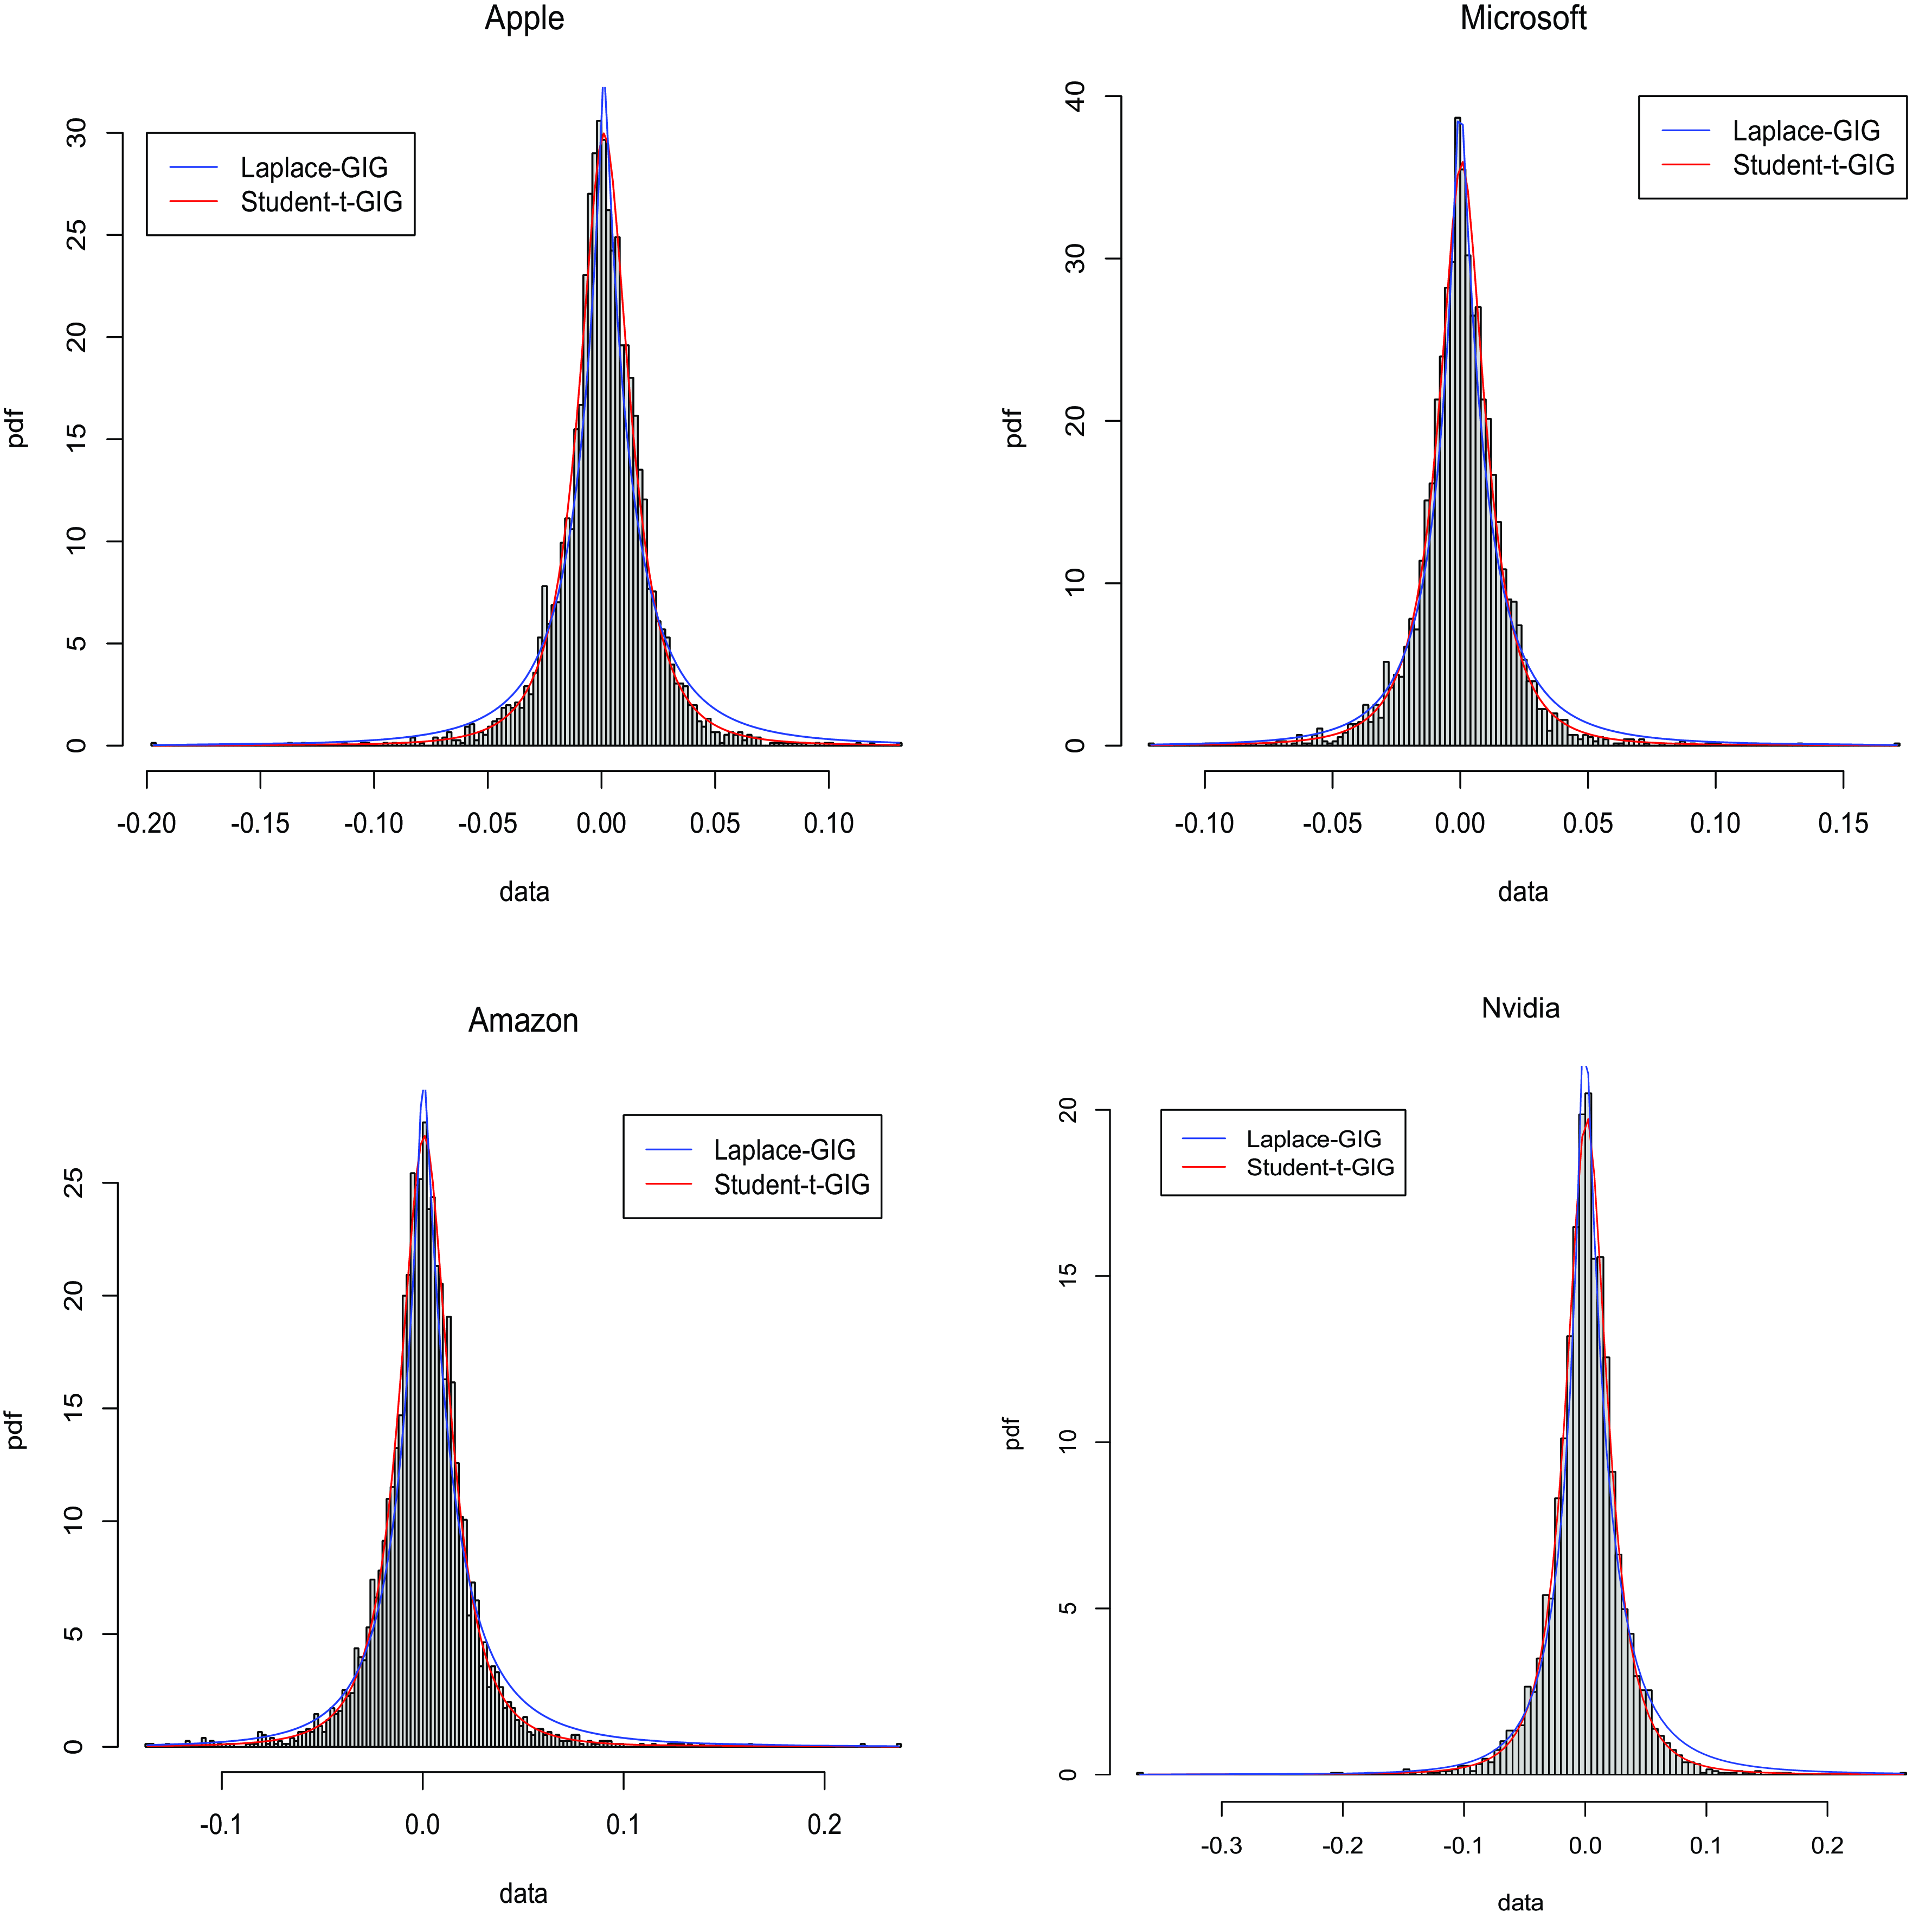
leads to a higher kurtosis in case of the Laplace – GIG distribution. This can also be observed in Figure 1 that shows a histogram showcasing the distribution of returns (depicted in black) for Apple, Microsoft, Amazon and Nvidia stocks, while the fitted probability density functions (pdfs) of the GHE Laplace – GIG pdf (shown in blue) and GHE Student-t – GIG pdf (displayed in red) are overlaid on top. Upon examination, it becomes evident that both distributions fit the individual losses quite well with the Student-t – GIG only marginally outperforming Laplace – GIG, which is consistent with the result reported in Ignatieva and Landsman (Reference Ignatieva and Landsman2021). The Laplace – GIG distribution generates fatter tails and exhibits excess kurtosis when compared to the Student-t – GIG distribution, implying that the Laplace – GIG distribution portrays a more pronounced tail behaviour. It is worth noting that despite these differences, both distributions capture the characteristics of the returns reasonably well, demonstrating their efficacy in modelling the data, including the heavy tails.
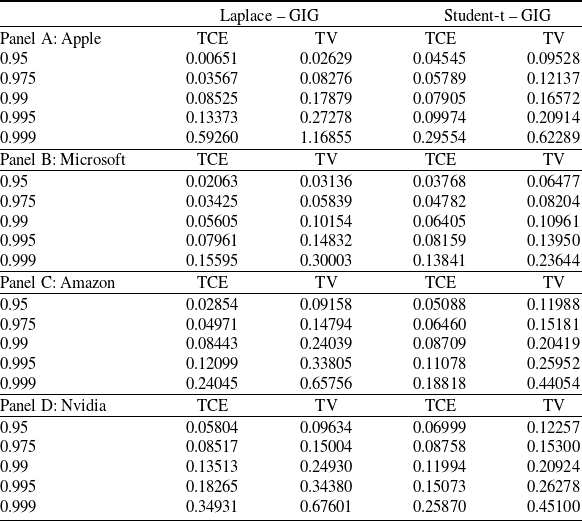
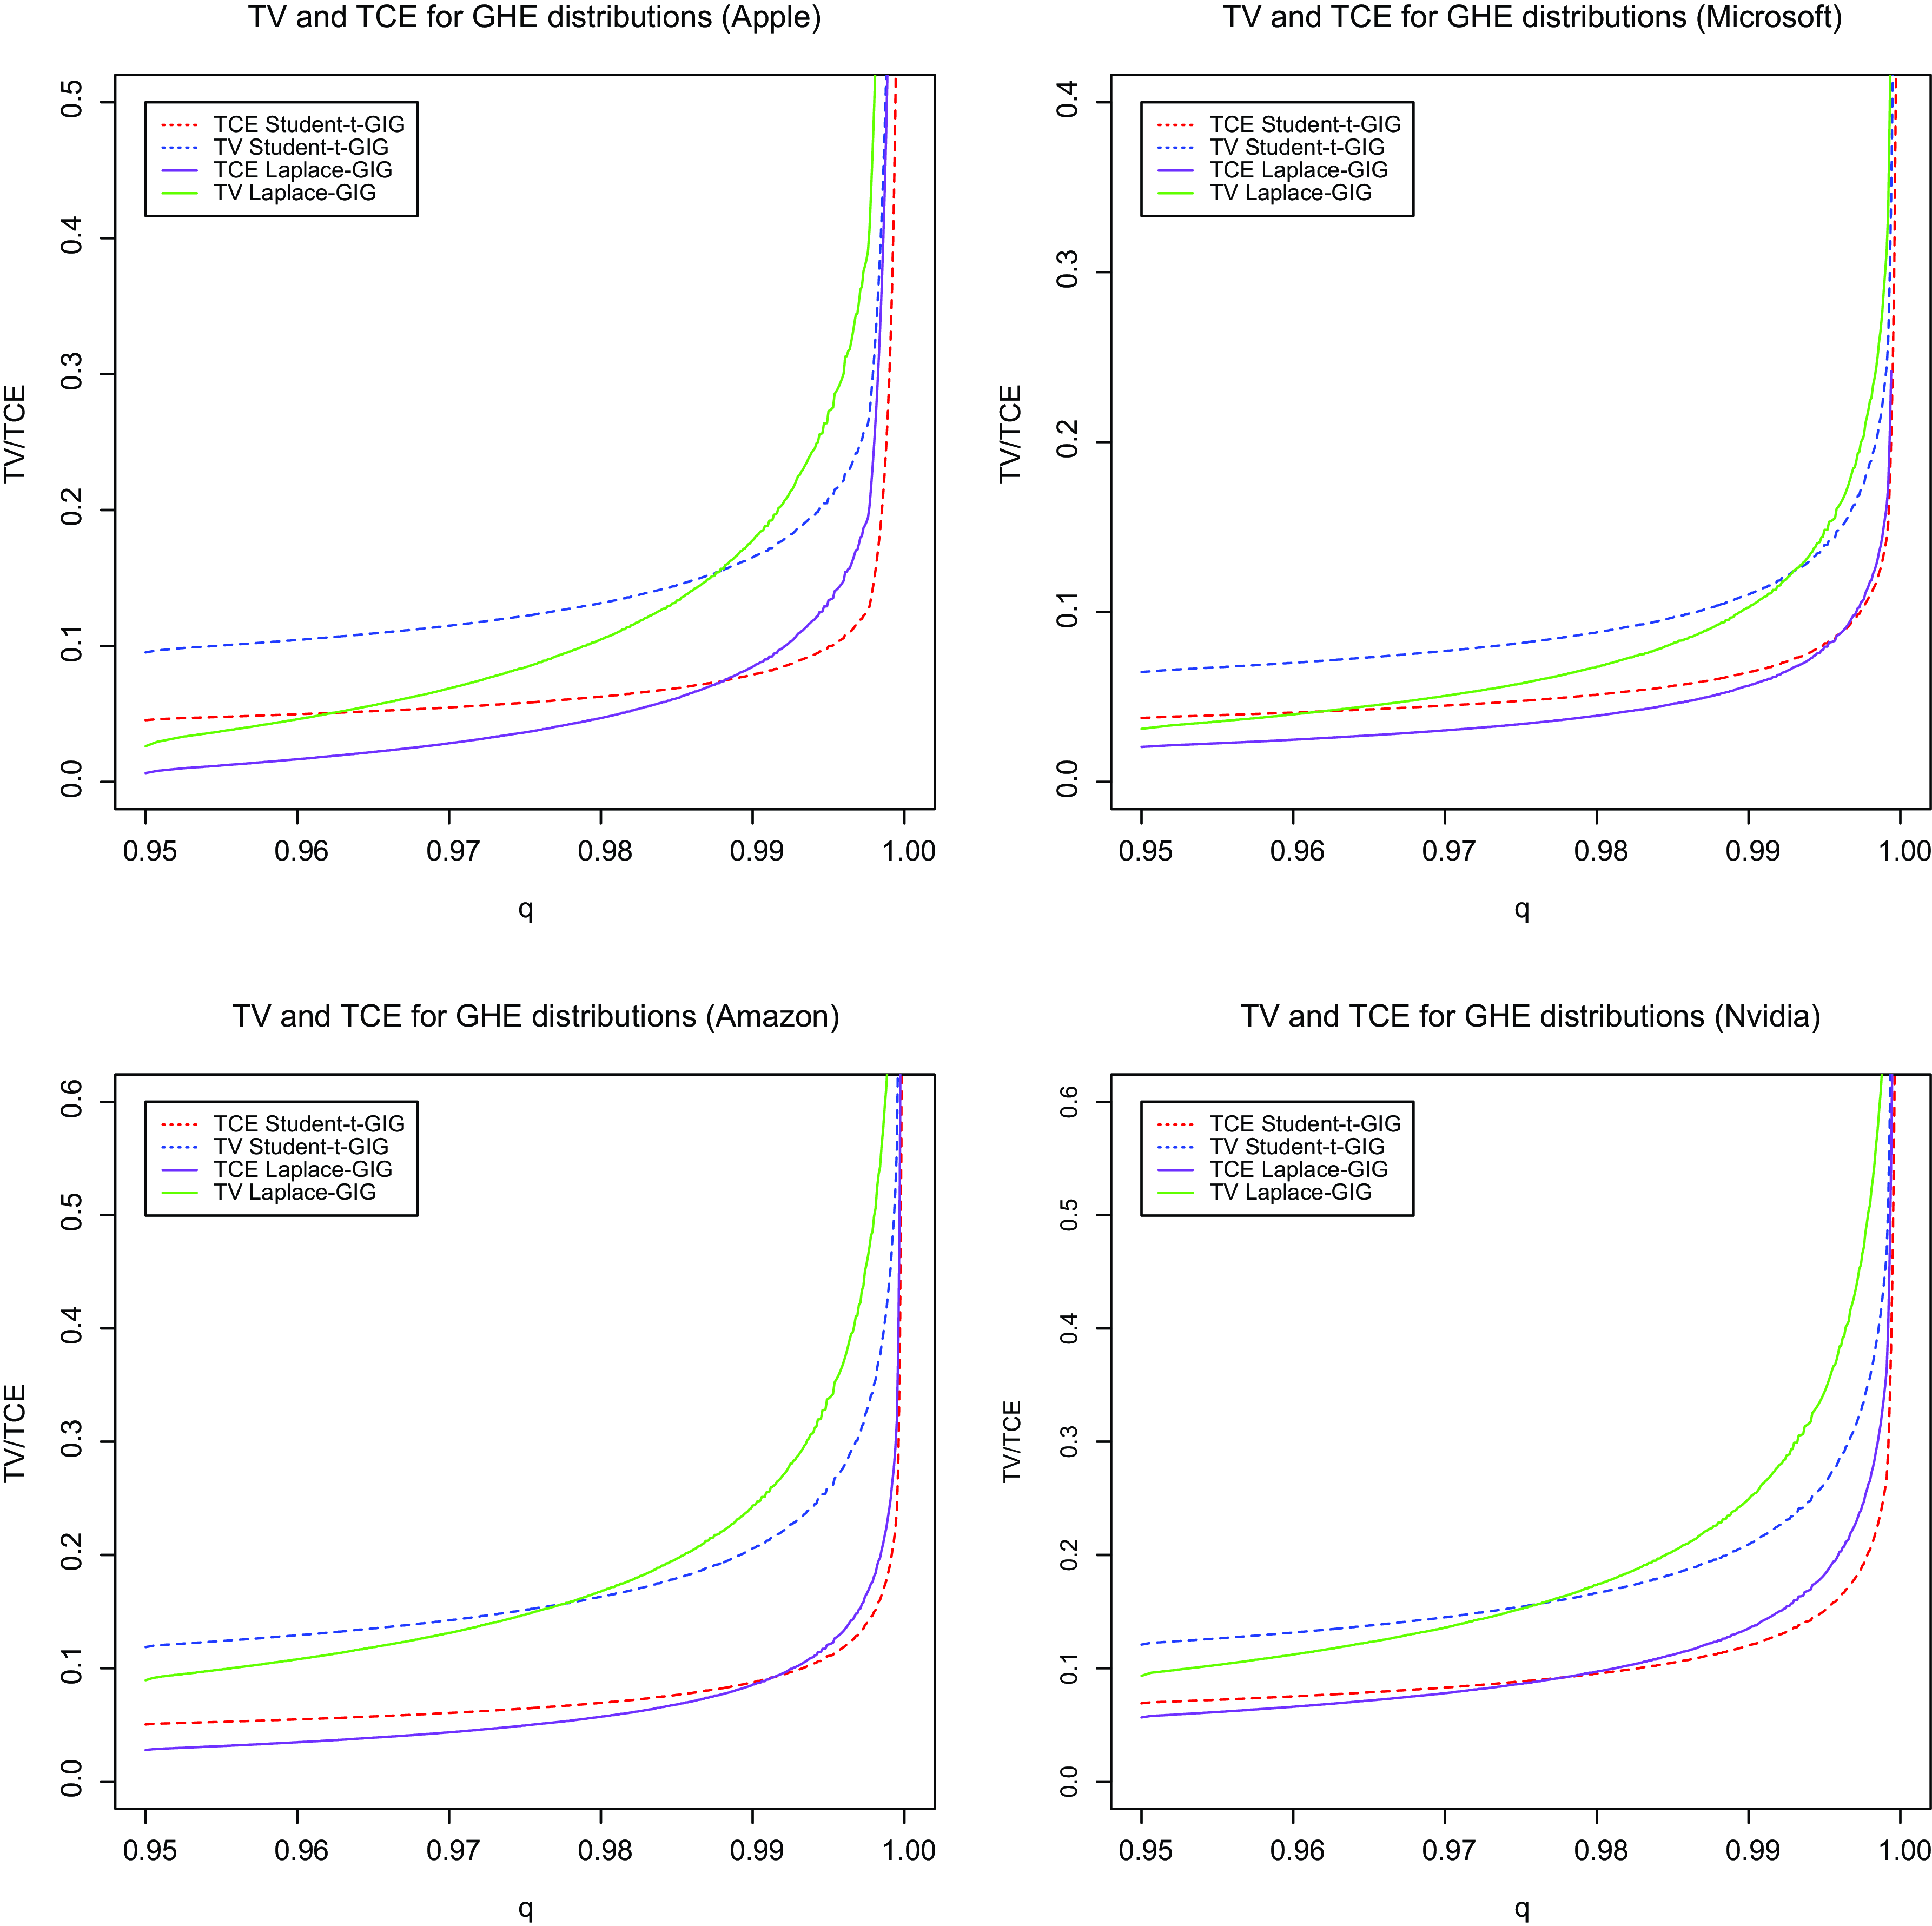
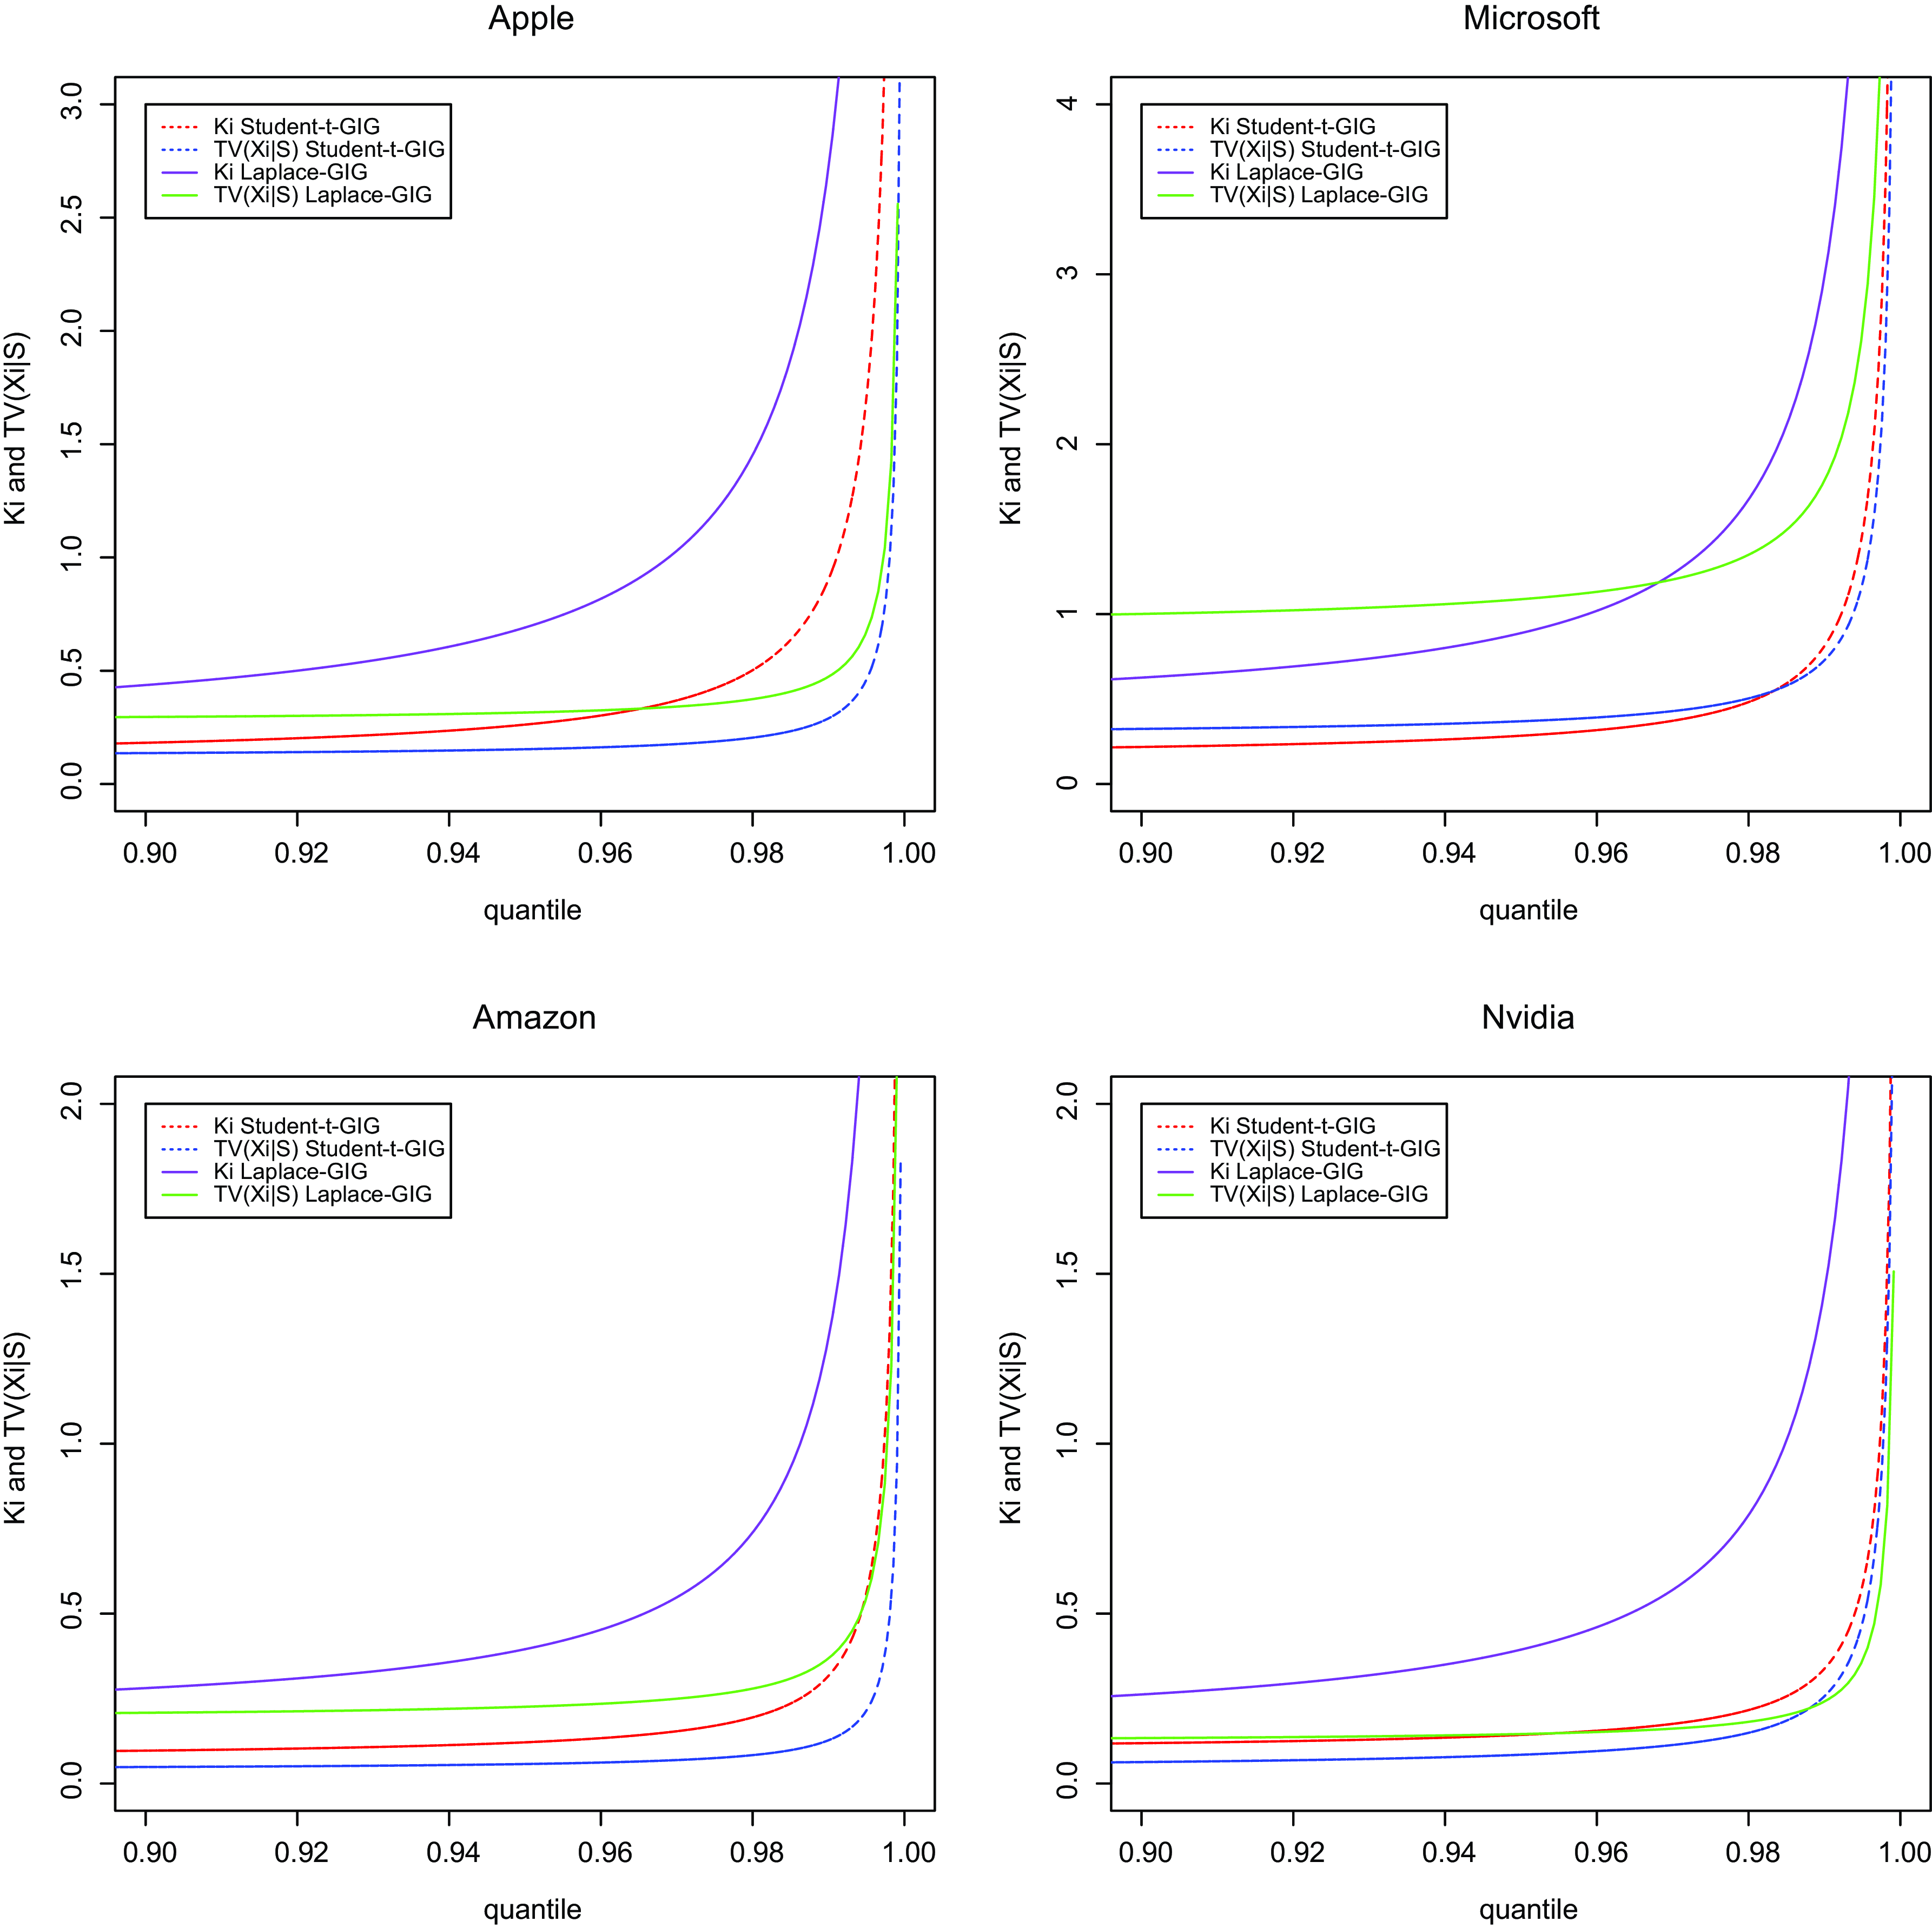
Using the estimated parameters from Table 2, we then calculate the univariate TV and TCE for the stock returns. The results are presented in Table 3 and graphically depicted in Figure 2 for both the GHE Laplace – GIG and GHE Student-t – GIG distributions, encompassing various quantile levels ranging from 0.95 to 0.999. In Figure 2, the TCE and TV for the Laplace – GIG distribution are represented by solid purple and green lines, respectively. The dotted red and blue lines depict the TCE and TV for the Student-t – GIG distribution, respectively. Our observations indicate that, for a specific quantile range, the TCE and TV for the Student-t – GIG distribution surpass their corresponding counterparts for the Laplace – GIG distribution. However, when considering extremely high quantiles, the Laplace – GIG distribution generates larger values for both TCE and TV compared to the Student-t – GIG distribution. This disparity can be attributed to the fatter tail of the distribution exhibited by the Laplace – GIG case, as we observed in Figure 1. Consequently, these findings suggest that the Laplace – GIG distribution leads to more conservative estimates for TV (as well as TCE). This result regarding the TCE aligns with the findings reported in Ignatieva and Landsman (Reference Ignatieva and Landsman2021) for insurance loss data.
Comparison of multivariate TVs and TCEs computed for Apple, Microsoft, Amazon and Nvidia stock returns using GHE (Laplace – GIG and Student-t – GIG) distributions at different quantile levels.

TCE-based allocations
 $K_i$
and
 $TV_q(X_i|S)$
computed for Apple, Microsoft, Amazon and Nvidia stock returns using GHE (Laplace – GIG and Student-t – GIG) distributions at different quantile levels.

5.2 Multivariate case
We analyse a multivariate portfolio comprising stock returns from Apple, Microsoft, Amazon and Nvidia. We fit multivariate GHE models (Laplace – GIG and Student-t – GIG) to the four-dimensional dataset. This approach differs from the analysis in Section 5.1, where univariate distributions were applied to each return individually. We begin by estimating the model parameters for the multivariate distribution, followed by the calculation of TV and TCE for the entire portfolio.
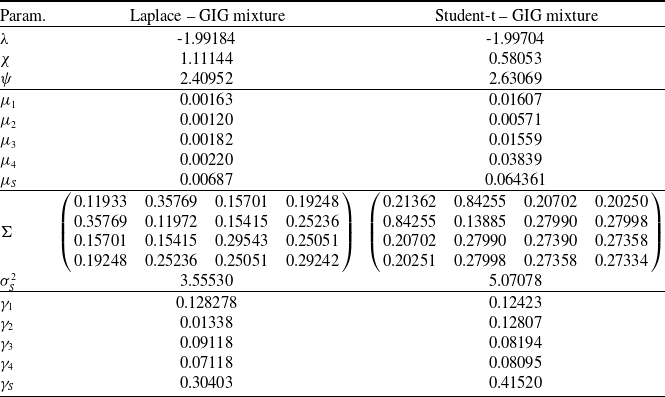
The estimated parameters for the multivariate data fitting are presented in Table 4.Footnote
5
Alongside the estimated values of
 $\lambda$
,
 $\chi$
and
 $\psi$
, we provide additional information including a vector of means denoted as
 $\boldsymbol{\mu}=(\mu_1,\mu_2,\mu_3,\mu_4)^T$
, a skewness vector represented as
 $\boldsymbol{\gamma}=(\gamma_1,\gamma_2,\gamma_3,\gamma_4)^T$
and a variance–covariance matrix denoted as
 $\Sigma$
. We use the variance–covariance matrix
 $\Sigma$
instead of the correlation matrix for several important reasons. First,
 $\Sigma$
is essential for the Cholesky decomposition, represented as
 $\Sigma = AA^T$
, which defines the random vector
 $\mathbf{X}$
. Second, in the theory of elliptical families,
 $\Sigma$
plays a central role, as it defines characteristic and density functions, and supports linear transformations of elliptical, GH and GHE random vectors. Furthermore,
 $\Sigma$
allows us to compute the aggregate sum variance
 $\sigma_S^2$
by summing its entries. The parameters
 $\mu_S$
and
 $\gamma_S$
for the aggregate sum S are determined by summing the components of the vectors
 $\boldsymbol{\mu}$
and
 $\boldsymbol{\gamma}$
, respectively. Additionally, the variance of the aggregate sum, denoted as
 $\sigma_S^2$
, is calculated directly from the entries of
 $\Sigma$
. In the multivariate setting, we find that the Laplace – GIG mixture exhibits larger values for the parameter
 $\psi$
compared to the Student-t – GIG distribution, which is also consistent with the univariate results. This observation suggests a higher kurtosis for the Laplace – GIG. Additionally, the positive but nearly zero values of the parameters
 $\gamma$
indicate a greater degree of symmetry for both mixtures.
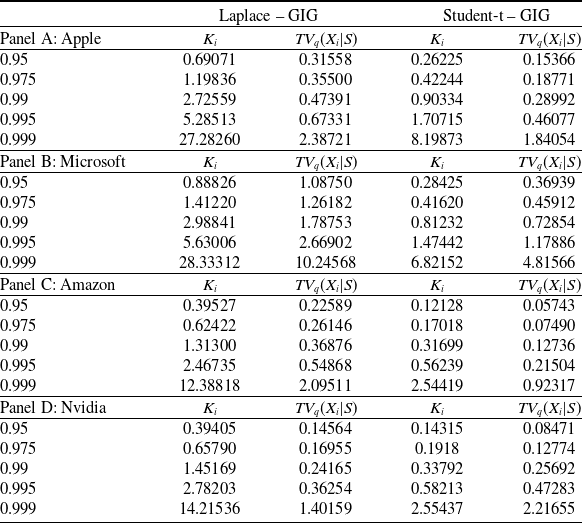
Utilising the parameter estimates provided in Table 4, we proceed to calculating the TV and the TCE for the stock returns in a multivariate setting. The results are reported in Table 5 for quantile levels ranging from 0.95 to 0.999. Furthermore, Figure 3 shows TCE- and TV-based allocations
 $K_i$
(from Equation (4.1)) and
 $TV_q(X_i|S)$
, respectively, for different stocks. In the graphical representation, we illustrate
 $K_i$
and
 $TV_q(X_i|S)$
for the Student-t – GIG distribution with dotted red and blue lines, respectively. For the Laplace – GIG distribution, we use solid purple and green lines to depict
 $K_i$
and
 $TV_q(X_i|S)$
, respectively. We observe that typically the Laplace – GIG distribution yields higher values for both TCE and TV compared to the Student-t – GIG distribution, which is consistent with the univariate scenario. This again aligns with the characteristic of the Laplace – GIG distribution having a heavier tail, which becomes evident in extreme tail regions.
We recall that TCE of the portfolio
 $TCE_{q}(S)$
can be decomposed into the sum of individual
 $K_i$
’s, that is, TCE-based allocation is additive and it holds
 $\sum_{i=1}^{d}K_{i}=TCE_{q}(S)$
). This result in general does not apply for the TV (i.e.,
 $\sum_{i=1}^{d}TV_q(X_i|S) \neq TV_{q}(S)$
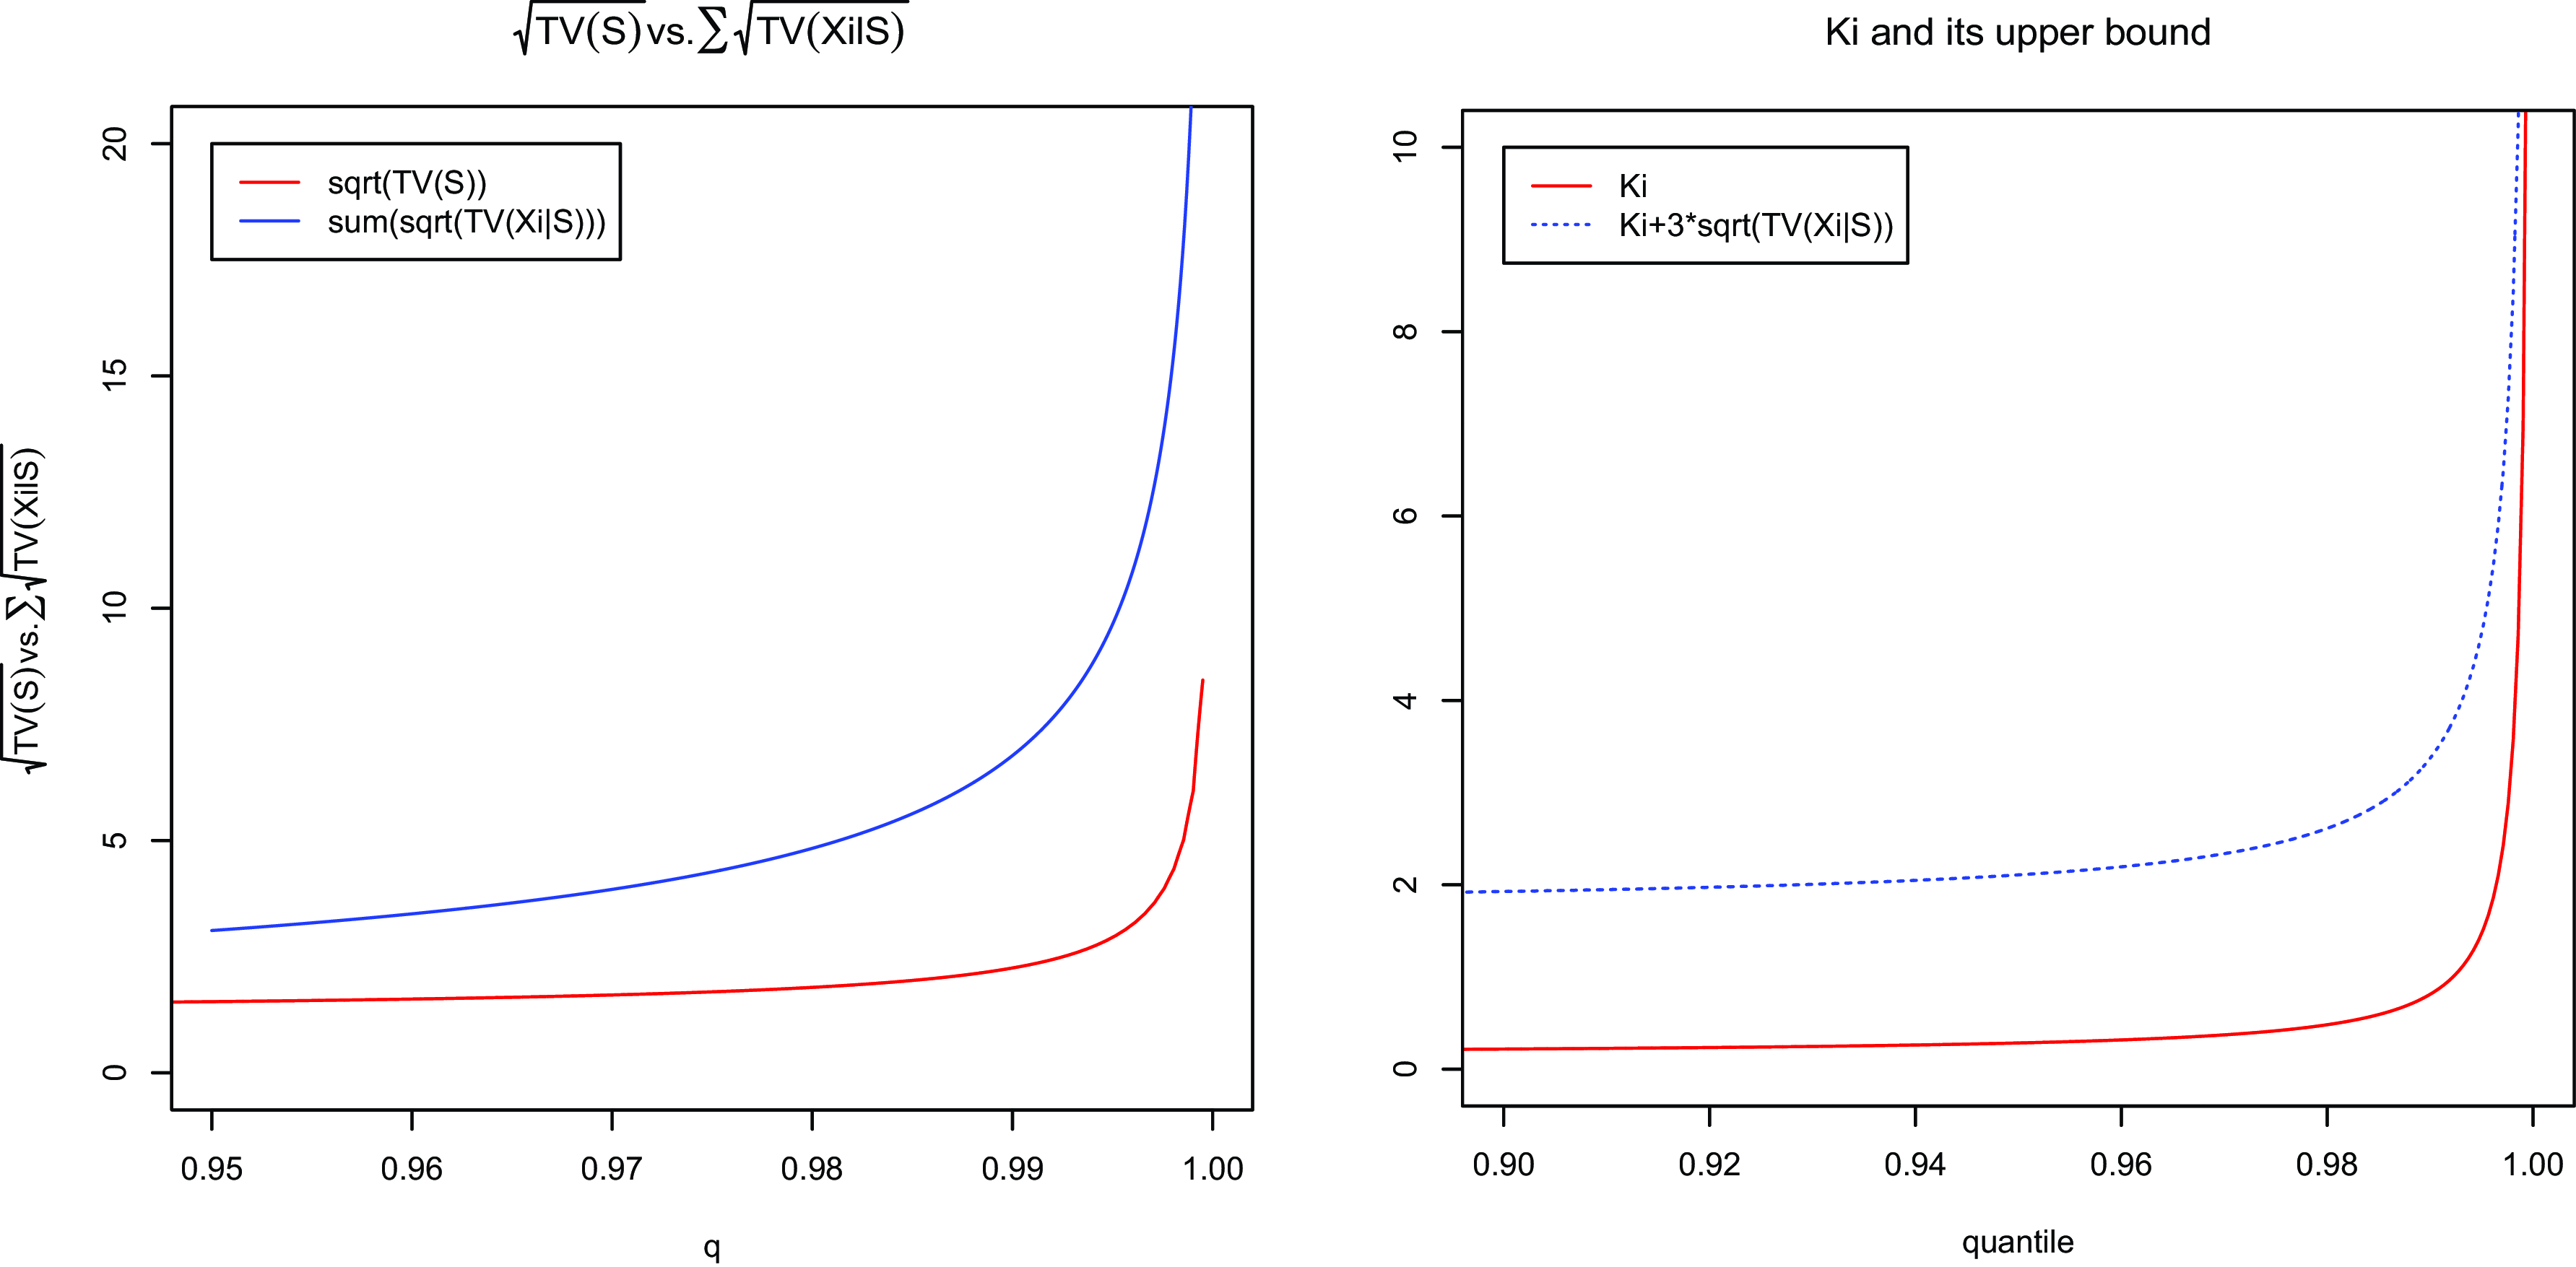
) as TV-based allocation is not additive. Furman and Landsman (Reference Furman and Landsman2006) show that the following result holds for the family of elliptical distributions:
 \begin{equation}\sqrt{TV_q(S)}\leq \sum_{i=1}^{d}\sqrt{TV_q(X_i|S)}.\end{equation}
We illustrate this result in the left panel of Figure 4 for the Student-t – GIG distribution. Finally, using the result of Proposition 4.1, we compute the upper bound for the TCE, which is shown in the right panel of Figure 4. The upper bound shown using the blue dashed line provides a threshold such that the risk will not exceed this boundary with probability 90%. To have this upper bound is particularly relevant to the insurance and financial industries, as it offers a reliable upper threshold for accurately assessing the risks associated with extreme losses.
Left panel: Comparison between
 $\sqrt{TV_q(S)}$
and
 $\sum_{i=1}^{d}\sqrt{TV_q(X_i|S)})$
computed for the GHE Student-t – GIG distributions for Apple, Microsoft, Amazon and Nvidia stock returns. Right panel: TCE and its upper bound for Apple stock computed using GHE Student-t – GIG distribution.

6. Conclusion
This paper introduces a novel theoretical framework for GHE distributions, presenting a closed-form expression for the TV as an additional risk measure to complement the previously derived in Ignatieva and Landsman (Reference Ignatieva and Landsman2021) TCE risk measure. TV serves as an insightful additional risk measure that illuminates the intricacies of tail risk and adeptly captures the variability present within the loss distribution’s tail. It offers valuable insights into achieving accurate quantification of correlated risks within a multivariate portfolio. Through empirical analysis for the univariate and multivariate scenario, the paper demonstrates the framework’s efficacy in providing reliable tail risk estimation for specific cases, such as the Laplace – GIG and the Student-t – GIG mixtures. Our multivariate analysis allows to quantify correlated risks by means of the TCE and TV risk measure. Despite the fact that TV is not an additive risk measures, we were able to derive TV-based allocations
 $TV_q(X_i|S)$
and assess an upper bound for the risk, ensuring that the risk will not surpass this threshold with a 90% probability. The integration of TV into the framework significantly enhances the efficiency of quantifying correlated risks in multivariate portfolios. This valuable contribution holds particular importance for the financial and insurance industries, as it provides a reliable method for assessing extreme loss risks. Ultimately, the paper’s findings strengthen risk assessment practices within these sectors, empowering decision-makers to make informed and prudent risk management choices.
Funding statement
Katja Ignatieva acknowledges the financial support of the Australian Government through the Australian Research Council’s Discovery Projects funding scheme – DP220100090.
A Appendix
A.1 TV-related computations
In this section, we address the computation of
 $\bar{F}_{GHE,1}(x_{q};\ \mu, \sigma ^{2},G,\gamma, l,\tilde{\lambda}_2,\chi, \psi )$
which enters TV formula in Equation (3.6) for the special cases of Laplace – GIG and Student-t – GIG mixtures. In other words, we need to evaluate the following expression for these distributions:
 \begin{eqnarray}\bar{F}_{GHE,1}(x_{q};\ \mu, \sigma ^{2},G,\gamma, l,\tilde{\lambda}_2,\chi, \psi )=\int_{0}^{\infty} \int_{-\infty}^{x_q}\frac{1}{\sigma\sqrt{w}}\bar{G}\left(\frac{1}{2}\left(\frac{x-\mu-\gamma w}{\sqrt{w}\sigma}\right)^2\right)dx f_W(w)dw.\end{eqnarray}
Laplace – GIG mixture
For the Laplace – GIG mixture, we use the result from Equation (2.10) for
 $\bar{G}(u)$
when evaluating the inner integral
 $I(z)=\int_{-\infty}^{z} \bar{G}\left(\frac{1}{2} u^2\right)du$
in Equation (A1), where
 $u=\frac{x-\mu-\gamma w}{\sqrt{w}\sigma}$
,
 $dx=du$
, separately for the case when
 $z\unicode{x003E} 0$
and
 $z\leq 0$
:
 \begin{eqnarray}I(z)=\int_{-\infty}^{z} \bar{G}\left(\frac{1}{2} u^2\right)du&=&\left\{\begin{array}{l}\frac{1}{2}-\frac{1}{2\sqrt{2}}z\exp\!(-\sqrt{2}z)+\frac{1}{2}\left(1-\exp\!(-\sqrt{2}z)\right),z \unicode{x003E} 0; \\\left(\frac{1}{2}-\frac{1}{2\sqrt{2}}z\right)\exp\!(-\sqrt{2}z), z \unicode{x003C} 0 \\\end{array}\right.\end{eqnarray}
The outer integral in Equation (A1) can be evaluated numerically, after plugging in the result for
 $f_W(w)$
in Equation (2.4) with parameter
 $l=2$
.
Student-t – GIG mixture
For the Student-t – GIG mixture, to simplify notation, we denote
 $a=\mu+\gamma w$
and
 $c=\sqrt{w}\sigma$
. We can show that the inner integral corresponds to
 \begin{eqnarray}\frac{1}{c}\bar{G}\left(\frac{1}{2}\left(\frac{x-a}{c}\right)^2\right)=c_p\frac{\nu}{2(p-1)}\frac{1}{\tilde{c}}\frac{1}{c_{\nu^{'}}}\underbrace{c_{\nu^{'}}\frac{1}{c^{''}}\left(1+\frac{1}{\nu^{'}}\left(\frac{x-a}{c^{''}}\right)^2\right)^{-\frac{\nu^{'}+1}{2}}}_{\text{Student-t pdf}\left(\frac{x-a}{c},\nu^{'}\right)},\end{eqnarray}
where
 $c_p$
is defined in Equation (2.12) and
 $\nu^{'}=\nu-2$
,
 $\tilde{c}=\sqrt{\nu^{'}/\nu}$
,
 $c^{''}=\frac{c}{\tilde{c}}$
. Thus, we recognise in Equation (A3) the pdf of Student-t distribution with
 $\nu^{'}$
degrees of freedom, evaluated at
 $\frac{x-a}{c}$
. Integrating the expression in Equation (A3), we obtain an inner integral from Equation (A1):
 \begin{eqnarray} \int_{-\infty}^{x_q}\frac{1}{c}\bar{G}\left(\frac{1}{2}\left(\frac{x-a}{c}\right)^2\right)dx=c_p\frac{\nu}{2(p-1)}\frac{1}{\tilde{c}}\frac{1}{c_{\nu^{'}}}F_{\text{Student-t}}\left(\frac{x-a}{c},\nu^{'}\right),\end{eqnarray}
where
 $F_{\text{Student-t}}(\cdot)$
denotes a cdf of Student-t distribution with
 $\nu$
degrees of freedom, evaluated at
 $\frac{x-a}{c}$
. Given the result from Equation (A4), the outer integral in Equation (A1) can be evaluated numerically, after plugging in formula for
 $f_W(w)$
with parameter
 $l=1$
.
A.2 Proof of Theorem 3.1
Proof. We investigate a key characteristic of the GHE distribution, namely its representation as a mixture of an elliptical distribution with a GIG mixing distribution. The proof of this theorem is more complex than that of Theorem 3.1 from Ignatieva and Landsman (Reference Ignatieva and Landsman2021). We will highlight only the key differences from the cited paper. In fact, we can write
 \begin{equation}TV_{q}(X)=\frac{1}{1-q}\int_{0}^{\infty }I_{w}f_{W}(w)dw - (TCE_{q}(X))^2, \end{equation}
where the integral
 \begin{equation}I_{w}=\int_{x_{q}}^{\infty }y^2f_{X|w}(y)dy. \end{equation}
This integral is more complex than the corresponding integral given in Eq. (3.9) of Ignatieva and Landsman (Reference Ignatieva and Landsman2021), because instead of integral of y we have the integral of
 $y^{2}.$
Recall that the pdf of
 $W^{1/l}$
has a form in Equation (2.2). Then it holds
 \begin{equation}I_{w}=\frac{c}{\sigma \sqrt{w}}\int_{x_{q}}^{\infty }y^2g\left( \frac{1}{2w\sigma ^{2}}(y-\mu -\gamma w)^{2}\right) dy. \end{equation}
After applying the transformation
 $z=(y-\mu -\gamma w)/\sqrt{w}\sigma $
,
 $dy=\sqrt{w}\sigma dz$
, we obtain
 \begin{eqnarray}I_{w} &=&\frac{c}{\sigma \sqrt{w}}\int_{\frac{x_{q}-\mu -\gamma w}{\sqrt{w}\sigma }}^{\infty }\left( \mu +\gamma w+\sqrt{w}\sigma z\right) ^{2}g\left(\frac{1}{2}z^{2}\right) \sqrt{w}\sigma dz \notag \\&=&c(\mu +\gamma w)^{2}\int_{\frac{x_{q}-\mu -\gamma w}{\sqrt{w}\sigma }}^{\infty }g\left( \frac{1}{2}z^{2}\right) dz+cw\sigma ^{2}\int_{\frac{x_{q}-\mu -\gamma w}{\sqrt{w}\sigma }}^{\infty }z^{2}g\left( \frac{1}{2}z^{2}\right) dz \notag \\&+&2c(\mu +\gamma w)\sqrt{w}\sigma \int_{\frac{x_{q}-\mu -\gamma w}{\sqrt{w}\sigma }}^{\infty }zg\left( \frac{1}{2}z^{2}\right) dz \notag \\&=&(\mu +\gamma w)^{2}\bar{F}_{Z}\left( \frac{x_{q}-\mu -\gamma w}{\sigma\sqrt{w}}\right) +\sqrt{w}\sigma \left( x_{q}+\mu +\gamma w\right) \bar{G}\left( \frac{1}{2}\left( \frac{x_{q}-\mu -\gamma w}{\sqrt{w}\sigma }\right)^{2}\right) \notag \\&+&w\sigma ^{2}\sigma _{Z}^{2}\bar{F}_{Z^{\ast }}\left( \frac{x_{q}-\mu-\gamma w}{\sigma \sqrt{w}}\right) \end{eqnarray}
where we used
 \begin{eqnarray}\nonumber-w\sigma^2\int_{\frac{x_{q}-\mu -\gamma w}{\sqrt{w}\sigma }}^{\infty}zd\bar{G}\left(\frac{1}{2}z^{2}\right)&=&-w\sigma^2z\bar{G}\left(\frac{1}{2}z^{2}\right)\rvert _{\frac{x_{q}-\mu -\gamma w}{\sqrt{w}\sigma }}^{\infty }+w\sigma^2\sigma_Z^2\int_{\frac{x_{q}-\mu -\gamma w}{\sqrt{w}\sigma }}^{\infty}\frac{1}{\sigma_Z^2}\bar{G}\left(\frac{1}{2}z^{2}\right)dz\\&=&w\sigma^2\frac{x_{q}-\mu -\gamma w}{\sqrt{w}\sigma }\bar{G}\left( \frac{1}{2}\left( \frac{x_{q}-\mu -\gamma w}{\sqrt{w}\sigma }\right)\!^{2}\right)\!+\!w\sigma^2\sigma_{Z}^2\bar{F}_{Z^{\ast }}\!\left( \frac{x_{q}-\mu -\gamma w}{\sigma \sqrt{w}}\right)\!.\nonumber\\\end{eqnarray}
In this context,
 $F_Z(z)$
represents the cdf of the spherical random variable Z, while
 \begin{equation}f_{Z^{\ast }}(z) = \frac{1}{\sigma_Z^2} \bar{G}\left( \frac{1}{2} z^2 \right)\end{equation}
is the pdf of another spherical random variable
 $Z^{\ast}$
, associated with Z. Given the condition in Equation (3.3), G(z) serves as the density generator for an associated elliptical random variable defined as:
 \begin{equation}X^{\ast} = \mu + \gamma W + \sqrt{W} \sigma Z^{\ast}.\end{equation}
Substituting the result for
 $I_{w}$
from Equation (A8) into Equation (A5), we obtain
 \begin{eqnarray}TV_{q}(X) &=&\frac{1}{1-q}\int_{0}^{\infty }(\mu+\gamma w)^2\bar{F}_{Z}\left( \frac{x_{q}-\mu -\gamma w}{\sigma \sqrt{w}}\right)f_W(w)dw\nonumber\\&+&\frac{\sigma}{1-q}\int_{0}^{\infty }\sqrt{w}\left(x_q+\mu+\gamma w\right)\bar{G}\left( \frac{1}{2}\left( \frac{x_{q}-\mu -\gamma w}{\sqrt{w}\sigma }\right) ^{2}\right)f_W(w)dw\nonumber\\&+&\frac{\sigma^2\sigma_{Z}^2}{1-q}\int_{0}^{\infty }w\bar{F}_{Z^{\ast }}\left( \frac{x_{q}-\mu -\gamma w}{\sigma \sqrt{w}}\right)f_W(w)dw - (TCE_{q}(X))^2\nonumber\\&=&\frac{\mu^2}{1-q}\int_{0}^{\infty }\bar{F}_{Z}\left( \frac{x_{q}-\mu -\gamma w}{\sigma \sqrt{w}}\right)f_W(w)dw+\frac{2\mu\gamma}{1-q}\int_{0}^{\infty }\bar{F}_{Z}\left( \frac{x_{q}-\mu -\gamma w}{\sigma \sqrt{w}}\right)wf_W(w)dw\nonumber\\&+&\frac{\gamma^2}{1-q}\int_{0}^{\infty }\bar{F}_{Z}\left( \frac{x_{q}-\mu -\gamma w}{\sigma \sqrt{w}}\right)w^2f_W(w)dw\nonumber\\&+&\frac{(x_q+\mu)\sigma^2}{1-q}\int_{0}^{\infty }\frac{1}{\sqrt{w}\sigma}\bar{G}\left( \frac{1}{2}\left( \frac{x_{q}-\mu -\gamma w}{\sqrt{w}\sigma }\right) ^{2}\right)wf_W(w)dw\nonumber\\&+&\frac{\gamma\sigma^2}{1-q}\int_{0}^{\infty }\frac{1}{\sqrt{w}\sigma}\bar{G}\left( \frac{1}{2}\left( \frac{x_{q}-\mu -\gamma w}{\sqrt{w}\sigma }\right) ^{2}\right)w^{2}f_W(w)dw\nonumber\\&+&\frac{\sigma^2\sigma_{Z}^2}{1-q}\int_{0}^{\infty }\bar{F}_{Z^{\ast }}\left( \frac{x_{q}-\mu -\gamma w}{\sigma \sqrt{w}}\right)wf_W(w)dw - (TCE_{q}(X))^2.\end{eqnarray}
Now, we assess
 $w^{1/2}f_{W}(w)$
,
 $wf_{W}(w)$
,
 $w^{3/2}f_{W}(w)$
and
 $w^{2}f_{W}(w)$
that enter Equation (A12) by writing
 $w^{i/2}f_{W}(w)$
, where
 $i=1,2,3,4$
, that is,
 \begin{eqnarray}w^{j/2}f_{W}(w) &=&w^{i/2}c_{\lambda, \chi, \psi }\frac{1}{l}w^{\lambda/l-1}\exp\!(-\frac{1}{2}(\chi w^{-1/l}+\psi w^{1/l})) \notag \\&=&\underbrace{\frac{1}{l}c_{\tilde{\lambda _{j}},\chi, \psi }w^{\tilde{\lambda _{j}}/l-1}\exp\!(-\frac{1}{2}(\chi w^{-l}+\psi w^{l}))}_{f_{l,\tilde{\lambda}_{j},\chi, \psi }(w)}\underbrace{\frac{c_{\lambda, \chi, \psi }}{c_{\tilde{\lambda}_{j},\chi, \psi }}}_{k_{\lambda, \tilde{\lambda}_{j}}} \notag \\&=&f_{l,\tilde{\lambda}_{j},\chi, \psi }(w)k_{\lambda, \tilde{\lambda}_{j}}.\end{eqnarray}
Furthermore,
 $\tilde{\lambda}_{j}$
(
 $j=1,2,3,4$
) corresponding to
 $w^{1/2}f_{W}(w)$
,
 $wf_{W}(w)$
,
 $w^{3/2}f_{W}(w)$
and
 $w^{2}f_{W}(w)$
, respectively, are defined as:
 \begin{equation*}\tilde{\lambda}_{j}=\lambda +\frac{jl}{2},\end{equation*}
where
 $f_{W_{\tilde{\lambda}_{j},\chi, \psi }}(w)=f_{l,\tilde{\lambda}_{j},\chi, \psi }(w)$
is the pdf of W with parameters
 $\tilde{\lambda}_{j},\chi, \psi $
. Furthermore, we obtain
 \begin{equation}k_{\lambda, \tilde{\lambda}_{j}}=\left( \sqrt{\frac{\chi }{\psi }}\right) ^{\tilde{\lambda}_{j}-\lambda }\frac{K_{\tilde{\lambda}_{j}}(\sqrt{\chi \psi })}{K_{\lambda }(\sqrt{\chi \psi })}. \end{equation}
Substituting the outcome of Equation (A13) in Equation (A12), we obtain
 \begin{eqnarray} \notag TV_{q}(X) &=&\mu^2 +\frac{2\mu\gamma }{1-q}k_{\lambda, \tilde{\lambda}_2}\int_{0}^{\infty }\bar{F}_{Z}\left(\frac{x_{q}-\mu -\gamma w}{\sigma \sqrt{w}}\right) f_{l,\tilde{\lambda}_2,\chi,\psi }(w)dw\\\nonumber &+& \frac{\gamma^2}{1-q}k_{\lambda, \tilde{\lambda}_4}\int_{0}^{\infty }\bar{F}_{Z}\left(\frac{x_{q}-\mu -\gamma w}{\sigma \sqrt{w}}\right) f_{l,\tilde{\lambda}_4,\chi,\psi }(w)dw \\&+&\frac{(x_q+\mu)\sigma ^{2}\sigma_Z^{2}}{1-q}k_{\lambda, \tilde{\lambda}_2}\int_{0}^{\infty }\frac{1}{\sigma_Z^2\sqrt{w}\sigma }\bar{G}\left( \frac{1}{2}\left( \frac{x_{q}-\mu -\gamma w}{\sqrt{w}\sigma }\right)^{2}\right) f_{l,\tilde{\lambda}_2,\chi, \psi }(w)dw \notag \\&+&\frac{\gamma\sigma^2}{1-q}k_{\lambda, \tilde{\lambda}_4}\int_{0}^{\infty }\frac{1}{\sqrt{w}\sigma }\bar{G}\left( \frac{1}{2}\left( \frac{x_{q}-\mu -\gamma w}{\sqrt{w}\sigma }\right)^{2}\right) f_{l,\tilde{\lambda}_4,\chi, \psi }(w)dw \notag \\&+&\frac{\sigma^2\sigma_{Z}^2}{1-q}k_{\lambda, \tilde{\lambda}_2}\int_{0}^{\infty }\bar{F}_{Z^{\ast }}\left( \frac{x_{q}-\mu -\gamma w}{\sigma \sqrt{w}}\right)f_{l,\tilde{\lambda}_2,\chi, \psi }(w)dw - (TCE_{q}(X))^2 \notag \\&=&\mu^2\! +\frac{2\mu\gamma }{1-q}k_{\lambda, \tilde{\lambda}_2}\bar{F}_{GHE,1}(x_{q};\ \mu, \sigma ^{2},g,\gamma, l,\tilde{\lambda}_2,\chi, \psi ) + \frac{\gamma^2}{1-q}k_{\lambda, \tilde{\lambda}_4}\bar{F}_{GHE,1}(x_{q};\ \mu, \sigma ^{2},g,\gamma, l,\tilde{\lambda}_4,\chi, \psi )\notag \\&+&\frac{(x_q+\mu)\sigma ^{2}}{1-q}\sigma_Z^2k_{\lambda, \tilde{\lambda}_2}f_{GHE,1}(x_{q};\ \mu, \sigma ^{2},G,\gamma, l,\tilde{\lambda}_2,\chi,\psi )\notag \\&+&\frac{\gamma\sigma^2}{1-q}k_{\lambda, \tilde{\lambda}_4}f_{GHE,1}(x_{q};\ \mu, \sigma ^{2},G,\gamma, l,\tilde{\lambda}_4,\chi,\psi )\notag \\&+&\frac{\sigma^2\sigma_{Z}^2}{1-q}k_{\lambda, \tilde{\lambda}_2}\bar{F}_{GHE,1}(x_{q};\ \mu, \sigma ^{2},G,\gamma, l,\tilde{\lambda}_2,\chi, \psi )-(TCE_q(X))^2,\end{eqnarray}
where
 \begin{equation}F_{GHE,1}(x_{q},\mu, \sigma ^{2},g,\gamma, l,\tilde{\lambda}_j,\chi, \psi)=1-\int_{0}^{\infty }\bar{F}_{Z}\left( \frac{x_{q}-\mu -\gamma w}{\sigma\sqrt{w}}\right) f_{l,\tilde{\lambda}_j,\chi, \psi }(w)dw, \end{equation}
is the cdf of a GHE-distributed random variable
 $X_j$
with the parameter
 $\tilde{\lambda}_j$
and
 \begin{eqnarray}&&f_{GHE,1}(x,\mu, \sigma ^{2},G,\gamma, l,\tilde{\lambda}_j,\chi, \psi )\notag \\&=&\frac{1}{\sigma _{Z}^{2}}\int_{0}^{\infty }\frac{1}{\sqrt{w}\sigma }\bar{G}\left( \frac{1}{2}\left( \frac{x_{q}-\mu -\gamma w}{\sqrt{w}\sigma }\right)^{2}\right) f_{l,\tilde{\lambda}_j,\chi, \psi }(w)dw \notag \\&=&\int_{0}^{\infty }\frac{1}{\sqrt{w}\sigma }f_{Z^{\ast }}(\frac{x_{q}-\mu-\gamma w}{\sqrt{w}\sigma })f_{l,\tilde{\lambda}_j,\chi, \psi }(w)dw\end{eqnarray}
is the pdf of the GHE random variable
 $X^{\ast }_j$
associated with
 $X_j$
. Finally,
 $\bar{F}_{GHE,1}(x_{q};\ \mu, \sigma ^{2},G,\gamma, l,\tilde{\lambda}_2,\chi, \psi )$
denotes the cdf of a GHE-distributed random variable
 $X^{\ast }_2$
. In the final step of the calculation, we plug in TCE formula from Equation (3.4) into Equation (A15), keeping in mind that
 $k_{\lambda, \tilde{\lambda}}=k_{\lambda, \tilde{\lambda}_2}$
to obtain
 \begin{eqnarray}TV_{q}(X) &=&\mu ^{2}+\frac{2\mu \gamma }{1-q}k_{\lambda, \tilde{\lambda}_{2}}\bar{F}_{GHE,1}(x_{q};\ \mu, \sigma ^{2},g,\gamma, l,\tilde{\lambda}_{2},\chi, \psi )+\frac{\gamma ^{2}}{1-q}k_{\lambda, \tilde{\lambda}_{4}}\bar{F}_{GHE,1}(x_{q};\ \mu, \sigma ^{2},g,\gamma, l,\tilde{\lambda}_{4},\chi,\psi ) \notag \\&+&\frac{x_{q}\sigma ^{2}}{1-q}\sigma _{Z}^{2}k_{\lambda, \tilde{\lambda}_{2}}f_{GHE,1}(x_{q};\ \mu, \sigma ^{2},G,\gamma, l,\tilde{\lambda}_{2},\chi,\psi )+\frac{\mu \sigma ^{2}}{1-q}\sigma _{Z}^{2}k_{\lambda, \tilde{\lambda}_{2}}f_{GHE,1}(x_{q};\ \mu, \sigma ^{2},G,\gamma, l,\tilde{\lambda}_{2},\chi,\psi ) \notag \\&+&\frac{\gamma \sigma ^{2}}{1-q}k_{\lambda, \tilde{\lambda}_{4}}f_{GHE,1}(x_{q};\ \mu, \sigma ^{2},G,\gamma, l,\tilde{\lambda}_{4},\chi,\psi )+\frac{\sigma ^{2}\sigma _{Z}^{2}}{1-q}k_{\lambda, \tilde{\lambda}_{2}}\bar{F}_{GHE,1}(x_{q};\ \mu, \sigma ^{2},G,\gamma, l,\tilde{\lambda}_{2},\chi, \psi ) \notag \\&-&\mu ^{2}-\frac{\gamma ^{2}}{(1-q)^{2}}k_{\lambda, \tilde{\lambda}_{2}}^{2}\bar{F}_{GHE,1}(x_{q};\ \mu, \sigma ^{2},g,\gamma, l,\tilde{\lambda}_{2},\chi,\psi )^{2}\notag \\&-&\frac{\sigma ^{4}\sigma _{Z}^{4}k_{\lambda, \tilde{\lambda}_{2}}^{2}}{(1-q)^{2}}f_{GHE,1}(x_{q};\ \mu, \sigma ^{2},G,\gamma, l,\tilde{\lambda}_{2},\chi, \psi )^{2} \notag \\&-&\frac{2\mu \gamma k_{\lambda, \tilde{\lambda}_{2}}}{(1-q)}\bar{F}_{GHE,1}(x_{q};\ \mu, \sigma ^{2},g,\gamma, l,\tilde{\lambda}_{2},\chi, \psi )-\frac{2\mu \sigma ^{2}\sigma _{Z}^{2}k_{\lambda, \tilde{\lambda}_{2}}}{(1-q)}f_{GHE,1}(x_{q};\ \mu, \sigma ^{2},G,\gamma, l,\tilde{\lambda}_{2},\chi, \psi )\notag \\&-&\frac{2\gamma \sigma ^{2}\sigma _{Z}^{2}k_{\lambda, \tilde{\lambda}_{2}}^{2}}{(1-q)^{2}}\bar{F}_{GHE,1}(x_{q};\ \mu, \sigma ^{2},g,\gamma, l,\tilde{\lambda}_{2},\chi, \psi )f_{GHE,1}(x_{q};\ \mu, \sigma ^{2},G,\gamma, l,\tilde{\lambda}_{2},\chi, \psi ) \notag\end{eqnarray}
The statement of Theorem 3.1 follows directly from this result.
A.3 Proof of Lemma 4.1
Proof. The proof of the first part of the Lemma is more complex than the proof of Lemma 3.1 in Ignatieva and Landsman (Reference Ignatieva and Landsman2021). Instead of calculating the integral as in Equation (3.25) of Ignatieva and Landsman (Reference Ignatieva and Landsman2021), we must compute the following, assuming that
 $\mathbf{Y} \mid w \sim E_{2}(\boldsymbol{\mu} + \boldsymbol{\gamma}w, w\Sigma, g_{2}, \boldsymbol{\gamma}, l, \lambda, \chi, \psi)$
:
 \begin{equation}(1-q)E(Y_{1}^{2}|Y_{2}\unicode{x003E} y_{2,q})=\int_{0}^{\infty }\tilde{I}_{w}f_{l,\lambda,\chi, \psi }(w)dw, \end{equation}
where
 \begin{equation*}\tilde{I}_{w}=\int_{-\infty }^{\infty }y_{1}^{2}\left(\int_{y_{2,q}}^{\infty }\frac{c_{2}}{\sqrt{\left\vert \boldsymbol{\Sigma }\right\vert }w}g_{2}\left[\tfrac{1}{2w}\left( \boldsymbol{y-\mu -}\boldsymbol{\gamma }w\right) ^{T}\boldsymbol{\Sigma }^{-1}\left( \boldsymbol{y-\mu -}\boldsymbol{\gamma }w\right) \right] dy_{2}\right)dy_{1},\end{equation*}
and
 $f_{l,\lambda, \chi, \psi }(w)$
has the form in Equation (2.4). Here, we observe that in
 $\tilde{I}_{w}$
, instead of integrating
 $y_{1}$
, we now integrate
 $y_{1}^{2}$
. By applying the same transformation,
 $z_{1} = \frac{y_{1} - \mu_{1} - \gamma_{1}w}{\sqrt{w}\sigma_{1}}$
and
 $z_{2} = \frac{y_{2} - \mu_{2} - \gamma_{2}w}{\sqrt{w}\sigma_{2}}$
, we obtain a representation for
 $\tilde{I}_{w}$
that is more complex than Equation (3.26) in Ignatieva and Landsman (Reference Ignatieva and Landsman2021):
 \begin{eqnarray}\tilde{I}_{w} &=&\frac{c_{2}}{\sqrt{(1-\rho _{12}^{2})}}\int_{(y_{2,q}-\mu_{2}-\gamma _{2}w)/(\sqrt{w}\sigma _{2})}^{\infty }dz_{2}\int_{-\infty}^{\infty }(\mu _{1}+\gamma _{1}w+\sqrt{w}\sigma _{1}z_{1})^{2} \notag \\&&\times g_{2}\left( -\frac{1}{2(1-\rho _{12}^{2})}(z_{1}^{2}-2\rho_{12}z_{1}z_{2}+z_{2}^{2})\right) dz_{1} \notag \\&=&(\mu _{1}+\gamma _{1}w)^{2}\bar{F}_{Z}((y_{2,q}-\mu _{2}-\gamma _{2}w)/(\sqrt{w}\sigma _{2}))+{I}_{2}+{I}_{3}. \notag \end{eqnarray}
Here, we obtain
 \begin{eqnarray*}I_{2} &=&2(\mu _{1}+\gamma _{1}w)\sqrt{w}\sigma _{1}\frac{c_{2}}{\sqrt{(1-\rho _{12}^{2})}}\int_{(y_{2,q}-\mu _{2}-\gamma _{2}w)/(\sqrt{w}\sigma_{2})}^{\infty }\!z_{1}\!\int_{-\infty }^{\infty }\!g_{2}\left( -\frac{1}{2(1-\rho_{12}^{2})}(z_{1}^{2}-2\rho _{12}z_{1}z_{2}+z_{2}^{2})\right) dz_{2}dz_{1} \\&=&2(\mu _{1}+\gamma _{1}w)\sqrt{w}\sigma _{1}\rho _{12}\sigma_{Z}^{2}f_{Z^{\ast }}(\frac{y_{2,q}-\mu _{2}-\gamma _{2}w}{\sqrt{w}\sigma_{2}}).\end{eqnarray*}
For the the component
 $I_{3}$
, we apply another transformation:
 \begin{equation*}\left\{\begin{array}{l}z^{\prime }=(z_{1}-\rho _{12}z_{2})/\sqrt{(1-\rho _{12}^{2})} \\z_{2}=z_{2}\end{array}\right.\end{equation*}
and obtain
 \begin{eqnarray*}I_{3} &=&w\sigma _{1}^{2}c_{2}\int_{(y_{2,q}-\mu _{2}-\gamma _{2}w)/(\sqrt{w}\sigma _{2})}^{\infty }dz_{2}\int_{-\infty }^{\infty }(\sqrt{(1-\rho_{12}^{2})}z^{\prime }+\rho _{12}z_{2})^{2}g_{2}(\frac{1}{2}z^{\prime 2}+\frac{1}{2}z_{2}^{2})dz^{\prime } \\&=&w\sigma _{1}^{2}(1-\rho _{12}^{2})c_{2}\int_{(y_{2,q}-\mu _{2}-\gamma_{2}w)/(\sqrt{w}\sigma _{2})}^{\infty }dz_{2}\int_{-\infty }^{\infty}z^{\prime 2}g_{2}(\frac{1}{2}z^{\prime 2}+\frac{1}{2}z_{2}^{2})dz^{\prime }\\&&+\; w\sigma _{1}^{2}c_{2}\rho _{12}^{2}\int_{(y_{2,q}-\mu _{2}-\gamma _{2}w)/(\sqrt{w}\sigma _{2})}^{\infty }z_{2}^{2}dz_{2}\int_{-\infty }^{\infty }g_{2}(\frac{1}{2}z^{\prime 2}+\frac{1}{2}z_{2}^{2})dz^{\prime }.\end{eqnarray*}
We take into account that
 \begin{equation*}\int_{-\infty }^{\infty }z^{\prime }g_{2}(\frac{1}{2}z^{\prime 2}+\frac{1}{2}z_{2}^{2})dz^{\prime }=0\end{equation*}
as an integral of odd function on symmetric (around the origin) interval. Using a tail function of bivariate elliptical distribution defined as:
 \begin{equation*}\bar{G}_{2}(z)=c_{2}\int_{z}^{\infty }g_{2}(u)du,\end{equation*}
we can write
 \begin{eqnarray*}c_{2}\int_{-\infty }^{\infty }z^{\prime 2}g_{2}(\frac{1}{2}z^{\prime 2}+\frac{1}{2}z_{2}^{2})dz^{\prime } &=&-\int_{-\infty }^{\infty }z^{\prime }d\bar{G}_{2}(\frac{z^{\prime 2}}{2}+\frac{1}{2}z_{2}^{2}) \\&=&-z^{\prime }d\bar{G}_{2}(\frac{z^{\prime 2}}{2}+\frac{1}{2}z_{2}^{2})|_{z^{\prime }=-\infty }^{z^{\prime }=\infty }+\int_{-\infty}^{\infty }\bar{G}_{2}(\frac{1}{2}z^{\prime 2}+\frac{1}{2}z_{2}^{2})dz^{\prime }.\end{eqnarray*}
Using Lemma 1 from Furman and Landsman (Reference Furman and Landsman2006), we can write
 \begin{equation*}\int_{-\infty }^{\infty }G_{2}(\frac{1}{2}z^{\prime 2}+\frac{1}{2}z_{2}^{2})dz^{\prime }=\bar{G}_{1}(\frac{1}{2}z^{2}).\end{equation*}
Then,
 \begin{equation*}c_{2}\int_{-\infty }^{\infty }z^{\prime 2}g_{2}(\frac{1}{2}z^{\prime 2}+\frac{1}{2}z_{2}^{2})dz^{\prime }=\bar{G}_{1}(\frac{1}{2}z_{2}^{2}).\end{equation*}
By the same principle, we obtain
 \begin{equation*}c_{2}z_{2}^{2}dz_{2}\int_{-\infty }^{\infty }g_{2}(\frac{1}{2}z^{\prime 2}+\frac{1}{2}z_{2}^{2})dz^{\prime }=c_{1}z_{2}^{2}g_{1}(\frac{1}{2}z_{2}^{2})dz_{2}.\end{equation*}
Hence, it follows that
 \begin{eqnarray*}I_{3} &=&w\sigma _{1}^{2}(1-\rho _{12}^{2})\int_{(y_{2,q}-\mu _{2}-\gamma_{2}w)/(\sqrt{w}\sigma _{2})}^{\infty }\bar{G}_{1}(\frac{1}{2}z_{2}^{2})dz_{2} \\&&+ \ w\sigma _{1}^{2}\rho _{12}^{2}c_{1}\int_{(y_{2,q}-\mu _{2}-\gamma _{2}w)/(\sqrt{w}\sigma _{2})}^{\infty }z_{2}^{2}g_{1}(\frac{1}{2}z_{2}^{2})dz_{2} \\&=&w\sigma _{1}^{2}(1-\rho _{12}^{2})\sigma _{Z}^{2}\bar{F}_{Z^{\ast }}(\frac{(y_{2,q}-\mu _{2}-\gamma _{2}w)}{\sqrt{w}\sigma _{2}}) \\&&+\ w\sigma _{1}^{2}\rho _{12}^{2}\frac{(y_{2,q}-\mu _{2}-\gamma _{2}w)}{\sqrt{w}\sigma _{2}}\sigma _{Z}^{2}f_{Z^{\ast }}(\frac{(y_{2,q}-\mu_{2}-\gamma _{2}w)}{\sqrt{w}\sigma _{2}}) \\&&+\ w\sigma _{1}^{2}\rho _{12}^{2}\sigma _{Z}^{2}\bar{F}_{Z^{\ast }}(\frac{(y_{2,q}-\mu _{2}-\gamma _{2}w)}{\sqrt{w}\sigma _{2}}) \\&=&w\sigma _{1}^{2}\sigma _{Z}^{2}\left[ \bar{F}_{Z^{\ast }}(\frac{(y_{2,q}-\mu _{2}-\gamma _{2}w)}{\sqrt{w}\sigma _{2}})+\rho _{12}^{2}\frac{(y_{2,q}-\mu _{2}-\gamma _{2}w)}{\sqrt{w}\sigma _{2}}f_{Z^{\ast }}(\frac{(y_{2,q}-\mu _{2}-\gamma _{2}w)}{\sqrt{w}\sigma _{2}})\right] .\end{eqnarray*}
Now, combining
 $I_{2}$
and
 $I_{3}$
we can write
 \begin{eqnarray}\tilde{I}_{w} &=&(\mu _{1}+\gamma _{1}w)^{2}\bar{F}_{Z}((y_{2,q}-\mu_{2}-\gamma _{2}w)/(\sqrt{w}\sigma _{2})) \notag \\&& +\ 2(\mu _{1}+\gamma _{1}w)\sqrt{w}\sigma _{1}\rho _{12}\sigma_{Z}^{2}f_{Z^{\ast }}(\frac{y_{2,q}-\mu _{2}-\gamma _{2}w}{\sqrt{w}\sigma_{2}}) \notag \\&&+\ w\sigma _{1}^{2}\sigma _{Z}^{2}\left[ \bar{F}_{Z^{\ast }}(\frac{(y_{2,q}-\mu _{2}-\gamma _{2}w)}{\sqrt{w}\sigma _{2}})+\rho _{12}^{2}\frac{(y_{2,q}-\mu _{2}-\gamma _{2}w)}{\sqrt{w}\sigma _{2}}f_{Z^{\ast }}(\frac{(y_{2,q}-\mu _{2}-\gamma _{2}w)}{\sqrt{w}\sigma _{2}})\right]. \notag \\&& \end{eqnarray}
Substituting Equation (A19) into Equation (A18), we obtain
 \begin{equation*}(1-q)E(Y_{1}^{2}|Y_{2}\unicode{x003E} y_{2,q})=(1-q)\int_{0}^{\infty }\tilde{I}_{w}f_{l,\lambda, \chi, \psi }(w)dw.\end{equation*}
We can further write
 \begin{eqnarray}(1-q)E(Y_{1}^{2}|Y_{2} &\unicode{x003E} &y_{2,q})=\int_{0}^{\infty }(\mu _{1}+\gamma_{1}w)^{2}\bar{F}_{Z}((y_{2,q}-\mu _{2}-\gamma _{2}w)/(\sqrt{w}\sigma_{2}))f_{l,\lambda, \chi, \psi }(w)dw \notag \\&&+ \ 2\int_{0}^{\infty }(\mu _{1}+\gamma _{1}w)\sqrt{w}\sigma _{1}\rho_{12}\sigma _{Z}^{2}f_{Z^{\ast }}(\frac{y_{2,q}-\mu _{2}-\gamma _{2}w}{\sqrt{w}\sigma _{2}})f_{l,\lambda, \chi, \psi }(w)dw \notag \\&&+\int_{0}^{\infty }w\sigma _{1}^{2}\sigma _{Z}^{2}\left[\begin{array}{c}\bar{F}_{Z^{\ast }}(\frac{(y_{2,q}-\mu _{2}-\gamma _{2}w)}{\sqrt{w}\sigma_{2}}) \\+\rho _{12}^{2}\frac{(y_{2,q}-\mu _{2}-\gamma _{2}w)}{\sqrt{w}\sigma _{2}}f_{Z^{\ast }}(\frac{(y_{2,q}-\mu _{2}-\gamma _{2}w)}{\sqrt{w}\sigma _{2}})\end{array}\right] f_{l,\lambda, \chi, \psi }(w)dw \notag \\&=&A_{1}+2A_{2}+A_{3}. \end{eqnarray}
Then,
 \begin{eqnarray*}A_{1} &=&\mu _{1}^{2}\int_{0}^{\infty }\bar{F}_{Z}((y_{2,q}-\mu _{2}-\gamma_{2}w)/(\sqrt{w}\sigma _{2}))f_{l,\lambda, \chi, \psi }(w)dw \\&&+\ 2\mu _{1}\gamma _{1}\int_{0}^{\infty }w\bar{F}_{Z}((y_{2,q}-\mu_{2}-\gamma _{2}w)/(\sqrt{w}\sigma _{2}))f_{l,\lambda, \chi, \psi }(w)dw \\&&+\ \gamma _{1}^{2}\int_{0}^{\infty }w^{2}\bar{F}_{Z}((y_{2,q}-\mu_{2}-\gamma _{2}w)/(\sqrt{w}\sigma _{2}))f_{l,\lambda, \chi, \psi }(w)dw \\&=&(1-q)\mu _{1}^{2}+2\mu _{1}\gamma _{1}k_{\lambda, \tilde{\lambda}}\int_{0}^{\infty }\bar{F}_{Z}((y_{2,q}-\mu _{2}-\gamma _{2}w)/(\sqrt{w}\sigma _{2}))f_{l,\tilde{\lambda},\chi, \psi }(w)dw \\&&+\ \gamma _{1}^{2}k_{\lambda, \tilde{\lambda}_{4}}\int_{0}^{\infty }\bar{F}_{Z}((y_{2,q}-\mu _{2}-\gamma _{2}w)/(\sqrt{w}\sigma _{2}))f_{l,\tilde{\lambda}_{4},\chi, \psi }(w)dw,\end{eqnarray*}
where we recall that
 $W^{1/l}\sim GIG(\lambda, \chi, \psi )$
and the density
 $f_{l,\lambda, \chi, \psi }(w)$
has a form in Equation (2.4). Thus,
 \begin{eqnarray}A_{1} &=&(1-q)\mu _{1}^{2}+2\mu _{1}\gamma _{1}k_{\lambda, \tilde{\lambda}_{2}}\bar{F}_{GHE,1}(y_{2,q};\ \mu _{2},\sigma _{2}^{2},g,\gamma _{2},l,\tilde{\lambda}_{2},\chi, \psi ) \\&&+\ \gamma _{1}^{2}k_{\lambda, \tilde{\lambda}_{4}}\bar{F}_{GHE,1}(y_{2,q};\ \mu _{2},\sigma _{2}^{2},g,\gamma _{2},l,\tilde{\lambda}_{4},\chi, \psi );\notag\end{eqnarray}
 \begin{eqnarray}A_{2} &=&\int_{0}^{\infty }(\mu _{1}+\gamma _{1}w)\sqrt{w}\sigma _{1}\rho_{12}\sigma _{Z}^{2}f_{Z^{\ast }}(\frac{y_{2,q}-\mu _{2}-\gamma _{2}w}{\sqrt{w}\sigma _{2}})f_{l,\lambda, \chi, \psi }(w)dw \notag \\&=&\mu _{1}\sigma _{1}\rho _{12}\sigma _{Z}^{2}\int_{0}^{\infty }\sqrt{w}f_{Z^{\ast }}(\frac{y_{2,q}-\mu _{2}-\gamma _{2}w}{\sqrt{w}\sigma _{2}})f_{l,\lambda, \chi, \psi }(w)dw \notag \\&&+\ \gamma _{1}\sigma _{1}\rho _{12}\sigma _{Z}^{2}\int_{0}^{\infty}w^{3/2}f_{Z^{\ast }}(\frac{y_{2,q}-\mu _{2}-\gamma _{2}w}{\sqrt{w}\sigma_{2}})f_{l,\lambda, \chi, \psi }(w)dw \notag \\&=&\mu _{1}\sigma _{1}\sigma _{2}\rho _{12}\sigma _{Z}^{2}\int_{0}^{\infty }w\frac{1}{\sqrt{w}\sigma _{2}}f_{Z^{\ast }}(\frac{y_{2,q}-\mu _{2}-\gamma_{2}w}{\sqrt{w}\sigma _{2}})f_{l,\lambda, \chi, \psi }(w)dw \notag \\&&+\ \gamma _{1}\sigma _{1}\sigma _{2}\rho _{12}\sigma_{Z}^{2}\int_{0}^{\infty }w^{5/2}\frac{1}{\sqrt{w}\sigma _{2}}f_{Z^{\ast }}(\frac{y_{2,q}-\mu _{2}-\gamma _{2}w}{\sqrt{w}\sigma _{2}})f_{l,\lambda, \chi,\psi }(w)dw \notag \\&=&\mu _{1}\sigma _{1}\sigma _{2}\rho _{12}\sigma _{Z}^{2}k_{\lambda, \tilde{\lambda}_{2}}f_{GHE,1}(y_{2,q},\mu _{2},\sigma _{2}^{2},G,\gamma _{2},l,\tilde{\lambda}_{2},\chi, \psi ) \notag \\&&+\ \gamma _{1}\sigma _{1}\sigma _{2}\rho _{12}\sigma _{Z}^{2}k_{\lambda, \tilde{\lambda}_{5}}f_{GHE,1}(y_{2,q},\mu _{2},\sigma _{2}^{2},G,\gamma_{2},l,\tilde{\lambda}_{5},\chi, \psi ), \end{eqnarray}
where we recall that
 $\tilde{\lambda}_{j}=\lambda +\frac{jl}{2}$
for
 $j=1,2,3,4,5.$
At last, we obtain
 \begin{eqnarray}A_{3} &=&\int_{0}^{\infty }w\sigma _{1}^{2}\sigma _{Z}^{2}\left[\begin{array}{c}\bar{F}_{Z^{\ast }}(\frac{(y_{2,q}-\mu _{2}-\gamma _{2}w)}{\sqrt{w}\sigma_{2}}) \\+\rho _{12}^{2}\frac{(y_{2,q}-\mu _{2}-\gamma _{2}w)}{\sqrt{w}\sigma _{2}}f_{Z^{\ast }}(\frac{(y_{2,q}-\mu _{2}-\gamma _{2}w)}{\sqrt{w}\sigma _{2}})\end{array}\right] f_{l,\lambda, \chi, \psi }(w)dw \notag \\&=&\sigma _{1}^{2}\sigma _{Z}^{2}k_{\lambda, \tilde{\lambda}_{2}}\bar{F}_{GHE,1}(y_{2,q};\ \mu _{2},\sigma _{2}^{2},G,\gamma _{2},l,\tilde{\lambda}_{2},\chi, \psi ) \notag \\&&+\ \sigma _{1}^{2}\sigma _{Z}^{2}\rho _{12}^{2}\int_{0}^{\infty }w\frac{(y_{2,q}-\mu _{2}-\gamma _{2}w)}{\sqrt{w}\sigma _{2}}f_{Z^{\ast }}(\frac{(y_{2,q}-\mu _{2}-\gamma _{2}w)}{\sqrt{w}\sigma _{2}})f_{l,\lambda, \chi,\psi }(w)dw \notag \\&=&\sigma _{1}^{2}\sigma _{2}\sigma _{Z}^{2}k_{\lambda, \tilde{\lambda}_{2}}F_{GHE,1}(y_{2,q};\ \mu _{2},\sigma _{2}^{2},G,\gamma _{2},l,\tilde{\lambda}_{2},\chi, \psi ) \notag \\&&+\ \sigma _{1}^{2}\sigma _{2}\sigma _{Z}^{2}\rho _{12}^{2}[\frac{(y_{2,q}-\mu _{2})}{\sigma _{2}}[\int_{0}^{\infty }w\frac{1}{\sqrt{w}\sigma_{2}}f_{Z^{\ast }}(\frac{(y_{2,q}-\mu _{2}-\gamma _{2}w)}{\sqrt{w}\sigma _{2}})f_{l,\lambda, \chi, \psi }(w)dw \notag \\&&-\ \gamma _{2}\int_{0}^{\infty }w^{2}\frac{1}{\sqrt{w}\sigma _{2}}f_{Z^{\ast}}(\frac{(y_{2,q}-\mu _{2}-\gamma _{2}w)}{\sqrt{w}\sigma _{2}})f_{l,\lambda,\chi, \psi }(w)dw] \notag \\&=&\sigma _{1}^{2}\sigma _{Z}^{2}k_{\lambda, \tilde{\lambda}_{2}}\bar{F}_{GHE,1}(y_{2,q};\ \mu _{2},\sigma _{2}^{2},G,\gamma _{2},l,\tilde{\lambda}_{2},\chi, \psi ) \notag \\&&+\ \sigma _{1}^{2}\sigma _{2}\sigma _{Z}^{2}\rho _{12}^{2}\frac{(y_{2,q}-\mu_{2})}{\sigma _{2}}k_{\lambda, \tilde{\lambda}_{2}}f_{GHE,1}(y_{2,q};\ \mu_{2},\sigma _{2}^{2},G,\gamma _{2},l,\tilde{\lambda}_{2},\chi, \psi ) \notag\\&&-\ \sigma _{1}^{2}\sigma _{Z}^{2}\rho _{12}^{2}\gamma _{2}k_{\lambda, \tilde{\lambda}_{4}}f_{GHE,1}(y_{2,q};\ \mu _{2},\sigma _{2}^{2},G,\gamma _{2},l,\tilde{\lambda}_{4},\chi, \psi ). \end{eqnarray}
Substituting Equations (A21), (A22) and (A23) into Equation (A20), we obtain
 \begin{eqnarray}(1-q)E(Y_{1}^{2}|Y_{2} &\unicode{x003E} &y_{2,q})=(1-q)\mu _{1}^{2}+2\mu _{1}\gamma_{1}k_{\lambda, \tilde{\lambda}_{2}}\bar{F}_{GHE,1}(y_{2,q};\ \mu _{2},\sigma_{2}^{2},g,_{2}\gamma, l,\tilde{\lambda}_{2},\chi, \psi ) \notag \\&&+\ \gamma _{1}^{2}k_{\lambda, \tilde{\lambda}_{4}}\bar{F}_{GHE,1}(y_{2,q};\ \mu _{2},\sigma _{2}^{2},g,\gamma _{2},l,\tilde{\lambda}_{4},\chi, \psi )\notag \\&&+\ 2\mu _{1}\sigma _{1}\sigma _{2}\rho _{12}\sigma _{Z}^{2}k_{\lambda, \tilde{\lambda}_{2}}f_{GHE,1}(y_{2,q},\mu _{2},\sigma _{2}^{2},G,\gamma_{2},l,\tilde{\lambda}_{2},\chi, \psi ) \notag \\&&+\ 2\gamma _{1}\sigma _{1}\sigma _{2}\rho _{12}\sigma _{Z}^{2}k_{\lambda, \tilde{\lambda}_{5}}f_{GHE,1}(y_{2,q},\mu _{2},\sigma _{2}^{2},G,\gamma_{2},l,\tilde{\lambda}_{5},\chi, \psi ) \notag \\&&+\ \sigma _{1}^{2}\sigma _{Z}^{2}k_{\lambda, \tilde{\lambda}_{2}}\bar{F}_{GHE,1}(y_{2,q};\ \mu _{2},\sigma _{2}^{2},G,\gamma _{2},l,\tilde{\lambda}_{2},\chi, \psi ) \notag \\&&+\ \sigma _{1}^{2}\sigma _{2}\sigma _{Z}^{2}\rho _{12}^{2}\frac{(y_{2,q}-\mu_{2})}{\sigma _{2}}k_{\lambda, \tilde{\lambda}_{2}}f_{GHE,1}(y_{2,q};\ \mu_{2},\sigma _{2}^{2},G,\gamma _{2},l,\tilde{\lambda}_{2},\chi, \psi ) \notag\\&&-\ \sigma _{1}^{2}\sigma _{Z}^{2}\rho _{12}^{2}\gamma _{2}k_{\lambda, \tilde{\lambda}_{4}}f_{GHE,1}(y_{2,q};\ \mu _{2},\sigma _{2}^{2},G,\gamma _{2},l,\tilde{\lambda}_{4},\chi, \psi ) .\end{eqnarray}
Then, using Equation (A24) and Lemma 3.1 of Ignatieva and Landsman (Reference Ignatieva and Landsman2021), we can write
 \begin{eqnarray*}E((Y_{1}-TCE(Y_{1}|Y_{2}))^{2}|Y_{2}\unicode{x003E} y_{2,q})=E(Y_{1}^{2}|Y_{2}\unicode{x003E} y_{2,q})-TCE(Y_{1}|Y_{2})^{2}\end{eqnarray*}
and the result in Equation (4.3) of Lemma 4.1 follows, noting that
 $\tilde{\lambda}=\tilde{\lambda}_{2}$
.