Introduction
It has been proposed that a fundamental principle for the understanding of neuronal computations involving sensory data is that they have been shaped on evolutionary and developmental timescales by the regularities in the environment (Attneave, Reference Attneave1954; Barlow, Reference Barlow and Rosenblith1961). Theories of the encoding of natural stimuli based on statistical redundancy reduction have been successful at reproducing a number of properties of neurons in visual cortical areas in humans and animals (for overviews, see Dayan & Abbott, Reference Dayan and Abbott2001; Simoncelli & Olshausen, Reference Simoncelli and Olshausen2001), but the dependence of these statistics on the task have been considered to a much lesser degree. This is surprising, given that the active character of vision has been demonstrated in a variety of tasks and is well established (Ballard, Reference Ballard1991; Ballard et al., Reference Ballard, Hayhoe, Pook and Rao1997; O’Regan & Noe, Reference O’Regan and Noe2001; Findlay & Gilchrist, Reference Findlay and Gilchrist2003). Moreover, there are ample empirical data showing that this active selection process is much less involuntary and reactive as suggested by attentional cueing paradigms, if vision is studied in its ecologically valid context of extended, goal-directed visuomotor behavior (Land & Lee, Reference Land and Lee1994; Ballard et al., Reference Ballard, Hayhoe and Pelz1995; Land & Hayhoe, Reference Land and Hayhoe2001; Hayhoe et al., Reference Hayhoe, Shrivastava, Mruczek and Pelz2003).
This study analyzes how the statistics of image features at the point of gaze for human subjects involved in natural behavior depend on the ongoing task. Although it may seem immediately plausible that the statistics of the sensory input to the visual system are dependent on the ongoing task, this fact has far-reaching consequences. Previously, a variety of visual features and their statistics as measured in natural environments have been related to their neuronal representations, including luminance and contrast (Laughlin, Reference Laughlin1981; Tadmor & Tolhurst, Reference Tadmor and Tolhurst2000; Frazor & Geisler, Reference Frazor and Geisler2006), color (Ruderman et al., Reference Ruderman, Cronin and Chiao1998), and spatial relationships of luminance (Ruderman & Bialek, Reference Ruderman and Bialek1994). Similarly, the hypothesis that neurons have evolved to maximize mutual information between sensory stimuli and their neuronal representations (Bell & Sejnowski, Reference Bell and Sejnowski1997), or to build a sparse code (Olshausen & Field, Reference Olshausen and Field1997), or are encoding a difference signal between higher level predictions and actual input (Rao & Ballard, Reference Rao and Ballard1999) requires that the statistics of this input are well characterized. But learning of such representations has previously used static images and artificially sampled image sequences. It is therefore of interest to determine empirically how these input statistics are influenced by the ongoing task.
A direct consequence of the efficient coding hypothesis is that also the activity of neurons representing visual stimuli shows particular response statistics. Empirical studies have shown to agree with certain theoretical predictions under application of different mathematical constraints on the firing rates of neurons (e.g., Laughlin, Reference Laughlin1981; Ruderman & Bialek, Reference Ruderman and Bialek1994; Baddeley et al., Reference Baddeley, Abbott, Booth, Sengpiel, Freeman, Wakeman and Rolls1997). It has also been established that these response statistics are indeed dependent on the input statistics by demonstrating that the responses of neurons vary considerably between exposure to artificial stimuli such as white noise or gratings on one side and exposure to natural image sequences on the other side (e.g., David et al., Reference David, Vinje and Gallant2004). Theoretical work has also been able to explain certain forms of activity normalization by considering the joint activity of pairs of model simple cells in V1 and their dependencies (Schwartz & Simoncelli, Reference Schwartz and Simoncelli2001). Furthermore, if the efficient coding of natural stimuli has shaped the responses of neurons, the changes in these statistics must have influenced the adaptation processes that adjust the encoding at different timescales (see, e.g., Clifford et al., Reference Clifford, Webster, Stanley, Stocker, Kohn, Sharpee and Schwartz2007), and it becomes important to quantify these changes. Therefore, this study also characterizes the statistics of model simple and complex cells in response to visual input separately for the two tasks of approaching and avoiding objects.
A further motivation for this study comes from a different line of research, which has investigated properties of image regions that are fixated by human subjects in different picture-viewing and search tasks (see, e.g., Mannan et al., Reference Mannan, Ruddock and Wooding1996; Reinagel & Zador, Reference Reinagel and Zador1999; Parkhurst & Niebur, Reference Parkhurst and Niebur2003) under the assumption that certain features somehow attract gaze. Most of these studies have used extensively the notion of “saliency” (Koch & Ullman, Reference Koch and Ullman1985; Itti et al., Reference Itti, Koch and Niebur1998) in order to explain or attempt predicting human gaze selection. This line of research is in some sense antithetic to the one mentioned in the previous paragraphs, as it does not use data on gaze selection to establish more complete models of the statistical properties of the input to the visual system but instead equates the visual system with a linear filter bank followed by some form of competition calculation. This computation is thought to select gaze targets. It is rather surprising that the operational definition of saliency that has been promoted for a decade and is currently dominating the literature is that local image properties such as contrast in feature dimensions of luminosity, edge filter responses, and color attract gaze automatically. This is surprising when one considers the comparison of observing the animal behavior of going to a river in order to drink water. Two possible explanations for the observed behavior could be that the water is attracting the animal and that the animal went to the water because it was thirsty. The current usage of the saliency concept corresponds mostly to the first interpretation and is almost entirely separated from the behavioral goal of gaze within visual behavior (Itti et al., Reference Itti, Koch and Niebur1998). This article provides further experimental evidence and quantifies that the features at fixation location instead are dominated by the ongoing task when studied in their behavioral context.
In contrast, extensive studies have shown that in task-based picture viewing (Yarbus, Reference Yarbus1967; Henderson & Hollingworth, Reference Henderson and Hollingworth1999; Henderson et al., Reference Henderson, Brockmole, Castelhano, Mack, van Gompel, Fischer, Murray and Hill2007) and natural behavior (Land & Lee, Reference Land and Lee1994; Ballard et al., Reference Ballard, Hayhoe and Pelz1995; Johansson et al., Reference Johansson, Westling, Bäckström and Flanagan2001; Land & Hayhoe, Reference Land and Hayhoe2001), regions in the visual scene and visual features are targeted by gaze in dependence of the ongoing task. The research on extended natural tasks has demonstrated that gaze is related to manual interactions with objects, predicted future locations of objects, retrieval of specific object features depending on the sequential order of tasks, and other parameters of the ongoing behavior (see Hayhoe & Ballard, Reference Hayhoe and Ballard2005, for a review). In terms of the analogy given in the previous paragraph, it may be behaviorally relevant to monitor the position of a predator that is moving in an environment for which its natural camouflage is optimized such that gaze is more likely to be directed toward regions that are low in luminance contrast, edge content, and color contrast. The question in this study is how do image statistics of the input to the visual system change due to the task dependence of gaze selection in the extended visuomotor tasks of approaching and avoiding objects during sidewalk navigation?
Given that the visual system actively selects targets in the scene when involved in executing such visuomotor tasks, it is of interest characterizing these features in dependence of the current behavioral goal. Two hypotheses in the Animate vision framework (Ballard, Reference Ballard1991) on how gaze selection is related to the visual computations during navigation are that (1) by directing gaze to specific targets in the environment during motion, visual computations based on the exocentric coordinate system can be done with less precision and (2) simpler control strategies based on servoing relative to the fixation frame can be used. Therefore, characterizing the features at the point of gaze can reveal quantities necessary for the computations pertaining to the visuomotor task that is being solved. This is different from a visual search task in which a static stimulus is displayed on a monitor, and an optimal feature for the detection of a target embedded in a background can be arrived at purely in terms of the image (e.g., Najemnik & Geisler, Reference Najemnik and Geisler2005; Navalpakkam & Itti, Reference Navalpakkam and Itti2007). In the present study, features of the input to the visual system are analyzed in order to establish quantitatively how the task influences gaze targets and to obtain indications about what computations may be executed when humans are allowed to move freely and execute the natural tasks of avoiding and approaching objects.
A further motivation for the following analysis of features at fixation location in dependence of the ongoing task is the observation (Zhu, Reference Zhu2003) that rich vocabularies for features at different hierarchical levels exist, for example, in language, including features such as “phonemes,” “syllables,” “words,” and “sentences,” but that similar vocabularies are sparse for visual features. Visual features of intermediate complexity have been extracted from collections of images for the particular task of object classification and have been shown to be computationally superior to other features in this particular task (Ullman et al., Reference Ullman, Vidal-Naquet and Sali2002), and recent experiments suggest that they can be related to human classification performance and its underlying neural activity (Harel et al., Reference Harel, Ullman, Epshtein and Bentin2007). This article empirically determines features of intermediate complexity that human subjects use for the tasks of approaching and avoiding objects while navigating along a walkway by clustering the feature responses at the point of gaze separately for the individual task conditions.
Materials and methods
Experimental setup
Subjects executed the two task conditions “pickup” and “avoid” while they were immersed in a virtual reality (VR) environment consisting of a cityscape (Performer Town) created by SGI. They wore a Virtual Research V8 binocular head-mounted display (HMD) having a resolution of 640 × 480 pixels corresponding to a horizontal field of view of 52 deg. The helmet also contained monocular eye tracking capability using an Applied Science Laboratory (ASL) 501 video-based eye tracker (Bedford, MA). The eye position was calibrated before each trial using a nine-point calibration target. This frequent calibration was crucial in maintaining accuracy below 1 deg of visual angle. In addition, the rotational and translational degrees of freedom of head movements were monitored with a HiBall-3000 tracker (Sunnyvale, CA). The head tracker had a latency of a few milliseconds so that the frame update in the HMD was between 30 and 50 ms. The scene was rendered using a Silicon Graphics Onyx 2 computer at rates above 60 Hz. The collected data consisted of the position of gaze, the current frame, and the current position and direction of the subject’s head in the virtual world.
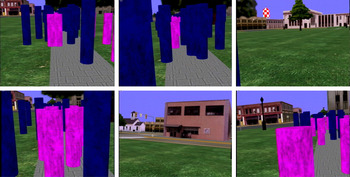
The environment in which subjects were immersed consisted of a linear walkway of length 40 m and width 1.8 m within the cityscape. At the end of this walkway, subjects arrived at a road crossing where the trial ended. A total of 40 purple and 40 blue cylindrical objects were placed along the walkway. These objects were placed randomly according to a uniform distribution that expanded 1.5 m to both sides of the walkway. Purple cylinders were described to the subjects as “litter,” while the blue cylinders were termed “obstacles.” The random positions of the objects were different across the task conditions but the same across subjects; that is, all objects were always at the same position in each of the two conditions across all subjects. The overall duration of a single trial was 93 s on average. Both object types were textured with an image texture sampled from 1/f 2 noise. Fig. 1 shows six representative views from the subject’s perspective during execution of a trial. One problem in this environment was that the linear track of the path in the cityscape was four times longer than the 10 m width of the laboratory. Our solution to this discrepancy was to break up the linear path into five linear tracks of shorter distance. Subjects walked along the walkway until they reached the end of the laboratory. At this point, the display turned black and subjects turned around and continued walking on the walkway while moving in the opposite direction within the laboratory. Subjects were initially given enough practice trials until they were familiar enough with this mapping.
Six representative views of the scene as seen by a subject during execution of the tasks. Subjects navigated along a walkway situated within a cityscape while avoiding blue cylindrical obstacles or approaching purple cylindrical targets.

Subjects were given different verbal instructions for the two experimental conditions in order to change the task priorities of approaching and avoiding objects. In the first condition (pickup), subjects were instructed to pick up the purple litter objects. Picking up was achieved by approaching the litter object, which disappeared when the subject’s body reached a distance of 20 cm. In the second condition (avoid), subjects were instructed to avoid the obstacles. The order in which individual subjects carried out these two tasks was randomized across subjects. All subjects were undergraduates at the University of Texas who were compensated for their participation. Subjects were naive with respect to the purpose of the experiment.
Analysis of experimental data
The goal of the present analysis was to quantify differences in the input to the visual system due to the execution of different visuomotor tasks. The two tasks considered were approaching and avoiding objects while walking along a walkway. The features selected for the following analyses were chosen in order to compare the statistics of visual features with previous research on static natural images. First, the analysis of the image data required building different image sets. The first two image sets were obtained by selecting the image data at the center of gaze for all subjects in the two task conditions pickup and avoid. A third image set was build by selecting the image patches at fixation after shuffling the gaze positions of subjects executing the task of picking up and avoiding. This was done to obtain an image set that corresponds to random locations in the visual scenes but reflects the central bias especially prevalent when subjects are allowed to freely move in the environment. An automated saccade extraction algorithm based on an adaptive velocity threshold was applied to the eye movement record in order to select only those frames during which gaze was relatively stable in the scene. Summary statistics were obtained in order to exclude biases in the analysis due to the usage of artificially rendered images.
The features of luminosity, contrast, and model simple and complex cell responses were calculated for each image patch in the image sets. These features were calculated according to common methods used in image processing and vision science. In the following paragraphs, the details of these calculations are reported together with brief descriptions of the motivations for the choices.
Luminance
The experimental setup was such that subjects wore the head-mounted binocular display in which the virtual scene was shown. The luminance of the display screen was measured using a photometer, and the relationship between pixel values in the image and luminance in units of candelas per square meters was established. After calibration, the luminance was estimated in the displayed scene and was measured in circularly symmetric image patches by using windowing functions of the form:

where r is the radius of the circular region centered around (xi,yi) and values outside the circle of radius r are set to 0. Varying sizes of windowing functions were used with radii of 8, 16, 32, and 64 pixels corresponding to 1.2, 2.4, 4.8, and 9.6 deg of visual angle. This type of windowing function was chosen to facilitate the comparison of image statistics with previous results described by Frazor and Geisler (Reference Frazor and Geisler2006). Luminance was then calculated using this windowing function as the weighted sum:

Contrast
Contrast is regarded as one of the fundamental quantities extracted from the visual environment so that extensive analysis of its statistics in natural images has been done. There are a variety of different definitions of contrast that have been used in the literature in order to quantify the variation in luminance in images. Here, the root mean–squared (RMS) definition of contrast was used and measured in circularly symmetric image patches by applying the above windowing functions according to eqn. (1) in order to compare the results with the study by Frazor and Geisler (Reference Frazor and Geisler2006). Local contrast was then calculated using the average luminance  as defined above in eqn. (2) within the window according to:

Power spectrum
The power spectrum is commonly used to quantify the second-order spatial dependencies between image luminance because it is the squared magnitude of the Fourier transform of the autocorrelation function. But estimating the power spectrum using the periodogram, that is, by computing the modulus squared of the complex-valued discrete Fourier transformed (DFT) signal, gives an inconsistent estimate. Several methods for obtaining a consistent estimate are described in the literature (Stoica & Moses, Reference Stoica and Moses1997), and Bartlett’s method was applied here. This estimation procedure first splits the image into nonoverlapping image segments with spatial dimensions N × N for each of which the periodogram is computed using the DFT:

where the discrete spatial frequencies are fx = ξ/N and fy = η/N, k is an index running over all K image segments, and i is not an index but the imaginary unit, and then the modulus of the complex-valued transform is obtained according to:

Bartlett’s estimate of the power spectrum is then calculated as the average periodogram over all K image segments:
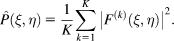
Finally, the rotationally invariant power spectrum estimate was obtained by calculating the average one-dimensional power spectrum at regularly spaced orientations every 15 deg starting at 0 deg.
Multiscale filter responses
Several functional forms for multiscale filter representations of images have been used in the literature, with each set having particular properties distinguishing it from other sets, such as biological plausibility, compactness, steerability, separability, and more. One set with particularly nice computational properties is the set of oriented derivatives of Gaussians (Freeman & Adelson, Reference Freeman and Adelson1991). This set has the advantage of steerability while still resembling the profile of simple cells. Another set of basis functions often used to model simple and complex cell responses encountered in primary visual cortex consists of Gabor functions at multiple orientations and spatial scales. This set has been shown to emerge as the solution to a number of theoretical optimality formulations (Daugman, Reference Daugman1985) and has been often used in the literature in order to asses the distribution of parameters describing simple cells in animals (Ringach, Reference Ringach2002).
In principle, the set of derivatives of Gaussians has a good mixture of properties, but the disadvantage is that it is not straightforward to obtain model complex cell responses using this filter set. In order for a set of filters to be used to obtain monocular energy responses, the two filters used as quadrature pair have to be Hilbert transforms of each other (see, e.g., Mallot, Reference Mallot2000). Unfortunately, there is no closed-form expression for the Hilbert transform of first- and second-order derivatives of Gaussian functions, although numerical approximations can be obtained in the frequency domain. Instead of using these filters, it was decided to use Gabor filters because a pair of filters consisting of an even and an odd Gabor function is a Hilbert transform pair. Accordingly, the set of filter functions for the computation of the model simple and complex cell responses was obtained as:


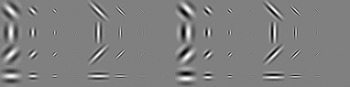
where σx and σy are parameters regulating the width of the spatial windowing function and ω determines the spatial frequency of the sinusoid. The size of the windowing function was chosen to be σx = 3/ω and either σy = 3/ω or σy = 5/ω, which is in accordance with commonly used parameters based on neurophysiological data of spatial frequency selectivity of neurons in macaque visual cortex (e.g., Lippert & Wagner, Reference Lippert and Wagner2002). The four levels of spatial frequencies of the sinusoids were 0.4, 0.8, 1.6, and 3.3 cycles/deg. The above functions were calculated at four different orientations by rotating the coordinate systems about the angle θ ∈ {−π/4, 0, π/4, π/2} according to:


The resulting set of multiscale Gabor functions is shown in Fig. 2.
The set of Gabor functions used in encoding the image. Left: The normalized even Gabor functions used for calculating the model receptive filed responses at different spatial scales and orientations. Right: The set of corresponding normalized odd-symmetric Gabor functions.

Results
First, it is necessary to compare the properties of the image set corresponding to the views of subjects during task execution in the virtual environment to the properties of images obtained in natural environments. This comparison is necessary to confirm the validity of the results of the following analyses and to avoid biases that may be due to the virtual environment, the textures applied to the objects therein, and the rendering of the scenes. As no full statistical description of natural images is available, summary statistics of subsets of images from within the virtual environment are obtained and compared to known properties of natural image ensembles.
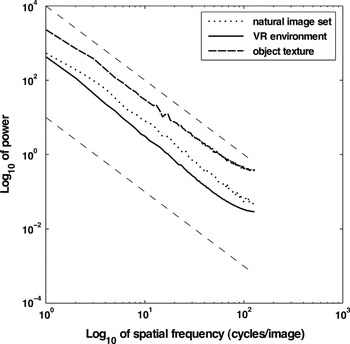
The second-order statistics of natural images can be characterized by the power spectrum of the spatial luminance function. It is well known that the power spectrum for large ensembles of different natural images demonstrates scale invariance by following a 1/fα envelope, where α is close to 2 (Ruderman & Bialek, Reference Ruderman and Bialek1994). Different natural as well as man-made environments have been shown to follow such power laws, with small variations in the exponent around 2 (e.g., Balboa & Grzywacz, Reference Balboa and Grzywacz2003). For the virtual environment, a set of 50 images is selected randomly from different subjects at different locations along the entire walkway. This set contains typical views of a subject, a subset of which is shown in Fig. 1. The resulting rotational average of each power spectrum estimate obtained using Bartlett’s method for these scenes, the individual textures on the objects placed on the walkway, and a set of natural images are shown in Fig. 3. The plot demonstrates that the second-order statistics of the views in the virtual environment are close to those reported for natural image sets.
Log–log plot of the rotational averages of the estimated power spectra for different image sets. The curves correspond to the slope of the rotational average of the power spectra as estimated using Bartlett’s method for a set of natural images, the object texture in the VR experiments, and multiple views from the subjects perspective in the VR experiments. Slopes of −2 corresponding to 1/f 2 envelopes are shown as dashed lines.

It is furthermore well known that natural images contain statistical regularities that go beyond second order. Although there are no models describing these higher moments such as the skewness or kurtosis in a general form, one common observation is that histograms of responses to local edge filters have highly kurtotic distributions (e.g., Field, Reference Field1987; Simoncelli & Olshausen, Reference Simoncelli and Olshausen2001). If the natural image statistics were only of second order, they would follow Gaussian distributions and therefore all marginal distributions would also be Gaussian. Therefore, the kurtotic distributions are further evidence for the higher order dependencies. Here, the histograms of the responses of the filters defined in eqn. (8) are obtained, and the histograms for the subset corresponding to the odd filters with spatial frequencies of 1.6 cycles/deg shown in the sixth column of Fig. 2 are shown in Fig. 4. These histograms demonstrate the familiar kurtotic distributions known from natural image sets. Thus, these analyses suggest that the images statistics obtained in the virtual environment correspond well to those reported for natural image sets.
Example average histograms of filter responses for a subset of the Gabor filters. The histograms are calculated for the filter responses to odd Gabors with spatial frequency of 1.6 cycles/deg on the set of 50 images obtained from the view of subjects walking down the walkway in the virtual environment.

Contrast statistics at point of gaze
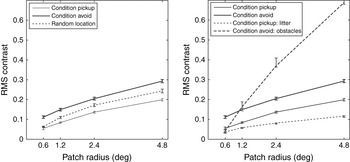
Previous work on the distribution of contrast in natural images has investigated how contrast statistics depend on the size of the area over which they are calculated for different environments and different object classes such as foliage and backlit areas (Frazor & Geisler, Reference Frazor and Geisler2006). While these results have been obtained by randomly sampling from static natural images, other investigations have measured contrast statistics at fixation location during inspection of static natural images (Reinagel & Zador, Reference Reinagel and Zador1999). Here, the same statistics as in Frazor and Geisler (Reference Frazor and Geisler2006) are measured but separately for the two task conditions of approaching and avoiding objects in the walkway tasks. Furthermore, this analysis is repeated separately for gaze falling on litter in the pickup condition and gaze falling on obstacles in the avoid condition. The respective plots of the contrast for the different image ensembles are shown in Fig. 5.
RMS contrast as function of image patch size for different image ensembles and tasks. Left: Comparison of contrasts between image sets at the point of gaze for the conditions pickup and avoid and at random locations. Right: Comparison of contrasts as a function of patch size for the avoid and pickup conditions as in the left plot. Additionally, for the contrast for gaze falling on the litter objects is plotted for the pickup condition, and the contrast for gaze falling on the obstacles is plotted for the avoid condition.

The mean contrast level for the set of images obtained in VR is lower than that obtained in natural environments (Frazor & Geisler, Reference Frazor and Geisler2006). This is to be expected, given that the contrast in HMDs as the one used in this study is smaller than the contrast in natural outdoor scenes that can be recorded with cameras such as the one used in the original study by van Hateren and van der Schaaf (Reference van Hateren and van der Schaaf1998). Moreover, the scenes in VR are rendered with omnidirectional diffuse lighting so that no hard shadows are present in the image set.
Nevertheless, the overall pattern of an increase in contrast with patch size observed here is analogous to previous results (Frazor & Geisler, Reference Frazor and Geisler2006), again reflecting the spatial dependence of luminance correlations present in natural scenes. Local contrast is between 0.08 and 0.13 for patch sizes of 1.2 deg radius while a previous study found a contrast of 0.3 for images of ground areas of the same size (Frazor & Geisler, Reference Frazor and Geisler2006). By comparison, the corresponding plots for the task pickup demonstrate a mostly shifted version of this trace toward lower contrasts compared to randomly shuffled gaze targets, while the curve for the avoid condition is shifted toward higher contrasts. Note that these are the results of averaging over the entire task duration for the respective conditions, that is, these curves reflect the average contrast resulting from gaze being directed to all object classes during all trials of each condition for all subjects. Note also the very small standard errors of the contrast measurements, as shown in Fig. 5. The significance of these results is further confirmed by a two-way analysis of variance (ANOVA) with repeated measures on contrast level for aperture size and image set. Aperture size (F = 170.76, P < 0.001) and image set (F = 58.09, P < 0.001) are significantly different, whereas the interaction was not (F = 2.03, P > 0.07).
The common finding in all studies that have investigated the contrast at fixation locations versus randomly chosen locations is that contrast is significantly higher at the locations targeted by gaze (Mannan et al., Reference Mannan, Ruddock and Wooding1996; Reinagel & Zador, Reference Reinagel and Zador1999; Parkhurst & Niebur, Reference Parkhurst and Niebur2003; Itti, Reference Itti2005). In contradiction to those studies that used free-view tasks or variations of search tasks, the results presented here show that contrast can be reduced at fixation location, if required by a task such as navigating toward objects. Furthermore, the mentioned studies typically investigated only the first dozen or so fixations (Mannan et al., Reference Mannan, Ruddock and Wooding1996; Reinagel & Zador, Reference Reinagel and Zador1999; Parkhurst & Niebur, Reference Parkhurst and Niebur2003), whereas here fixations are considered over minutes. Indeed, gaze is mostly distributed between the targets, the obstacles, and the walkway, while the regions of highest contrast are located in the background. This is also demonstrated in the section “Relating the feature statistics to the gaze targets.”
In order to further investigate the source of this variation, the RMS contrast is separately calculated for gaze directed to litter in the pickup condition and to obstacles in the avoid condition. In order to obtain these average contrasts, a criterion has to be applied to the gaze data for classifying a fixation as being directed toward either object class. The selection of this criterion has to take into account that the eye tracker is calibrated for each trial so that the positional error is held below 1 deg of visual angle. The criterion chosen is to classify gaze to be directed toward litter or an obstacle if the area within 1 deg of the fixation location reported by the eye tracker is entirely on one of the object classes. Note that this is a very conservative criterion that excludes many frames during which subjects direct their gaze directly to the edge of an object. This tends to underestimate the contrast especially for small windowing functions. Nevertheless, this criterion is necessary to exclude the confounds resulting from gaze being directed to edges between litter and obstacles.
The contrast for these image sets is shown in Fig. 5. These graphs demonstrate that contrast at fixation location is even lower when gaze is directed to litter in the pickup condition and further elevated when directed to obstacles in the avoid condition. This result demonstrates that gaze is directed toward different regions on the objects depending on the ongoing task, thereby changing the image statistics of the input to the visual system over minutes.
Model simple cell response statistics at point of gaze
According to theories of optimal coding, neuronal activities are optimized to the statistics of their input, resulting in characteristic response statistics. Furthermore, adaptation processes are thought to maintain these response statistics in dependence of changes to the inputs. The higher order statistical dependencies in natural images have been quantified through response distributions to linear filters similar to those found in primary visual cortices of the mammalian brain (e.g., Field, Reference Field1987; Simoncelli & Olshausen, Reference Simoncelli and Olshausen2001). While differences in kurtosis may depend on the type of image region and have been used to analyze and synthesize different texture pattern, the question here is whether there are significant differences in these response statistics over extended periods of time due to the execution of tasks.
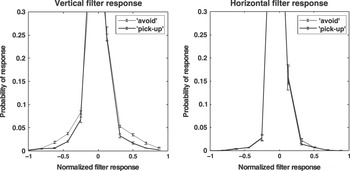
Fig. 6 shows the histograms of the model simple cell responses collected across subjects separately for the tasks pickup and avoid. The histograms depicted are for two filters only, where the left image is for the vertically aligned Gabor function of highest spatial frequency and the right histogram is for the horizontally aligned Gabor of highest spatial frequency. These graphs demonstrate that the responses for the vertical filter are significantly higher in the pickup condition, while differences are not significantly different between the two tasks for the horizontal filter. Although the differences between histograms may seem small, note that the probability of a normalized filter response of 0.3 or higher for the vertical Gabor was twice as high in the pickup condition compared to the avoid condition. The small standard errors over the means in the histograms also demonstrate the significance of this result.
Histograms of model simple cell responses. Left: Normalized responses to vertical Gabor filter for the pickup and avoid conditions. Right: Normalized responses to horizontal Gabor filter for the pickup and avoid conditions. The error bars correspond to the standard errors around the means.

Model complex cell response statistics at point of gaze
While significant differences are already visible for the simple and complex cell responses, it is more natural to ask whether significant differences are observable for model complex cell responses, where here monocular energy is computed. The main characteristic of these filters is that they have phase-invariant responses to edges, that is, the model energy cell responds to edges in its entire field and the response will depend less on the polarity of the visual stimulus. Given that the task requires subjects to navigate the environment containing the litter and obstacles, it is expected that these responses are more relevant to the task and that therefore significant differences in these responses should be observable across task conditions.
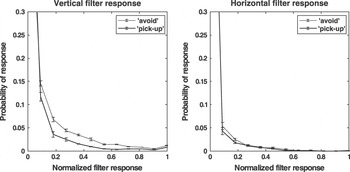
Indeed, Fig. 7 shows the responses to a horizontal and a vertical set of model energy neurons separately for the image sets at the point of gaze for the tasks pickup and avoid. The parameters for the component cells are the same as those for the previously used model simple cells. The histograms again demonstrate that significant differences in responses between the two orientations can be found over a timescale of tens of seconds. These differences reflect the fact that gaze is more likely to fall on edges in the avoid condition compared to the pickup condition.
Histograms of model complex cell responses. Left: Normalized responses of vertical model complex cell to image patches at fixation location for the pickup and avoid conditions. Right: Normalized responses of horizontal model complex cell to image patches at fixation location for the pickup and avoid conditions. The error bars correspond to the standard errors around the means.

Extraction of intermediate features
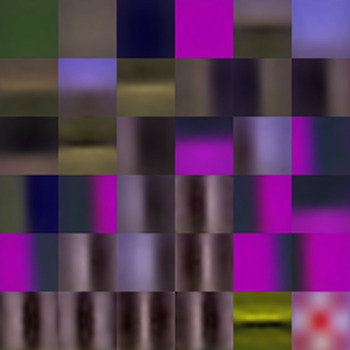
The above results demonstrate that the statistics of model simple cell responses are different depending on the ongoing task. Here, the question is investigated as to what type of intermediate features is used by the visual system during the navigation tasks. These features of intermediate complexity correspond to activity patterns of the model simple cells. Previously, such features have been analyzed in the setting of object recognition and classification (Ullman et al., Reference Ullman, Vidal-Naquet and Sali2002). There are a variety of methods that can be used to extract such intermediate-level features. Instead of using a complex generative model describing occlusion of the objects in the current scenes, the k-nearest neighbors clustering is used to extract 36 clusters of feature vectors from the set of 50 images obtained along the entire walkway path. The found clusters are shown in Fig. 8. These image patches can be thought of as a small set of image features that can be used to reconstruct all the images that subjects encounter along the walkway.
The set of 36 cluster centers obtained from the image representation using the Gabor filters. These image patches are obtained by reprojecting the model simple cell responses at the center of the 36 clusters back into image space. These patches can be regarded as a set of features that can be utilized in representing the vast majority of image patches in the scenes of the visual world of the experiment. The patches are sorted in descending order of their relative frequency in all considered scenes from the top left corner to the bottom right corner.

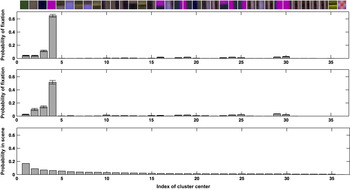
The interesting question here is how subjects distribute their gaze among these different intermediate features during execution of the two task conditions pickup and avoid. In order to answer this question, the patches at fixation location across all subjects and tasks are obtained, and each feature vector representing the fixation patch is assigned to the one cluster out of 36 with the smallest Euclidean distance. The resulting histograms are shown in Fig. 9. Additionally, a third histogram shows the relative frequency of each feature in the entire set of images of scenes from the view of individual subjects.
The set of 36 cluster centers obtained from the image representation using the derivative of Gaussian filters and their relative frequencies. Top: The found clusters sorted from the highest frequency within the scenes on the left to the lowest frequency on the right. Top histogram: The relative frequency of gaze being directed to the 36 features in the pickup condition. Middle histogram: The relative frequency of gaze being directed to the 36 features in the avoid condition. Bottom histogram: The relative frequency of the 36 features in the scenes.

The histograms together with the cluster centers demonstrate that the vast majority of fixations is directed toward image locations that are well represented by clusters 2, 3, and 4, which represent the solid gray, blue, and purple areas, respectively. While the most often encountered image feature is the solid green patch corresponding to the lawn areas, it is fixated by subjects less than 4% of the time. The likelihood of a fixation being on image regions closest to these three clusters is almost P = 0.80. This shows the remarkable selectivity of gaze during task execution. Closer examination of these histograms shows that in the avoid condition, subjects are twice as likely (P = 0.21 vs. P = 0.10) to fixate an image region that is best characterized by cluster centers 10–13, 15, and 20, which all contain a blue edge within the patch area. The statistical significance is assessed by testing for a difference in the mean of the grouped occurrences of the above clusters between the conditions avoid and pickup because a series of individual comparisons may result in an overestimation of significant differences. The two-way ANOVA with repeated measures is significant both with Bonferroni correction (F = 10.12, P < 0.001) and with Scheffe’s procedure. Thus, in accordance to the results in the previous sections, subjects’ gaze is more likely to be directed to homogeneous regions of the litter objects during pickup and to edges of obstacles in the avoid condition.
Relating the feature statistics to the gaze targets
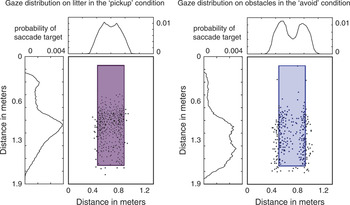
The above analyses demonstrate that the statistics of image features at the point of gaze are significantly different depending on the ongoing visuomotor task. What these analyses do not reveal is how such differences come about. In order to establish the difference in gaze allocation between tasks that are the cause of these differences, the landing position of the first saccade executed toward obstacles and targets can be marked on these objects, respectively, for the different tasks. The distribution of fixation targets relative to the objects is obtained by averaging across subjects. The colored bars in Fig. 10 show the results for a single subject. The saccade target patterns suggest that this subject is more likely to target the edge of the obstacles, while the center of the litter objects are more likely to be targeted in the pickup condition. The marginal distributions are obtained by normalizing the target distribution of all subjects after convolution with a Gaussian kernel of standard deviation of 0.5 deg, which reflects the uncertainty in the position of the eye tracking measurement.
Horizontal and vertical marginal distributions of gaze targets on litter objects in the pickup condition (left) and on obstacles in the avoid condition (right). These distributions are obtained using data from all 19 subjects. The plots with targets marked on the objects are obtained from the data of subject MB and are representative of the entire data set.

The distributions of gaze targets across subjects demonstrate that subjects are indeed more likely targeting the edges of the obstacles when avoiding them versus looking at the centers of the targets when approaching them. The differences in the observed statistics of image features such as contrast and model simple and complex cell responses can therefore be attributed to the differences in gaze targets used by the subjects in the different visuomotor tasks. This result agrees with a strategy in which subjects approach an object by servoing toward its center and maintain fixation on the center of the target object. By contrast, when avoiding objects, subjects direct gaze toward the edge of that object and not toward the center, presumably to aid in finding a trajectory around the edge of that object.
Discussion
If cortical representations of sensory information are shaped by the regularities of their input, it is necessary to characterize the structure of this input. These regularities not only are due to the structure of the environment but also depend on the regularities in the active selection process by the visual system. Therefore, the input to the visual system needs to be characterized in dependence of the executed eye and body movements, which in turn depend on the ongoing task. Previously, regularities due to the structure of the environment as seen in natural images have been considered, but it is not well established, to what degree they are affected by natural task–based vision. Furthermore, adaptation processes that operate on different timescales and adjust the output statistics of neuronal activity in dependence of the statistics of the stimulus input have to deal with the changes in the input that are due to task effects. The present study analyzes and quantifies the influence of this active selection process in obstacle avoidance and target approach during sidewalk navigation in a virtual environment. The features considered are contrast, model simple and complex cell responses, and features of intermediate complexity, which are all known to be relevant carriers of information about the visual world.
Contrast statistics
It is first demonstrated that the properties of the visual scenes in the virtual environment are comparable to those of natural images as suggested by the estimated power spectrum and the statistics of edge filter responses. Luminance and RMS contrast obtained in the virtual environment are on average lower to those encountered in natural images over several aperture sizes as reported in Frazor and Geisler (Reference Frazor and Geisler2006) because of the utilized display and the illumination model used in rendering the virtual scenes. However, the relationship between contrast and aperture size over which it is measured is similar to previous studies in which natural image ensembles were used and where contrast increased with an increase of aperture size.
The difference to previous studies is that the analysis is carried out separately depending on subjects’ task priorities while they are engaged in extended visuomotor behavior. This allows analyzing the feature statistics as a function of the task. It is shown that the contrast statistics of RMS contrast are significantly different over timescales of tens of seconds depending on the ongoing task. When subjects approach targets, the average contrast at fixation is reduced significantly compared to random locations, while contrast is elevated when they avoid obstacles. This difference in the contrast statistics is measured over durations of more than a minute. Furthermore, if only fixations directed to the objects most relevant for the respective task are considered, this effect is even more pronounced, with contrast being elevated sixfold at patch sizes of 2.4 deg between gaze directed to obstacles compared to litter. This result demonstrates that the stimulus statistics of RMS contrast reaching the visual system are highly dependent on the ongoing task.
These results also challenge the common notion of saliency as a task-independent visual importance measure that automatically drives the selection process. The hypothesis that contrast or high edge density automatically attracts gaze is not supported by the presented data. When subjects approached objects by walking toward them, contrast at fixation location is reduced significantly compared to when they avoid obstacles. It may very well be that on average, certain features are more informative than others across many tasks and that under unconstrained situations such as free-view tasks, these tend to be fixated more often on average, but during goal-directed visuomotor task execution, gaze is determined by the behavioral goal, which may require fixating regions of high contrast or regions of low contrast.
Model simple and complex cell responses
The typical kurtotic distribution of linear filter responses to natural images has been reported repeatedly (Simoncelli & Olshausen, Reference Simoncelli and Olshausen2001) and is evidence for the non-Gaussianity of the distribution of luminance values in natural images. Here, the responses to model simple cells at multiple orientations and spatial scales are obtained and compared for the two tasks of approaching and avoiding target objects during walking. Significant differences are found for these filter responses over timescales of tens of seconds. When approaching targets by walking toward them, vertical edge filter responses are significantly lower than when avoiding obstacles, while the edge filter responses at horizontal orientations do not show these differences. Similar to the model simple cell responses, the analysis of the complex cell responses shows significant differences between vertical orientations and does not show these differences for filters oriented horizontally. This result demonstrates that the response characteristics of model neurons cannot be assumed to be independent on the ongoing task. This suggests that it is necessary to characterize responses of sensory neurons during passive exposure not only to natural stimuli but also to natural stimuli during natural task execution. Furthermore, this also suggests investigations of adaptation processes based on the variability in input statistics due to different natural tasks.
Selectivity of gaze targets
In order to further interpret the differences in feature statistics described above, the simple cell responses are clustered and reprojected into image space. These features of intermediate complexity demonstrate that the vast majority of fixations is directed to only a small subset of all possible feature clusters. The first three such features are solid areas for the litter objects, the obstacles, and the walkway. While the most common patch in the environment is represented by a solid lawn area, it is selected much less. The next five clusters are edges between the blue objects in different directions and orientations. This result demonstrates that from the 36 cluster centers utilized to represent the visual scenes, only very few are selected most of the time.
The fact that subjects tend to direct their gaze closer to the edge of obstacles when avoiding them can therefore explain why the proportion of gaze directed toward the walkway increases from the pickup to the avoid condition, as noted when comparing the proportion of gaze times on object classes. When avoiding obstacles, gaze lands often close to the edge of the obstacle, resulting in the fixation being classified as falling onto the walkway. The additional analysis of the specific features at fixation location together with the map of the fixations relative to the pickup objects and the obstacles shows that the increased proportion directed toward the walkway reflects the difference in features targeted depending on whether subjects walk toward or around the object.
Feature statistics and task execution
All the feature dimensions of the visual input that are analyzed in the present study show sensitivity to the ongoing task as determined by the task priorities given through verbal instructions and manifest in the different walking trajectories that human subjects choose to solve the respective task. These differences in the feature statistics can be explained in terms of the gaze targets that human subjects select in the execution of the visuomotor tasks of avoiding and approaching objects during walkway navigation. This demonstrates that the active and purposeful gaze selection during goal-directed behavior in everyday tasks has significant influence on the statistics of the input to the visual system. Although it cannot be excluded that some of the described effects in the reported feature statistics are due to the design of the objects in the virtual environment and their visual properties, potential biases have been excluded through the comparison with statistics of natural image sets. Furthermore, these results suggest that simulating human gaze selection in natural images according to the distributions of eye movement parameters observed in humans can give a good indication of the average properties that feature statistics at fixation location can have, but that the variability of such statistics can be considerable, if the ongoing task is taken into account. Thus, it is not sufficient to sample natural images randomly or according to average eye movement statistics in order to obtain a stimulus set that well represents the visual input, but that instead task dependencies in the active selection process shape the image statistics at gaze.
Acknowledgments
This research was supported by National Institutes of Health Grants EY05729 and RR09283. The authors thank Brian Sullivan for help with data collection and calibration of the display as well as Travis McKinney and Kelly Chajka for help with data collection.