





Impact statement
This article highlights the critical role of community science programs in monitoring and removing marine debris, particularly in remote areas. Over two years, structured surveys on the Cocos (Keeling) Islands in the remote Indian Ocean demonstrated that single-use plastics (SUPs) – especially drinking straws and lids – accounted for a significant portion (42%) of the total marine debris, with <2% of items originating locally on the islands. The solution to Cocos’ plastic debris woes is therefore reliant on international policy agreements that address the proliferation of SUP packaging and support more effective waste management in other distant regions. These results lend support for a legally binding and enforceable Global Plastics Treaty.
Introduction
Everyday consumer products are frequently packaged in multiple layers of plastic, paper and foil wrapping. Despite significant efforts to eliminate excessive packaging practices and ‘problematic’ items, up to 42% of global packaging is classed as ‘non-functional slack filling’, referring to excessive packaging that plays no direct role in preserving product lifespan (Lavers et al., Reference Lavers, Hood, van Toulon, Nye-Butler, Charlesworth, Kandziora and Tait2026c). At the end of its life, single-use plastic (SUP) packaging continues to generate significant quantities of solid waste for global communities (Hopewell et al., Reference Hopewell, Dvorak and Kosior2009; Dey et al., Reference Dey, Dhumal, Sengupta, Kumar, Pramanik and Alam2021). For example, in the UK, more than 242,200 tonnes of non-recyclable materials are used in packaging each year (WRAP, 2025) and in Australia, an estimated 1 million tonnes of SUP items, including 70 billion soft plastic items (e.g., wrappers, bags), are used annually (Commonwealth of Australia, 2021) with less than 7% being recycled or repurposed (APCO, 2024). In both instances, the bulk of the packaging was sent to landfill after being used only once, and in some cases, for as little as a few days (EMF, 2013; UNEP, 2021).
Once in landfill or the environment, some SUP items can persist for centuries (Canopoli et al., Reference Canopoli, Coulon and Wagland2020; Ward and Reddy, Reference Ward and Reddy2020; Evode et al., Reference Evode, Qamar, Bilal, Barceló and Iqbal2021) with the unintended consequences of this waste often poorly considered or understood (Walker and McKay, Reference Walker and McKay2021). This is because mismanaged plastic waste that leaks into the environment contributes to many serious and complex environmental issues (Lavers et al., Reference Lavers, Bond and Rolsky2022) including the acceleration of climate change through plastic production and degradation processes which generate around 3% of annual global fossil fuel emissions (Ford et al., Reference Ford, Jones, Davies, Godley, Jambeck, Napper, Suckling, Williams, Woodall and Koldewey2022; Tangri, Reference Tangri2025). Plastic waste also worsens the biodiversity crisis by causing harm and loss of wildlife that become entangled in plastic debris (Lavers et al., Reference Lavers, Sharp, Stuckenbrock and Bond2020; Høiberg et al., Reference Høiberg, Woods and Verones2022) or mistakenly consume plastic items that cause internal blockages, lacerations or toxicity through chemicals leached from the plastics (Zimmermann et al., Reference Zimmermann, Bartosova, Braun, Oehlmann, Völker and Wagner2021; Savoca, Reference Savoca2025). The degradation of plastics into microplastics (<5 mm) compounds these issues by increasing its bioavailability to a wider array of impacted species, from plankton (Dryden and Duncan, Reference Dryden and Duncan2021) to humans (Landrigan et al., Reference Landrigan, Dunlop, Treskova, Raps, Symeonides, Muncke, Spring, Stegeman, Almroth, Chiles, Cropper, Deeney, Fuller, Geyer, Karasik, Mafira, Mangwiro, Matias, Mulders, Park, Velis, Vermeulen, Wagner, Wang, Whitman, Woodruff and Rocklöv2025) with microplastics widespread in human tissues and already contributing to reduced fertility (Qin et al., Reference Qin, Cao, Peng, Shan, Lian, Yu, Shui and Li2024), cardiovascular disease (Marfella et al., Reference Marfella, Prattichizzo, Sardu, Fulgenzi, Graciotti, Spadoni, D’Onofrio, Scisciola, La Grotta, Frigé, Pellegrini, Municinò, Siniscalchi, Spinetti, Vigliotti, Vecchione, Carrizzo, Accarino, Squillante, Spaziano, Mirra, Esposito, Altieri, Falco, Fenti, Galoppo, Canzano, Sasso, Matacchione, Olivieri, Ferraraccio, Panarese, Paolisso, Barbato, Lubritto, Balestrieri, Mauro, Caballero, Rajagopalan, Ceriello, D’Agostino, Lovino and Paolisso2024) and potentially cancer (Lynch-Godrei and Leung, Reference Lynch-Godrei and Leung2026). Plastic waste also impacts the broader environment by interfering with natural processes, such as temperature and moisture regulation, resulting in significant loss or change to habitat quality that may further impact upon wildlife (Lavers et al., Reference Lavers, Auty and Bond2021; Wang et al., Reference Wang, Bai, Liu, Zhang, Zhang, Chen, Xia, Cui and Rillig2023).
In remote areas, the effects of plastic pollution are particularly concerning (Lavers and Bond, Reference Lavers and Bond2017; Ríos et al., Reference Ríos, Frias, Rodríguez, Carriço, Garcia, Juliano and Pham2018). Many sites include islands where a significant amount of oceanic plastics are deposited due to their proximity to major currents and accumulation zones (e.g., the North Pacific Gyre; Egger et al., Reference Egger, Sulu-Gambari and Lebreton2020). Opportunities to monitor accumulation rates, or mitigate impacts through removing items from sensitive areas, can be logistically challenging and prohibitively expensive in remote areas (Dijkstra and Tirman, Reference Dijkstra and Tirman2025; Lavers et al., Reference Lavers, Cook, Woodward, Tait and Rivers-Auty2026a). For example, research and clean-up expeditions to uninhabited Henderson Island in the remote South Pacific are both brief and infrequent with debris accumulation (~30 new items/m/day) outpacing clean-up efforts (Lavers and Bond, Reference Lavers and Bond2017). Despite these challenges, the rationale for removing debris from remote locations is justified, with many sites being home to rare and declining species vulnerable to ingestion and entanglement in debris (e.g., seabirds and sea turtles; Gall and Thompson, Reference Gall and Thompson2015). For example, thousands of hermit crabs die each year after becoming entrapped in single-use drink bottles (Lavers et al., Reference Lavers, Sharp, Stuckenbrock and Bond2020) and sharks are frequently entangled and injured by plastic strapping tape (Afonso and Fidelis, Reference Afonso and Fidelis2023).
Removing debris from remote locations can also have economic and social benefits for local communities reliant on tourism (Jang et al., Reference Jang, Hong, Lee, Lee and Shim2014; Rodríguez et al., Reference Rodríguez, Ressurreição and Pham2020). In Australia, tourists are drawn to the natural values of the Cocos (Keeling) Islands (hereafter, Cocos), including its palm-fringed beaches, turquoise waters and extensive coral reefs (Sea Country Solutions, 2023). While the leeward and lagoon-facing beaches of Cocos remain pristine, the windward side of many of the islands are inundated with the world’s waste, including an estimated 373,000 plastic toothbrushes and 977,000 rubber sandals (i.e., flip flops; Lavers et al., Reference Lavers, Dicks, Dicks and Finger2019). The Cocos community has expressed concern regarding the economic and environmental impacts of the debris (CKI Shire, 2020). To address this, a number of community activities have been implemented, including establishing fixed transects on beaches with an aim to identify the provenance of debris, specific ‘problem’ items,’ and monitor rates of accumulation. Using a subset of these data, this study focuses on SUPs as a potentially significant and identifiable portion of the debris washing up on Cocos’ beaches. While SUPs are well-documented on beaches in the region, existing data are pooled into broad categories (e.g., plastic bottles) which has complicated interpretation and weakened links to specific policy measures (i.e., bans targeting specific items). Numerous policy mechanisms have been proposed to address SUPs at state (e.g., Western Australia’s Plan for Plastics; DEWER, 2026), national (e.g., Australian National Plastics Plan; Commonwealth of Australia, 2021) and international levels (i.e., Global Plastics Treaty; UNEP, 2023). The study therefore aims to identify the amount, specific types and sources of SUPs on Cocos Islands as this is essential to informing the potential benefits these policy actions may have on this isolated community.
Methods
Study location
The Cocos Islands (−12.200, 96.854) have a complex jurisdiction; they are officially classed as a remote Australian external territory but are bound by the laws of the state of Western Australia (Supplementary Figure S1). The atoll is comprised of 27 islands, including North (Pulu) Keeling which is a significant seabird and sea turtle rookery and is a UNESCO World Heritage site (Director of National Parks, 2025). Located in the eastern Indian Ocean, the atoll is extremely remote, being located ~2,900 km north-west of Perth, Western Australia (the nearest capital city; Supplementary Figure S1). Approximately 600 people live on West and Home Islands; the remaining islands in the atoll are uninhabited. The islands are surrounded by the Cocos (Keeling) Islands Marine Protected Area (MPA; 467,054 km2) which was established in March 2022 (Director of National Parks, 2025). Waste management options are limited on Cocos due to the remoteness of the islands and their low-lying nature (≤3 m above sea level). With the exception of glass, which is crushed and used in construction, other ocean and locally sourced wastes, including plastics, are burned in open pits or more recently, in a high-temperature incinerator (Hossain, Reference Hossain2025).
Debris monitoring sites and methods
Monitoring plots were established by the Tangaroa Blue Foundation on Cocos to document macro-plastics (≥5 mm) and other debris (e.g., glass, processed timber) washing up on three beaches (Supplementary Table S1). The beaches were selected because they represent differing environmental conditions, in particular, the level of exposure to the Indonesian Throughflow and South Java Current (Gordon, Reference Gordon2005). During each monitoring session, beach debris was collected and sorted by up to 45 citizen scientists (volunteers). Collection was supervised by the same team member (EW) who received training, followed a standardised protocol (TBF, 2021), and was responsible for quality control and entering the data into the national Australian Marine Debris Initiative (AMDI) Database. In brief, at each site, four 25-m long transects were established using GPS waypoints. Each transect was separated by a gap where no debris was collected (typically 5–25 m wide; Supplementary Table S1) and spanned the entire width of the beach (i.e., from the waterline to the vegetation; Supplementary Figure S2). At Pulu Gangsa Beach, transect length was reduced to 12.5 m (Supplementary Table S1) due to the high volumes of debris (Figure 1, panel b) and limited time available for collection and sorting, especially in the extreme heat.
Volunteers collecting debris (a) and a close-up view of the accumulated items along Pulu Gangsa Beach (b).

Figure 1. Long description
Panel A, located on the left, shows a wide-angle view of a tropical beach. In the background, a line of green vegetation meets the white sand, with turquoise water and a blue sky visible to the right. Several volunteers are crouched along the shoreline, wearing hats and gloves while collecting items into buckets. In the foreground, a man in a tan uniform and a dark cap kneels, placing a small piece of debris into a blue bucket. Panel B, on the right, provides a high-angle close-up of the sand. A dense line of marine debris stretches from the top-left toward the bottom-right. The waste consists of various plastic items, including bottles, caps, fragments of nets, straws, and weathered containers, mixed with natural driftwood and dried seaweed. The background of panel B shows the edge of the green coastal shrubbery.
Monitoring was conducted quarterly (i.e., every third month) starting in mid-December 2024 until late-March 2026 (i.e., six sampling events over a 15-month window; Supplementary Table S1). This provides multiple sampling periods during the southwest monsoon (i.e., when the Indonesian Throughflow and South Java Current dominate the region; June–August) and the dry season when currents flow around or away from Cocos (for additional details see Figure 1 in van der Mheen and Pattiaratchi, Reference van der Mheen and Pattiaratchi2024).
Debris sorting and identification
Once collected, debris from each transect was counted and sorted into categories developed as part of AMDI. The categories have been used across Australia, and internationally, since 2005 (Supplementary Table S2; TBF, 2024). The final dataset included only items that had been identified to the sub-category level (Supplementary Table S2), as the broader category (e.g., sanitary) sometimes included a mixture of SUPs and non-SUPs or non-plastic items (e.g., tissues).
In Australia, the harmonisation of ‘definitions to support the phase out of problematic single-use plastic’ has been identified as a priority (DCCEEW, 2024); however, a consistent definition is not yet available (Supplementary Table S2). While the terminology and phrasing is broadly similar across regions and organisations (Supplementary Table S2), for the purposes of this study, we use the definition of SUP items provided by the Australian Packaging Covenant Organisation: ‘plastic items designed to be disposed of after one use or, if not part of an accessible reuse system, used for its original purpose only once before being discarded’ (APCO, 2023).
The likely provenance of beach-washed items found within transects was also recorded. Due to the condition of some items, a combination of features was used to establish provenance, including the presence of a label where the brand or place of manufacture was listed and/or the UPC barcode. At the completion of the project (late-March 2026), a list of the 20 most commonly encountered brands was compiled and presented to the two shops that offer items for sale on Cocos. On 23 and 24 March 2026, the staff of the shops on Home and West Islands were asked to compare the brand list with their inventory (purchase list) and identify any brands sold locally on the islands.
Data analysis
Debris densities (reported in items/m2 and g/m2) were calculated based on the total number and mass of SUP items collected from each transect and the transect dimensions (25 m long; width (mean ± SD) 13.3 ± 5.0 m). Each SUP sub-category is reported as a proportion (%) of total debris collected.
Results
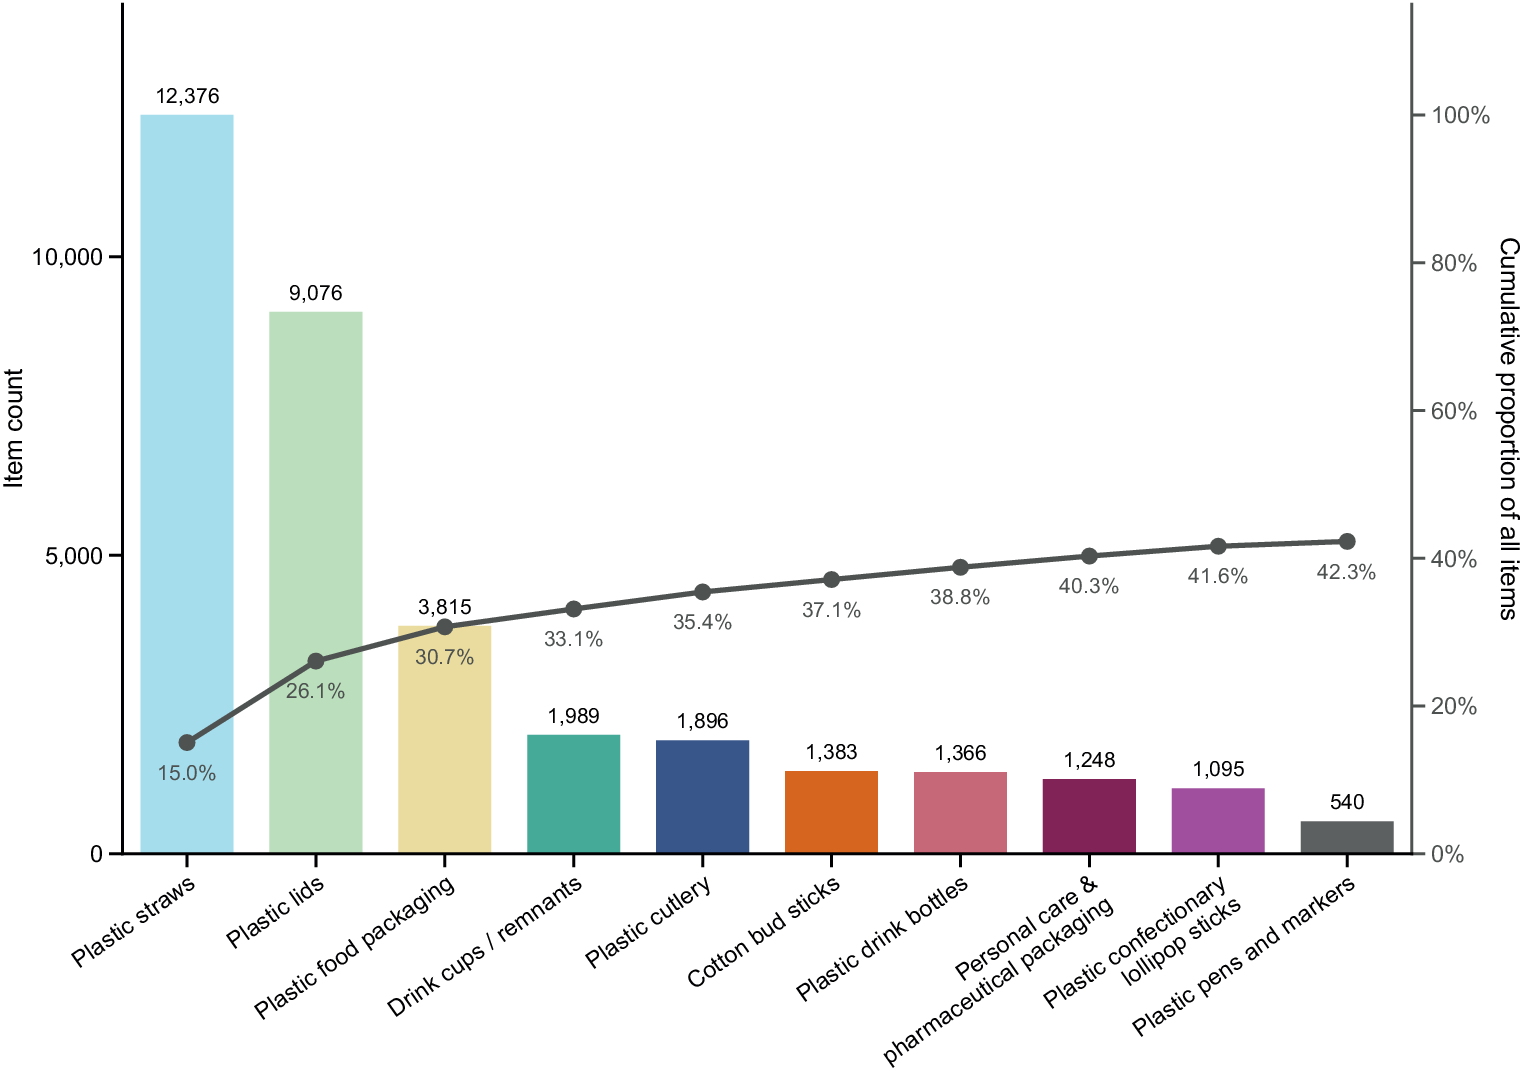
During 2024–2026, a total of 82,284 items were recorded within the monitoring transects on Direction, Home and West Islands (debris density estimates by mass and number of items are presented in Supplementary Table S5). Of the total debris items collected, 36,120 (42.3%) were classified as SUPs (Figures 2 and 3, Supplementary Table S3). The ten most common SUP items are listed in Table 1, with plastic drinking straws and drink bottle lids accounting for 59.4% of all items collected.
Single-use plastic (SUP) debris items collected during a single monitoring survey at Pulu Gangsa Beach on the Cocos (Keeling) Islands. Example categories include straws (a), drink cups (single-serve fruit flavour, water and milk; b), cutlery (c), soft film and icy pole wrappers (food packaging category; d), drink lids (e), personal care containers (e.g., deodorant, shampoo; f), confectionary (lollipop) sticks (g), stationary (h), cigarette lighters (i) and drink bottles (j). Photo credit: Emma Washer.

Figure 2. Long description
The photo grid is organized into three rows.
Top row from left to right:
Panel A shows a dense pile of thin, multi-colored plastic straws.
Panel B consists of two separate photos showing piles of clear and white single-serve plastic drink cups.
Panel C displays a heap of white and blue plastic cutlery, including spoons and forks.
Middle row from left to right:
Panel D consists of two photos showing soft plastic film and clear icy pole wrappers.
Panel E features a colorful assortment of round plastic drink lids in various sizes.
Panel F shows a collection of personal care containers such as deodorant and shampoo bottles.
Bottom row from left to right:
Panel G contains a large pile of white plastic confectionary or lollipop sticks.
Panel H displays stationary items including pens, markers, and mechanical pencil components.
Panel I shows a group of colorful disposable cigarette lighters.
Panel J features two rows of plastic drink bottles, with larger bottles on top and smaller ones below.
The ten most common single-use plastic (SUP) items recorded across monitoring transects on Direction, Home and West Islands during 2024–2026. Bars show item counts for the ten SUP subcategories (n = 36,120); the line indicates the cumulative proportion relative to the total number of items found (n = 82,284).

Figure 3. Long description
A Pareto chart with three axes. The left vertical axis is Item count ranging from 0 to over 10,000. The right vertical axis is Cumulative proportion of all items ranging from 0% to 100%. The horizontal axis lists ten S U P subcategories.
From left to right, the bars and cumulative line points are:
* Plastic straws: 12,376 items, 15.0% cumulative.
* Plastic lids: 9,076 items, 26.1% cumulative.
* Plastic food packaging: 3,815 items, 30.7% cumulative.
* Drink cups / remnants: 1,989 items, 33.1% cumulative.
* Plastic cutlery: 1,896 items, 35.4% cumulative.
* Cotton bud sticks: 1,383 items, 37.1% cumulative.
* Plastic drink bottles: 1,366 items, 38.8% cumulative.
* Personal care & pharmaceutical packaging: 1,248 items, 40.3% cumulative.
* Plastic confectionery lollipop sticks: 1,095 items, 41.6% cumulative.
* Plastic pens and markers: 540 items, 42.3% cumulative.
The cumulative line shows a logarithmic growth curve that begins to plateau as it reaches the tenth item, representing less than half of the total 82,284 items found.
The ten most common single-use plastics found in transects surveyed on the Cocos (Keeling) Islands during 2024–2026

Table 1. Long description
The table consists of three columns: Item sub-category, n (total number of items), and % (proportion of total debris). The data is presented in descending order of frequency:
* Straws: 12,376 items, 34.3%.
* Drink bottle lids: 9,076 items, 25.1%.
* Food packaging: 3,815 items, 10.6%.
* Single-serve water drink cups: 1,989 items, 5.5%.
* Cutlery: 1,896 items, 5.2%.
* Cotton bud sticks: 1,383 items, 3.8%.
* Personal care and pharmaceutical packaging (e.g., deodorant, eye drop bottles): 1,248 items, 3.8%.
* Confectionary sticks: 1,095 items, 3.0%.
* Drink bottles (e.g., milk, tea, water, and soft drink): 1,366 items, 2.9%.
* Stationary (e.g., pens and lids): 540 items, 1.6%.
A note at the bottom specifies that n equals the total number of items collected across all transects and years, and the total percentage does not sum to 100 because this is a subset of the complete debris list.
Note: % = proportion of total debris and n = total number of items collected across all transects and in all years. The total percentage does not sum to 100; a complete list of items is provided in Supplementary Table S3.
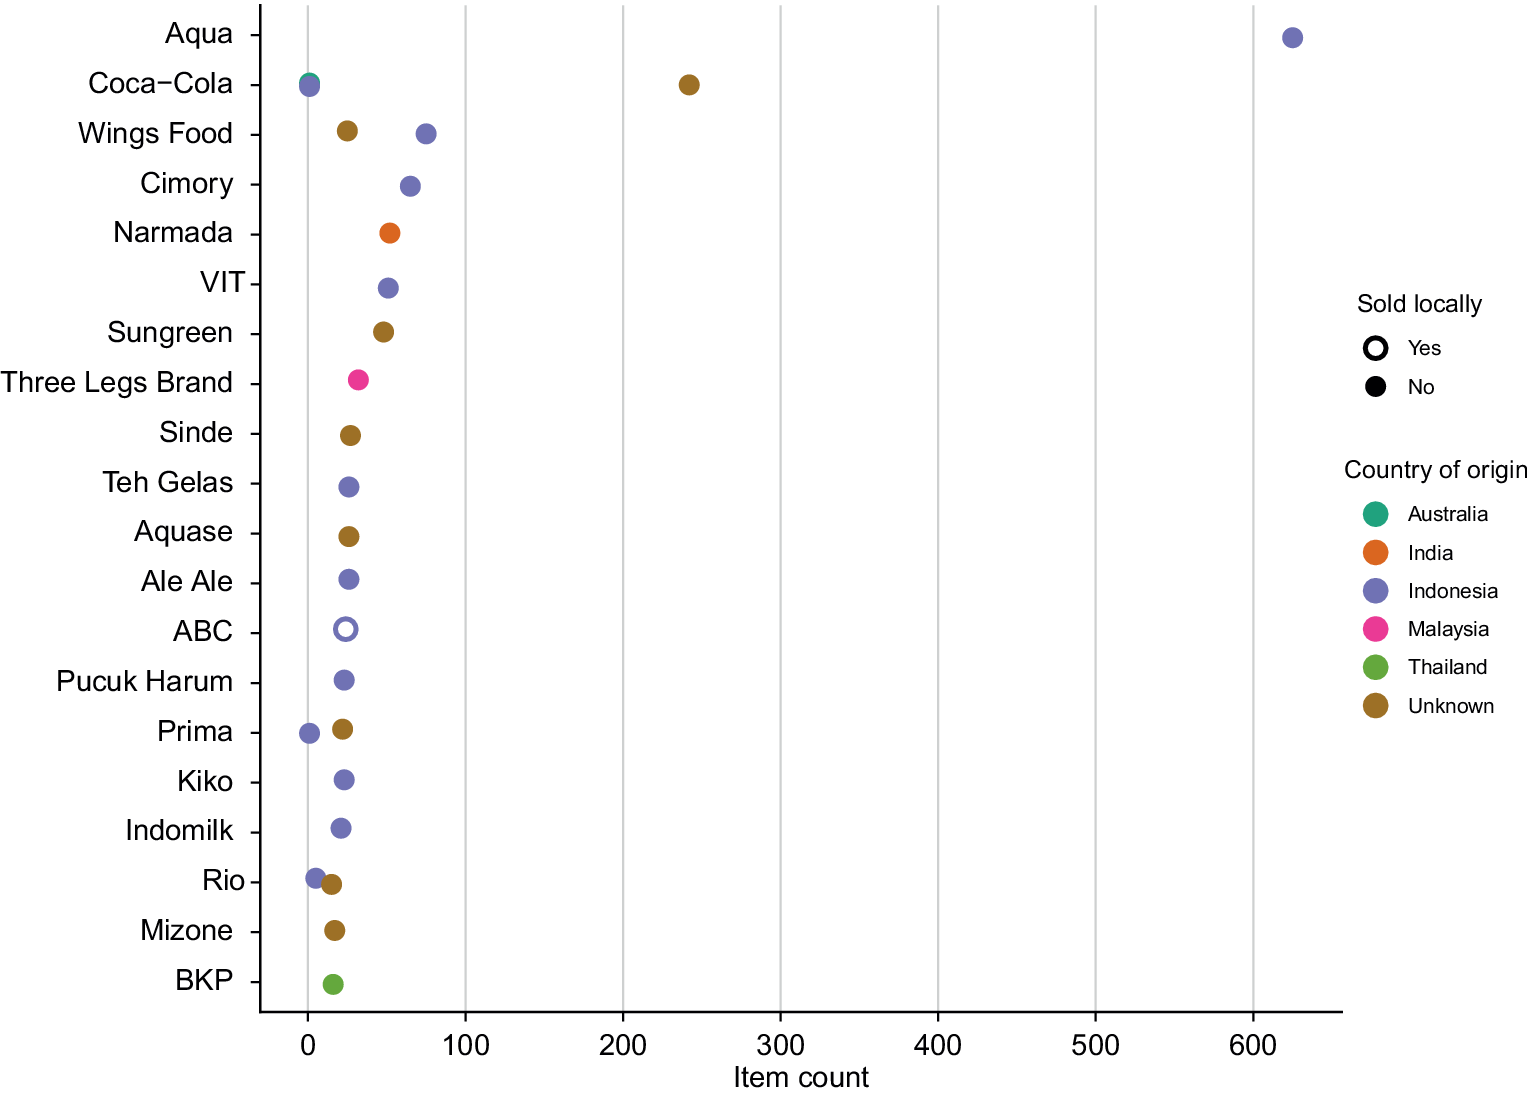
Items with identifiable brands accounted for only 6.03% of the total SUP debris collected. We present the results for the 20 most common brands reported in transects. Seventeen (85%) of the brands were manufactured exclusively in south-east Asia and are not available for sale in the local shops on Cocos (Figure 4). Only one brand (ABC; n = 24, 1.6%) was available for sale in plastic bottles in the shop on West Island (Figure 4).
The provenance of the 20 most common single-use plastic (SUP) brands based on items collected from transects on the Cocos (Keeling) Islands during 2024–2026. Interviews with the shop staff on Home and West Islands indicate that the majority of items found on the beaches are not sold locally.

Figure 4. Long description
The Y-axis lists 20 brands from top to bottom: Aqua, Coca-Cola, Wings Food, Cimory, Narmada, V I T, Sungreen, Three Legs Brand, Sinde, Teh Gelas, Aquase, Ale Ale, A B C, Pucuk Harum, Prima, Kiko, Indomilk, Rio, Mizone, and B K P. The X-axis measures Item count from 0 to 600.
A legend on the right indicates ‘Sold locally’ with a white circle for Yes and a black circle for No. ‘Country of origin’ is color-coded: Teal for Australia, Orange for India, Purple for Indonesia, Pink for Malaysia, Green for Thailand, and Brown for Unknown.
Key data points include:
* Aqua: Highest count at approximately 625 items, purple dot (Indonesia), not sold locally.
* Coca-Cola: Two dots, one purple (Indonesia) at near 0 and one brown (Unknown) at approximately 240.
* A B C: The only brand marked as sold locally (white circle with purple outline) with a count around 25.
* The majority of brands (Wings Food, Cimory, V I T, Teh Gelas, Ale Ale, Pucuk Harum, Kiko, Indomilk) are purple dots (Indonesia) clustered between 0 and 100 items.
* Narmada is orange (India) at approximately 50.
* Three Legs Brand is pink (Malaysia) at approximately 30.
* B K P is green (Thailand) at approximately 15.
* Several brands like Sungreen, Sinde, and Mizone are brown (Unknown) with counts under 50.
Discussion
In total, SUP items accounted for 42% of the more than 36,000 debris items recorded in only 12 small transects (total area ~ 1.09 ha) on Cocos during 2024–2026. These results highlight marine debris – and in particular, SUPs – as a significant and ongoing environmental challenge facing the ecology and natural history of Cocos as well as the local community and demonstrate the critical role of community science in monitoring and resolving global environmental issues, including plastic pollution. This study also contributes new empirical evidence to complement findings from other remote sites, such as Henderson Island and Christmas Island (Nichols et al., Reference Nichols, Lavers, Archer-Rand and Bond2021; Lavers et al., Reference Lavers, Cook, Woodward, Tait and Rivers-Auty2026a).
Of the ten most common SUPs found on Cocos’ beaches (Supplementary Table S2), Western Australian legislation currently prohibits the sale of four items (straws, drink cups, cutlery and cotton bud sticks; Supplementary Table S4). Together, these four items account for 48.8% of the SUPs found on Cocos’ beaches (Figures 2 and 3). Based on the brand information, only 1.6% of the top 20 branded SUP items found on Cocos’ beaches during 2024–2026 were available for purchase in the local shops (Figure 4). This means the majority of debris is not local in origin (e.g., litter) and suggests state legislation is insufficient to prevent new SUP items from impacting Cocos, and beaches elsewhere in Western Australia (Davies et al., Reference Davies, Tait and Lavers2026). Instead, most of the debris on Cocos has washed in from afar (Figure 4), including countries where SUP legislation and waste management are limited. These results agree with ocean circulation models which suggest the bulk of debris washing up on Cocos’ shores likely originates in south-east Asia (van der Mheen and Pattiaratchi, Reference van der Mheen and Pattiaratchi2024). Many of the manufacturers (parent companies) of the brands detected on Cocos’ beaches have relevant sustainability policies and targets. For example, the company Danone has committed to the MacArthur Foundation’s New Plastics Economy Initiative (MacArthur et al., Reference MacArthur, Waughray and Stuchtey2016) and is a signatory of the Global Commitment on Plastics (Danone, 2025). Despite this, three beverage brands manufactured and distributed by Danone (Aqua, VIT and Mizone; Figure 4) continue to be packaged in SUP bottles. Together, these three brands accounted for 46.5% of the top 20 branded SUP items found on Cocos’ beaches. This adds to a growing body of evidence indicating voluntary commitments made by corporations are insufficient to drive positive change (Khanna and Brouhle, Reference Khanna, Brouhle, Delmas and Young2009; Southworth, Reference Southworth2009; Williams and Decker Sparks, Reference Williams and Decker Sparks2023).
The provenance of marine debris on Cocos highlights the urgent need for global action on plastics and the additional support required for developing and remote island nations to manage the waste crisis. While SUPs are a major focus of the Global Plastics Treaty, negotiations have stalled (Guo and Hu, Reference Guo and Hu2025) and there is concern regarding the treaty’s ability to deliver binding agreements given numerous ‘structural, discursive and institutional arrangements that normalise plastic dependence and marginalise alternatives’ (Qiao, Reference Qiao2026; Taggart et al., Reference Taggart, Ralston and Tilsted2026). At present, many of the countries considered to be sources of the debris found on Cocos (e.g., Indonesia; Figure 4) are burdened with significant plastic waste exported from developed countries, including Australia (Gündoğdu et al., Reference Gündoğdu, Puckett, Gedik, Terzi and Öztürk2025). Thus, the solution to the plastics issue on Cocos hinges as much on international policy developments (Schnurr et al., Reference Schnurr, Alboiu, Chaudhary, Corbett, Quanz, Sankar, Srain, Thavarajah, Xanthos and Walker2018) as it does on improvements to Australia’s capacity to prevent and manage waste locally. In the meantime, other solutions to the waste crisis must also be considered.
While individual actions are often criticised for having a negligible impact on reducing waste (Root, Reference Root2019; Hoffmann et al., Reference Hoffmann, Mlakar, Rauws and Bolderdijk2025), recent data indicate this is false and that such beliefs play an important role in undermining mitigation efforts (Hoffmann et al., Reference Hoffmann, Mlakar, Rauws and Bolderdijk2025; Nabi et al., Reference Nabi, Qureshi, Mohammad, Mukherjee, Abubakr, Malik and Amin2026). While shifting the focus to individual actions has provided industry with the opportunity to continue with a business-as-usual approach (Lavers et al., Reference Lavers, Bond and Rolsky2022), individual and item-specific policies can also produce measurable outcomes, even if they do not address the full spectrum of plastic waste. For example, following the introduction of a straw-on-request ordinance in California, plastic straw use at 133 businesses declined by 32–41% with most businesses reporting no effect on operations (Wagner and Toews, Reference Wagner and Toews2018). In Australia, reduction strategies that aimed to tackle debris items at the source (i.e., Source Reduction Plans [SRPs]) led to a significant reduction in the number of plastic strapping bands and cigarette butts reported during subsequent surveys (Serra-Gonçalves et al., Reference Serra-Gonçalves, Bond, Tait, Fischer and Lavers2023). Many of these same SUP items are consumed by wildlife (Brandão et al., Reference Brandão, Braga and Luque2011; Lavers et al., Reference Lavers, de Jersey, Rivers-Auty and Bond2026b), and so, individual and item-specific changes have clear benefits for the environment.
Community-focused monitoring programs, combined with the development of user-friendly tools (e.g., the AMDI phone app) has supported the collection of large-scale, standardised datasets at a scale, speed and efficiency that is not possible through traditional scientific models (Jambeck and Johnsen, Reference Jambeck and Johnsen2015; Gacutan et al., Reference Gacutan, Johnston, Tait, Smith and Clark2022). Such programs also have significant social benefit through connecting citizen scientists with their community and creating opportunities for engaging in meaningful environmental actions (Battisti and Gippoliti, Reference Battisti and Gippoliti2019; Nelms et al., Reference Nelms, Easman, Anderson, Berg, Coates, Crosby, Eisfeld-Pierantonio, Eyles, Flux, Gilford, Giner, Hamlet, Hembrow, Hickie, Hopkinson, Jarvis, Kearsley, Millard, Nunn, Pollitt, Sainsbury, Sayer, Sinclair, Slack, Smith, Thomas, Tyler, Walker, Wallerstein, Ward and Godley2022). On Cocos, the community has expressed concern regarding the consequences of plastic waste for wildlife, their tourism-based economy and potentially human health. As a result, participation in the debris monitoring program is widespread with local schools, the police brigade, tourism operators and government officials regularly contributing to the program. This has provided an important opportunity for individuals to learn about the pollution issue, demonstrate leadership within their community and bring about positive change. Given the success and benefits of citizen science programs, a number of recommendations have been made that are aimed at sustaining long-term citizen science programs, including targeted funding schemes and curricula that integrate citizen science opportunities into early education (Nunn et al., Reference Nunn, da Silva Hyldmo, McKnight, McCulloch, Lavers, Old, Smith, Grobler, Kay Yin, Chan, Raeburn, Simard, Smith, Van Holsbeeck, Drinkwater, Prendergast, Burrows and Lawson2026).
Study limitations
The duration of this study (15 months) is somewhat limited. As debris monitoring on Cocos is ongoing, future analysis should aim to incorporate additional data as study duration influences our ability to detect patterns (Lavers et al., Reference Lavers, de Jersey, Rivers-Auty and Bond2026b), including important changes that may occur following the implementation of new waste policy. While data for this study were collected from three islands (Home, West and Direction Island; Supplementary Table S1), beach location (e.g., directionality) can influence debris accumulation (Lavers et al., Reference Lavers, Cook, Woodward, Tait and Rivers-Auty2026a); thus, sampling at additional sites could assist with identifying localised patterns. Finally, while reporting of branded items provides much-needed information on the likely provenance, many products used at-sea (e.g., fishing nets) are unbranded. Chemical or other analysis could be useful in elucidating the source of unbranded materials, which likely account for a significant portion of marine debris items (Lebreton et al., Reference Lebreton, Royer, Peytavin, Strietman, Smeding-Zuurendonk and Egger2022). Strengthening brand accountability in the Global Plastics Treaty would also simplify product identification and corporate accountability processes.
Conclusions
A recent global assessment of beach debris across 112 nations identified food and beverage items as the most abundant pollutant category (Kelly et al., Reference Kelly, Cordova, Jobling, Somerfield and Thompson2026). Our results for Cocos strongly agree with this, reinforcing single-use food and beverage packaging designs as a ‘clear, high-priority target’ for policymakers (Kelly et al., Reference Kelly, Cordova, Jobling, Somerfield and Thompson2026). We concur with Kelly et al. (Reference Kelly, Cordova, Jobling, Somerfield and Thompson2026) that these findings, which collectively account for almost 90% of the world’s population, mean society must move beyond ‘one-size-fits-all’ solutions to the plastic pollution crisis. Meaningful reductions in debris in remote locations, such as Cocos, and across the remaining 112 nations, could be achieved through urgent application of policy designed to target high-impact items at national and global scales (Kelly et al., Reference Kelly, Cordova, Jobling, Somerfield and Thompson2026). In the case of Cocos, such legislation could potentially reduce beach-washed debris by ~42% (Figure 3), assuming countries located within the Indian Ocean catchment respond to policy change (Kamara et al., Reference Kamara, Kalidin, Mallela, Pittock, Graham, Tarer, Tait, Lavers, van Niekerk, Lamberth and Pattiaratchiin review).
Understanding the specific types, origins and transport pathways of marine debris allows targeted intervention strategies to be designed and implemented by multiple stakeholder groups. For example, items identified as local litter are relevant to local councils, state regulatory bodies and community organisations who hold the jurisdictional authority, policy levers (e.g., container deposit schemes, SUP bans) and local infrastructure needed to implement direct source-reduction strategies. Debris items identified as originating from offshore sources are relevant to international shipping or fisheries and the relevant stakeholders shift to federal authorities, international maritime bodies (e.g., International Maritime Organization) and foreign governments. These entities hold the cross-border jurisdiction, international legal frameworks and diplomatic responsibility necessary to govern policy at a global scale. In Australia, manufacturers, packaging suppliers and commercial sectors (e.g., aquaculture) utilise AMDI data to evaluate their supply chain leakage, measure extended producer responsibility (EPR) and redesign packaging to prevent environmental loss. Thus, all stakeholders connected to the plastics supply chain, lifecycle, policy or recovery of items found during clean-ups are relevant end-users of data generated through community clean-up and monitoring programs like the one on Cocos. Identifying what was found and where dictates who has the power to stop it at the source, which is key to resolving the marine pollution issue (Serra-Gonçalves et al., Reference Serra-Gonçalves, Bond, Tait, Fischer and Lavers2023; Cottom et al., Reference Cottom, Cook and Velis2024).
Open peer review
To view the open peer review materials for this article, please visit http://doi.org/10.1017/plc.2026.10073.
Supplementary material
The supplementary material for this article can be found at http://doi.org/10.1017/plc.2026.10073.
Acknowledgements
Citizen science programs succeed because of the passion of dedicated volunteers; without their support, this project would not have been possible. In particular, the students and staff from the Cocos (Keeling) Islands District High School were instrumental in the success of this project and we are grateful for their support. The Shire of the Cocos (Keeling) Islands, Cocos Marine Care, Cocos Island Ports, Cocos Cooperative, Cocos Blue Charters, Cocos Day, The Barge, the Suka Duka Seniors Group, Australian Federal Police and Parks Australia assisted with safety protocols, data collection, office space for sorting debris, transportation of crew/equipment and/or assistance with disposal of collected debris. Staff and volunteers who participated in the Tangaroa Blue Voyage Team, including Shannon Martin, Ian Anderson, Renee Mouritz and Elizabeth Barton, assisted with monitoring in 2024 and 2025. Daniel Sim and Lainie Brian kindly provided information on the brands available for sale locally on Home and West Islands. We are grateful to Jodi Jones for her commitment to robust data management and feedback on this article. Richard Farr kindly generated the maps used in Supplementary Figure S1. Anonymous reviewers generously volunteered their time to provide constructive feedback on previous versions of this manuscript.
Competing interests
None.
Data availability statement
Summary data have been included in the manuscript according to Tangaroa Blue Foundation community generated data guidelines. Raw data requests can be made through Tangaroa Blue Foundation’s data request portal.
Funding statement
The Tangaroa Blue Foundation and Australian Department of Climate Change, Energy, the Environment and Water ‘Our Marine Parks Grant’ (no. 4-JFP9OXI) provided the funding for this research.
Author contributions
Conceptualization: JG, JLL; Data Curation: JG, EW; Formal Analysis: JG, JLL; Funding Acquisition: HT; Investigation: EW; Visualization: JG; Writing – Original Draft: JLL; Writing – Review & Editing: JG, EW, HT.





 Open access


Comments
Enclosed please find our manuscript entitled “Single-use plastics as the primary source of plastic pollution on a remote island in Western Australia” for publication as a full-length research article in Cambridge Prisms: Plastics.
Key results of this study: In this manuscript we present the results of a citizen science program that generated robust monitoring data on beach-washed debris on a remote island. We focus our analysis on single-use plastics (SUPs), as these items comprised 44% of the total debris collected over 2.5 years. Our results demonstrate that SUPs are a significant source of debris on beaches in this region, with >98% of these items originating offshore, primarily in south-east Asia. Thus, the challenges facing this site are not local (e.g., littering), but international. SUP items are a major focus of the Global Plastics Treaty negotiations; therefore, our results demonstrate what could be achieved if the treaty were ratified, binding, and enforceable.