Implications
Increased crystalline amino acid use to reduce protein sources in swine diets has led to a need for further characterization of the dose–response to increasing Trp : Lys for growing pigs. Few studies evaluating such responses have been conducted under large-scale commercial conditions. Results demonstrate that marginal increases in growth rate and feed intake to increasing Trp : Lys were best characterized by quadratic polynomial (QP) equations. The response equations developed from this study can be used to characterize the effects of increasing Trp : Lys on growth performance and then applied to determine an optimum concentration based on local economic considerations.
Introduction
In the United States, increasing usage of crystalline amino acids and distillers dried grains with solubles (DDGS) in commercial swine diets have become economically justified. The use of DDGS increases the importance of Trp in in the diet (Naatjes et al., Reference Naatjes, Htoo, Walter, Tölle and Susenbeth2014). The ideal amino acid concentration to maximize growth performance of pigs can be expressed in various ways (Stein et al., Reference Stein, Fuller, Moughan, Sève, Mosenthin, Jansman, Fernández and de Lange2007), though one of the most practical approaches for diet formulation is the expression of the standardized ileal digestible (SID) Trp concentration as a ratio to Lys (Trp : Lys). The National Research Council (NRC) (2012) SID Trp : Lys requirement estimate for growing-finishing gilts is 17.4%. However, results of experiments indicate that the optimum SID Trp : Lys is between 16.5% and 23.6% for growing-finishing pigs (Simongiovanni et al., Reference Simongiovanni, Corrent, Le Floc’h and van Milgen2012; Zhang et al., Reference Zhang, Song, Xie, Chu, Thacker, Htoo and Qiao2012; Salyer et al., Reference Salyer, Tokach, DeRouchey, Dritz, Goodband and Nelssen2013). These studies indicate the concentration needed to maximize growth performance may be different than that estimated by NRC (2012). To accurately determine the optimal SID Trp : Lys concentration for maximum growth performance, Lys must also be limiting. Otherwise, the SID Trp : Lys estimate will be underestimated (Susenbeth and Lucanus, Reference Susenbeth and Lucanus2005; Susenbeth, Reference Susenbeth2006). Currently, there are few recent dose–response studies reported in growing-finishing pigs (Moehn et al., Reference Moehn, Pencharz and Ball2012) and none summarized in the NRC (2012) were conducted under large-scale commercial conditions. Therefore, the objective of this study was to determine the SID Trp : Lys dose–response curve for average daily gain (ADG), average daily feed intake (ADFI) and feed efficiency (G : F) in 30 to 125 kg gilts housed under large-scale commercial conditions.
Material and methods
General
The Kansas State University Institutional Animal Care and Use Committee approved the protocol used in these experiments. All experiments were conducted at a commercial research barns in southwestern Minnesota. The barns were naturally ventilated and double-curtain sided. Pens had completely slatted flooring and deep pits for manure storage. Each pen (5.5×3.0 m) was equipped with a four-hole stainless steel dry self-feeder and a cup waterer. Each barn was equipped with a computerized feeding system (FeedPro; Feedlogic Corp., Willmar, MN, USA) that delivered and recorded daily feed additions and diets as specified. This system can feed each individual pen any of the individual diets as well as a blend of two diets. The equipment provided gilts with ad libitum access to feed and water.
Animals and diets
A growth study was conducted in four 21-day experiments consisting of a total of 1166, 1099, 1132 and 975 gilts (337×1050; PIC, Hendersonville, TN, USA) with initial BW of 29.9±2.0 kg, 55.5±4.7 kg, 71.2±3.2 kg and 106.2±3.1 kg and final BW of 45.6±2.7, 75.0±5.1, 91.2±3.4 and 124.7±4.7 (mean±SD) in Exp 1, 2, 3 and 4, respectively. Exp 1 and 3 were conducted with a single group of gilts and fed a common diet with 20% SID Trp : Lys for 32 days between experiments. Gilts were used because they have been shown to be more sensitive to Trp deficiency than barrows (Henry, Reference Henry1995; Henry et al., Reference Henry, Sève, Mounier and Ganier1996; Salyer et al., Reference Salyer, Tokach, DeRouchey, Dritz, Goodband and Nelssen2013). Within each experiment, pens of gilts were initially weighed and ranked by average pig BW. Blocks of pens were then formed based on the BW ranking and within block pens were randomly assigned to one of the seven dietary treatments in a randomized complete block design. After randomization of pens to treatment in Exp 3, a count of previous treatment in Exp 1 was evaluated to insure that the previous treatments in Exp 1 were evenly distributed across treatments in Exp 3. Each experiment had six pens per treatment with 27.8 pigs per pen (minimum 27 and maximum 28) in Exp 1, 26.2 pigs per pen (minimum 26 and maximum 27) in Exp 2, 27.0 pigs per pen (minimum 25 and maximum 28) in Exp 3, and 23.2 pigs per pen (minimum 20 and maximum 24).
Five representative samples of corn, soybean meal and DDGS were collected each week for 5 week before Exp 1 and analyzed in duplicate for total amino acids (except Trp; method 994.12; Association of Official Analytical Chemists (AOAC International), 2012), Trp (method 13904:2005; ISO, 2005), and CP (method 990.03; AOAC International, 2012) by Ajinomoto Heartland Inc. (Chicago, IL, USA), and values were used in diet formulation. Other nutrients and SID amino acid digestibility coefficient values used for diet formulation were obtained from NRC (2012). The sources of corn, soybean meal and DDGS were kept the same for all trials.
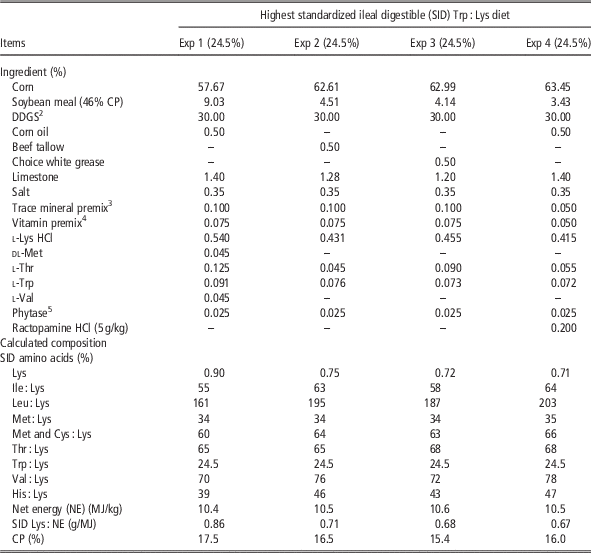
Two experimental corn-soybean meal-based diets with 30% DDGS were formulated for each of the experiments (Table 1) to be limiting in Lys and have SID Trp : Lys ratios of 14.5% or 24.5%. Thus, the 14.5% SID Trp : Lys diet was the same diet as the 24.5% Trp : Lys diet with the exception that l-Trp was not included and a similar amount of corn included. The 14.5% and 24.5% diets were blended to form the five intermediate diets using the robotic feeding system. The proportion of 14.5% and 24.5% SID Trp : Lys blended to create the treatment diets were 100% and 0%, 80% and 20%, 65% and 35%, 50% and 50%, 35% and 65%, 20% and 80%, and 0% and 100% for 14.5%, 16.5%, 18.0%, 19.5%, 21.0%, 22.5% and 24.5% SID Trp : Lys ratios, respectively. The SID Trp : Lys was increased by adding crystalline l-Trp to the control diet at the expense of corn. The NRC (2012) model was used to estimate the optimum Lys concentration of gilts at the expected BW at the end of each experiment. The SID Lys as a percentage of the diet was reduced by 0.05 percentage points below the optimum at the expected BW at the end of Exp 1 and 0.10 percentage units for the other experiments to ensure that Lys was below the requirement throughout the experiment. This reduction was based on results of a preliminary study conducted by Gonçalves et al. (Reference Gonçalves, Bello, Dritz, Tokach, DeRouchey, Woodworth and Goodband2014) in the same commercial research facility. Diets were fed in meal form and were manufactured at the New Horizon Farms feed mill (Pipestone, MN, USA).
Diet composition in experiments (Exp) 1, 2, 3 and 4 presented on as-fed basisFootnote 1

1 Diets were fed from 29.9 to 45.6 kg in Exp 1, 55.5 to 75.0 kg in Exp 2, 71.2 to 91.2 kg in Exp 3 and 106.2 to 124.7 kg BW in Exp 4. Composite samples of corn, distillers dried grains with solubles (DDGS) and soybean meal were obtained before the experiment and analyzed for total amino acid content by Ajinomoto Heartland Inc. The analyzed total amino acids and SID digestibility values from NRC (2012) were used in the diet formulation. The 14.5 SID Trp : Lys diet fed was the same diet with the exception of the lack of l-Trp addition to the 24.5 SID Trp : Lys diet within each experiment. The 14.5 and 24.5 SID Trp : Lys diets were fed as 100% for the low and high ratio, respectively. Within each experiment the low and high diet were blended in the appropriate proportions to result in the intermediate five dietary dosages.
2 Distillers dried grains with solubles.
3 Provided per kilogram of premix: 33 g Mn from manganese oxide, 110 g Fe from iron sulfate, 110 g Zn from zinc oxide, 16.5 g Cu from copper sulfate, 0.33 g I from ethylenediamin dihydroiodide and 0.30 g Se from sodium selenite.
4 Provided per kilogram of premix: 7 054 720 IU vitamin A; 1 102 300 IU vitamin D3; 35 274 IU vitamin E; 3527 mg vitamin K; 6173 mg riboflavin; 22 046 mg pantothenic acid; 39 683 mg niacin; and 26.5 mg vitamin B12.
5 OptiPhos 2000 (Huvepharma, Peachtree City, GA, USA) provided 500 FTU phytase/kg of diet.
In each experiment, diet samples were collected from six feeders per dietary treatment 3 days after the beginning and 3 days before the end of each experiment and stored at −20°C. Amino acids were then analyzed in duplicate on composite samples of each diet by Ajinomoto Heartland Inc. Diet samples were also analyzed for dry matter (method 935.29; AOAC International, 2012), crude fiber (method 978.10; AOAC International, 2012 for preparation and Ankom 2000 Fiber Analyzer (Ankom Technology, Fairport, NY, USA)), ash (method 942.05; AOAC International, 2012), ether extract (method 920.39 a; AOAC International, 2012 for preparation and ANKOM XT20 Fat Analyzer (Ankom Technology, Fairport, NY, USA)), calcium and phosphorus (method 968.08 b; AOAC International, 2012 for preparation using an ICAP 6500 (ThermoElectron Corp., Waltham, MA, USA; Ward Laboratories Inc., Kearney, NE, USA)).
Data collection
For each experiment, pen was the unit of replication and experimental unit. Total pen weight was measured on days 0 and 21 and feed disappearance during the entire 21-day period was measured. These data were then used to calculate on a pig day basis ADG, ADFI, G : F, grams of SID Trp daily intake, and grams of SID Trp intake per kilogram of gain per pig for each pen. Total grams of SID Trp daily intake was calculated based on formulated values by multiplying ADFI by SID Lys level and SID Trp : Lys ratio. The total grams of SID Trp intake divided by total BW gain to calculate the grams of SID Trp intake per kilogram of gain.
Statistical analysis
As a first step, responses (ADG, ADFI, G : F, BW, grams of SID Trp daily intake, and grams of SID Trp intake per kilogram of gain) were each analyzed within each experiment using a generalized linear mixed model to accommodate the randomized complete block design structure of each experiment. These initial analyses were used to characterize performance as a function of dietary treatments consisting of increasing dietary SID Trp : Lys. The statistical model for these analyses included the fixed categorical effect of dietary treatment presented as a factor and initial average pen BW as a random blocking factor. Pen was the experimental unit. Linear and quadratic contrasts were built using coefficients adjusted for unequally spaced treatments.
Heterogeneous residual variances were characterized and accounted for using empirically defined variance groups consisting of treatment combinations that had comparable residual dispersion, as previously described (Robbins et al., Reference Robbins, Norton and Baker2006; Goncalves et al., Reference Gonçalves, Tokach, Dritz, Touchette, DeRouchey, Woodworth and Goodband2016). The best fitting heteroscedastic ANOVA model was decided upon using the Bayesian information criterion (BIC). The Kenward–Roger’s procedure was used to estimate degrees of freedom and make appropriate adjustments to estimated standard errors (Kenward and Roger, Reference Kenward and Roger1997). Statistical models were fitted using the GLIMMIX procedure of SAS (Version 9.3; SAS Institute Inc., Cary, NC, USA). Results were considered significant at P⩽0.05 and marginally significant at 0.05<P⩽0.10.
Next, data from all four experiments were combined and used to fit dose–response models to ADG, ADFI and G : F as a function of SID Trp : Lys in the diet as a continuous variable. Specifically, we considered dose–response models that recognize functional forms including a broken-line linear (BLL) ascending model, a broken-line quadratic (BLQ) ascending model and a QP, as previously described (Robbins et al., Reference Robbins, Norton and Baker2006; Goncalves et al., Reference Gonçalves, Tokach, Dritz, Touchette, DeRouchey, Woodworth and Goodband2016). In all dose–response models, the linear predictor included Trp : Lys ratio as an explanatory covariate and experiment and block nested within experiment as random effects. In addition, linear and quadratic terms and their interaction with treatment dose based on pen average initial BW were included in the model. There was no evidence the interaction terms enhanced the fit of the models and were eliminated from the models. However, based on their enhancing of model fit to the data based on maximum likelihood-based BIC the linear and quadratic terms for BW were retained in the model for ADG and ADFI. This suggests that blocking by initial BW likely encompassed not only differences in initial BW of the gilts but possibly, additional effects of management, environmental or other uncharacterized effects that differed between blocks.
Broken-line regression models were fitted using nonlinear mixed model (NLMIXED) procedure. The optimization technique used was the dual Quasi-Newton algorithm, as specified by default in the NLMIXED procedure. Competing statistical models were compared using maximum likelihood-based fit criteria, specifically the BIC (Milliken and Johnson, Reference Milliken and Johnson2009). Results reported here correspond to inference yielded by the best fitting model for ADG, ADFI and G : F.
For the best fitting models, the estimated SID Trp : Lys of ADG, ADFI and G : F to reach plateau performance (i.e. R BLL and R BLQ in the broken-line models) or to reach maximum performance (i.e. in the QP) are reported with a 95% confidence interval (CI), as described previously (Goncalves et al., Reference Gonçalves, Tokach, Dritz, Touchette, DeRouchey, Woodworth and Goodband2016). In the QP model, the level of SID Trp : Lys that maximized the response variable was estimated by equating the first derivative of the regression equation to 0, then solving for the SID Trp : Lys. The corresponding 95% CIs were computed using the inverse regression approach proposed by Lavagnini and Magno (Reference Lavagnini and Magno2007).
Results
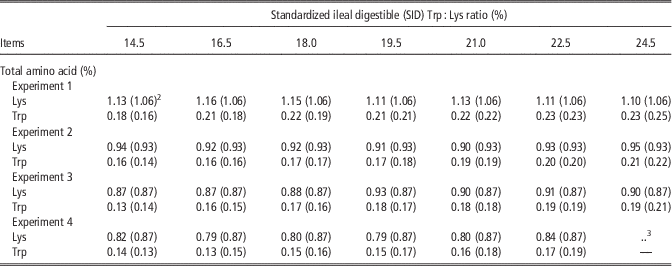
Results of diet analyses indicated that proximate components in the diets were consistent with calculated values (data not shown). The analyzed total Lys and Trp content of experimental diets for Exp 1, 2, 3 and 4 (Table 2) were consistent with calculated values and within acceptable analytical variation (Official Method 994.12; AOAC International, 2012). Gilts consumed a total of 17.7, 19.3, 18.3 and 19.6 g of SID Lys per kg of gain in Exp 1, 2, 3 and 4, respectively. These levels were all lower than the optimum SID Lys gram per kilogram of gain estimates by Main et al. (Reference Main, Dritz, Tokach, Goodband and Nelssen2008) and NRC (2012) growth model, which suggests that Lys was limiting in all diets.
Total Lys and Trp analysis of the diets presented on an as-fed basis with expected calculated values in parenthesisFootnote 1

1 Diet samples were taken from six feeders per dietary treatment 3 days after the beginning of the trial and 3 days before the end of the trial and stored at −20°C amino acid analysis was conducted in duplicate on a composite sample of each diet by Ajinomoto Heartland Inc.
2 Values in parentheses are total values on an as-fed basis calculated based on total amino content from corn, soybean meal and distillers dried grains with solubles samples which were obtained before the start of the experiment.
3 Sample for 24.5% SID Trp : Lys ratio in experiment 4 was lost.
Characterization of growth performance of growing-finishing gilts
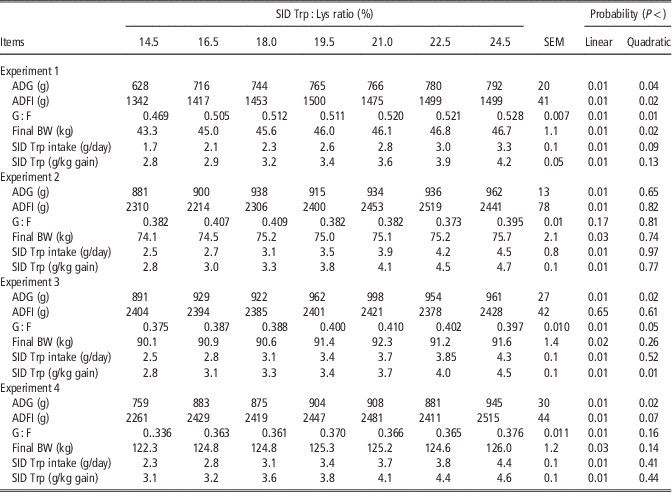
Increasing SID Trp : Lys increased ADG in a quadratic manner (P<0.02) in all experiments (Table 3) except Exp 2, for which the increase was linear (P<0.001). Increasing SID Trp : Lys increased ADFI in a quadratic manner (P<0.02) in Exp 1 and linearly (P<0.001) in Exp 2. There was no evidence for ADFI treatment differences based on linear (P>0.65) or quadratic (P>0.61) contrasts in Exp 3, and ADFI was marginally increased in a quadratic manner (P<0.07) in Exp 4 as SID Trp : Lys increased. Increasing SID Trp : Lys increased (P<0.05) G : F quadratically in Exp 1, 3 and 4 linearly (P<0.02).
Least square mean estimates for growth performance of growing-finishing gilts fed dietary treatments of standardized ileal digestible (SID) Trp : Lys ranging from 14.5% to 24.5%Footnote 1

ADG=average daily gain; ADFI=average daily feed intake.
1 Each least square mean estimate is the mean of six pens per treatment with 20 to 28 gilts/pen in a series of four 21-day-growth trials experiments. Gilts (PIC 337×1050) were initially 29.9±0.82 kg, 55.5±1.94 kg, 71.2±1.40 kg and 106.2±1.25 kg BW) in experiments 1, 2, 3 and 4, respectively.
Final BW increased linearly (P<0.03) in response to increasing SID Trp : Lys in all experiments except Exp 1, where the increase in final BW was in a quadratic manner (P<0.02). Increasing SID Trp : Lys increased grams of SID Trp daily intake linearly (P<0.001) in all experiments. Increasing SID Trp : Lys increased grams of SID Trp intake per kilogram of gain linearly (P<0.001) in all experiments except Exp 3, where the increase was in a quadratic manner (P<0.01).
Estimation of standardized ileal digestible Trp : Lys dose–responses
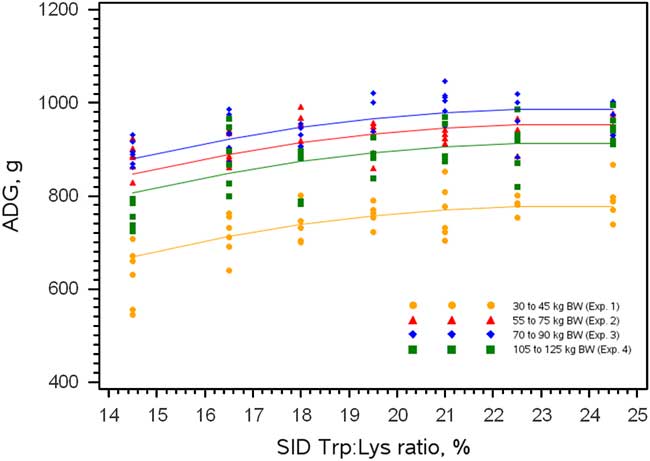
When dose–response models were fitted to the response ADG, the QP model had the best fit (BIC: 1655.4), whereas BLL and BLQ models showed poorer fit (BIC: 1668.7 and 1659.8, respectively). The overall estimated SID Trp : Lys maximum for ADG was 23.5% (95% CI: [22.7, 24.3%]) based on the QP dose–response model (Figure 1), fitted as follows: ADG, g=(−328.6)+6342.5×(SID Trp : Lys)−13 514×(SID Trp : Lys)2+15.074×(Initial BW, kg)−0.0978×(Initial BW, kg)2, where the Trp : Lys is expressed in decimal form (i.e. 0.180) rather than as a percentage (i.e. 18.0%).
Quadratic polynomial (QP) regression of the average daily gain (ADG) response to increasing standardized ileal digestible (SID) Trp : Lys in experiments (Exp) 1, 2, 3 and 4. The maximum ADG was achieved at 23.5% (95% confidence interval: [22.7, 24.3%]) SID Trp : Lys in the QP model.

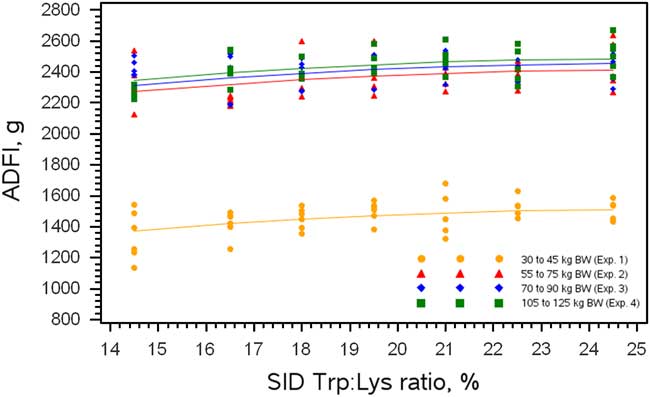
For ADFI, QP had the best fit (BIC: 1134.2) whereas BBL and BLQ showed poorer fit (BIC: 1147.2 and 1141.1, respectively). The maximum mean ADFI was estimated at >24.5% (95% CI: [16.5, >24.5%]) SID Trp : Lys based on the QP model (Figure 2), fitted as follows: ADFI, g=−514.2+6245.1×(SID Trp : Lys)−12431.4×(SID Trp : Lys)2+49.97×(Initial BW, kg)−0.2628×(Initial BW, kg)2.
Quadratic polynomial (QP) regression of the average daily feed intake (ADFI) response to increasing standardized ileal digestible (SID) Trp : Lys in experiments (Exp) 1, 2, 3 and 4. The maximum ADFI was achieved at >24.5% (95% confidence interval: [16.5, >24.5%]) SID Trp : Lys with the QP model.

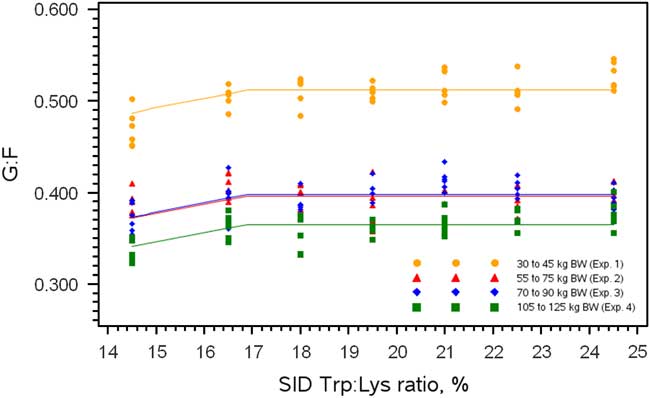
For G : F, BLL showed the best fit (BIC: 1316.3) whereas the QP model showed poorer fit (BIC: 1322.6). The BLQ model (BIC: 1316.1) initially appeared to have comparable fit to that of the BLL model. However, upon closer examination, it was apparent that the breakpoint parameter R BLQ was not identifiable in this model, as the quadratic segment of the fitted BLQ model relied on only two of the three required anchoring points along the x-axis (Goncalves et al., Reference Gonçalves, Tokach, Dritz, Touchette, DeRouchey, Woodworth and Goodband2016). Thus, inference based on the BLQ model was considered questionable and not pursued further. The estimated SID Trp : Lys ratio breakpoint for G : F was 16.9 (95% CI: [16.0, 17.8%]) for the BLL model (Figure 3) and estimated using the following equation: G : F=0.599−1.0×(0.169–SID Trp : Lys ratio)−0.004×(Initial BW, kg)+0.000017×(Initial BW, kg)2 if SID Trp : Lys ratio <16.9%.
Broken-line linear (BLL) and broken-line quadratic (BLQ) regressions of the feed efficiency (G : F) response to increasing standardized ileal digestible (SID) in experiments (Exp) 1, 2, 3 and 4. The maximum G : F was achieved at 16.9 (95% confidence interval (CI): [16.0, 17.8%]) and 17.0% (95% CI: [15.0, 18.9%]) SID Trp : Lys in the BLL and BLQ models, respectively.

Discussion
The goal of this study was to estimate the SID Trp : Lys dose–responses for ADG, ADFI and G : F in 30 to 125 kg gilts under commercial conditions. Research by de Ridder et al. (Reference de Ridder, Levesque, Htoo and de Lange2012) found that the efficiency of Trp utilization for protein deposition is reduced under immune stimulation leading to a 7% increase in the requirement for Trp for protein deposition. Pigs under commercial conditions are likely to experience a greater level of immune stimulation and, thus, require a higher Trp : Lys ratio. As protein deposition is associated with increased growth rate our finding of an increased requirement relative to that suggested by NRC (2012) which supports that under commercial conditions the Trp : Lys may be elevated.
Our findings were consistent with a study by Zhang et al. (Reference Zhang, Song, Xie, Chu, Thacker, Htoo and Qiao2012) conducted on growing pigs observed SID Trp : Lys optimums ranging from 19.7% to 23.6%, depending on the response variable and method of analysis. In that study, the authors concluded that the SID Trp : Lys needed to maximize ADG was at least 22% for 25 to 50 kg pigs. Salyer et al. (Reference Salyer, Tokach, DeRouchey, Dritz, Goodband and Nelssen2013) studied the SID Trp : Lys in diets with 30% DDGS in two commercial research facility trials; the authors observed maximum growth performance at 16.5% for growing-finishing pigs up to 72.6 kg and ˃19.5% SID Trp : Lys for pigs heavier than 72.6 kg.
In contrast, the classical work on ideal dietary protein in pigs estimated a total Trp : Lys of 18% (Wang and Fuller, Reference Wang and Fuller1989). As a reference, 18% total Trp : Lys is approximately equivalent to 17.6% SID Trp : Lys in a corn-soybean meal-based diet with 30% DDGS. The NRC (2012) model estimates a similar SID Trp : Lys of 17.3% for gilts fed a diet containing 9.0 MJ net energy/kg. Further, a recent study by Young et al. (Reference Young, Zamora, Campbell, Zijlstra, Usry and Stevenson2013) concluded that the SID Trp : Lys to maximize growth and economic performance for 34 to 125 kg pigs housed under commercial conditions was 18%.
Kendall et al. (Reference Kendall, Gaines, Kerr and Allee2007) conducted three studies with barrows and concluded that the SID Trp : Lys for 90 to 125 kg BW was at most 17%; however, the grams of SID Lys intake per kilogram of gain was above 20 in two of the three trials, which indicates that diets may have contained SID Lys above the estimated requirement for barrows (Main et al., Reference Main, Dritz, Tokach, Goodband and Nelssen2008). It is possible that this may have underestimated the SID Trp : Lys. In addition, the CP levels in those experiments were low (8.4% to 10.5%), which could potentially be limiting performance (Kerr and Easter, Reference Kerr and Easter1995). The fact that Kendall et al. (Reference Kendall, Gaines, Kerr and Allee2007) used only barrows also may have played a role in the SID Trp : Lys estimation, because barrows are less susceptible to Trp deficiency than gilts (Henry, Reference Henry1995; Henry et al., Reference Henry, Sève, Mounier and Ganier1996; Salyer et al., Reference Salyer, Tokach, DeRouchey, Dritz, Goodband and Nelssen2013).
Quant et al. (Reference Quant, Lindemann, Kerr, Payne and Cromwell2012) observed no evidence for difference in the ideal SID Trp : Lys concentration comparing corn-based v. non-corn-based (barley and Canadian field peas) diets. In these studies, the authors observed a SID Trp : Lys estimate of 15.6% and 15.8% for plasma urea N and ADG, respectively. The diets used in the studies by Quant et al. (Reference Quant, Lindemann, Kerr, Payne and Cromwell2012) were adequately deficient in Lys (14.0 to 14.6 g of SID Lys intake per kg of gain). The range of SID Trp : Lys in these experiments (12.7% to 17.9% and 13.0% to 18.1%) encompasses Trp deficiency, but did not encompass the range in our studies where the maximum response for ADG was observed.
The maximum response for ADFI was greater than the range tested in our experiment. The fit of the QP model was considerably better than either the BLL or BLQ models. In three of the four experiments the highest numerical feed intake was noted in pigs fed the highest Trp : Lys. Although their dose range was lower than used in our experiments a similar response has been observed in other studies where the pigs fed the highest Trp : Lys ratio (17.9) had the numerically highest feed intake was reported by Quant et al. (Reference Quant, Lindemann, Kerr, Payne and Cromwell2012). In addition, Zhang et al. (Reference Zhang, Song, Xie, Chu, Thacker, Htoo and Qiao2012) had the highest feed intake for pigs fed their 2nd highest Trp : Lys (22%) dosage or similar to our optimum.
A lower SID Trp : Lys to maximize G : F was estimated than that to maximize ADG in a meta-analysis reported by Simongiovanni et al. (Reference Simongiovanni, Corrent, Le Floc’h and van Milgen2012). Conversely, Zhang et al. (Reference Zhang, Song, Xie, Chu, Thacker, Htoo and Qiao2012) observed that the Trp concentration for G : F was higher than that for weight gain. Thus, our large-scale study conducted under commercial conditions agrees with most of the literature regarding the SID Trp : Lys for G : F and similar to that reported by Simongiovanni et al. (Reference Simongiovanni, Corrent, Le Floc’h and van Milgen2012) shows a greater dosage for maximizing ADG. In the case of ADG, the maximum obtained just below highest dietary level fed and the ADFI maximum higher than the highest-level fed indicates that small marginal increases in ADFI may be proportional to the increases in ADG. If the ADFI and ADG are proportional this would support the observation that G : F similar for doses greater than SID Trp : Lys of 16.9. Tryptophan (Trp) is thought to physiologically impact feed intake (Henry, Reference Henry1995; Henry et al., Reference Henry, Sève, Mounier and Ganier1996). In our study the QP best fit models for ADG and ADFI are the result of a lack of plateau above our highest dose. Moreover, selection of the model can have a large influence on the requirement reported in amino acid studies (Nørgaard et al., Reference Nørgaard, Shrestha, Krogh, Sloth, Blaabjerg, Poulsen, Tybirk and Corrent2013). In our study, we have reported the results of the QP model since this model had a better fit as indicated by the BIC. The Trp : Lys level that maximizes performance is typically higher in QP models compared with BLQ and BLL. However, typically feeding pigs slightly below the optimum Trp : Lys will not have as much of a negative impact when using a QP model compared with other two models used in this analysis. Therefore, QP models need to be interpreted in a different light compared with the BLQ and BLL models. Nonetheless, we believe that researchers should use the best fitting models based on their data when expressing amino acid dose–responses.
In conclusion, the estimated SID Trp : Lys for 30 to 125 kg gilts ranged from a minimum of 16.9% for maximum G : F to 23.5% for maximum ADG. However, with decreasing marginal responses in the case of a best fit QP model, formulating diets slightly below that needed for the maximum response can potentially be more economical. As a result, some nutritionists have arbitrarily chosen to formulate diets such as 90%, 95% or 99% of the maximum response (Robbins et al., Reference Robbins, Saxton and Southern1979; Pesti et al., Reference Pesti, Vedenov, Cason and Billard2009). As a result of the procedures used, the equations described can be used to model expected growth performance as a function of dose–response and determine Trp : Lys concentrations for local economic conditions.
Acknowledgment
Partial funding for these experiments was provided by Ajinomoto Heartland Inc., Chicago, IL, USA.