Implications
Haze development (turbidity response) of saliva exposed to tannin-rich (TR) extracts indicates the possible presence of tannin-binding salivary proteins (TBSPs). Finding TBSPs in growing sheep, with no previous exposure to TR fodder, may imply that sheep are capable of: (a) interacting with TR vegetation showing a plastic phenotyphic response; (b) blocking dietary tannins and hence diminishing their anti-nutritional and toxic effects, and, (c) tolerating high quantities of TR forages in their diet. These aspects would enable sheep to obtain nutrients from the available TR vegetation either for production or nutraceutical properties.
Introduction
High levels of tannin-binding salivary proteins (TBSPs) have been found in browsing animals such as deer (Austin et al., Reference Austin, Suchar, Robbins and Hagerman1989) and black rhinoceroses (Clauss et al., Reference Clauss, Gehrke, Hatt, Dierenfeld, Flach, Hermes, Castell, Streich and Fickel2005). Meanwhile, the presence of TBSPs is considered less evident in grazers (Austin et al., Reference Austin, Suchar, Robbins and Hagerman1989; Lamy et al., Reference Lamy, da-Costa, Santos, Capela e Silva, Potes, Pereira, Coelho and Baptista2011). Recent studies reported TBSPs in animals commonly regarded as grazers, such as the Indian rhinoceroses (Clauss et al., Reference Clauss, Gehrke, Hatt, Dierenfeld, Flach, Hermes, Castell, Streich and Fickel2005) and zebu cattle (Yisehak et al., Reference Yisehak, Becker, Rothman, Dierenfeld, Marescau, Bosch, Hendriks and Janssens2012). Those studies suggested that grazing animals may express TBSPs when they consume fodder from tannin-rich plants (TRP) in their natural diet for long periods of time. In these animals, histatins, multi-functional proteins or even protein isoforms could function as TBSPs (Austin et al., Reference Austin, Suchar, Robbins and Hagerman1989; Lamy et al., Reference Lamy, da-Costa, Santos, Capela e Silva, Potes, Pereira, Coelho and Baptista2011). Adult hair sheep from Yucatan, Mexico, consuming daily a wide variety of TRP, are able to ingest a large quantity of TRP (Alonso-Díaz et al., Reference Alonso-Díaz, Torres-Acosta, Sandoval-Castro, Hoste, Aguilar-Caballero and Capetillo-Leal2009) and polyethylene glycol fail to increase the ingestion of TRP (Galicia-Aguilar et al., Reference Galicia-Aguilar, Rodríguez-González, Capetillo-Leal, Cámara-Sarmiento, Aguilar-Caballero, Sandoval-Castro and Torres-Acosta2012; Hernández-Orduño et al., Reference Hernández-Orduño, Torres-Acosta, Sandoval-Castro, Aguilar-Caballero, Capetillo-Leal and Alonso-Díaz2012). Alonso-Diaz et al. (2012) found evidence of TBSP in the saliva of adult sheep and goats. However it was not possible to determine if the response was a constitutive response in the animals or a plastic phenotypic expression resulting from the constant intake TRP. The objective was to determine if TBSP is a physiological response that can increase with exposure to tannin-rich (TR) materials.
Material and methods
Animals and experimental groups
The study was conducted at the Faculty of Veterinary Medicine, Autonomous University of Yucatan (19°30'N, 87°30'W), Mexico. Twenty-four 4-month-old hair sheep were raised nematode free (Galicia-Aguilar et al., Reference Galicia-Aguilar, Rodríguez-González, Capetillo-Leal, Cámara-Sarmiento, Aguilar-Caballero, Sandoval-Castro and Torres-Acosta2012). At weaning, lambs were allocated to individual metabolic cages where they were kept for 2 weeks. During this period of time, animals were fed 800 g of Pennisetum purpureum grass fresh basis (FB), and 400 g FB of tannin-free, grain-based feed. Animals had free access to water. Lambs were distributed into three groups balanced according to their live weight (LW) and sex (eight lambs per group): control group (CG), tannin-short term (TST) group and tannin long-erm (TLT) group.
From D10 to D35 of the trial all groups were fed with P. purpureum grass ad libitum+concentrate feed 400 g/day. Concentrate feed was increased to 600 g/day from D36 to D112 to ensure sufficient intake of nutrients for growth. From D14 to D55, TST group received 650 g/day of Lysiloma latisiliquum fresh fodder. Thereafter animals returned to the tannin-free diet (D56 to D112). The TLT group received 650 g/day of L. latisiliquum fresh fodder from D14 until the end of the experiment (D112).
Plant material and dry matter intake
Pennisetum purpureum grass and L. latisiliquum foliage were harvested daily. Grass was chopped before being offered to animals. The L. latisiliquum foliage was obtained directly from trees. Leaves were offered within the first 4 h after collection. Individual foliage intake was measured daily (offered minus refused). Feed samples (200 g FB of each feed) were taken weekly for chemical analysis.
Chemical composition of the feed
Samples of P. purpureum, L. latisiliquum and concentrate feed were analyzed for dry matter, CP, ash [Association of Official Analytical Chemist (AOAC) 1980], ADF, NDF and lignin (methods 5, 6 and 8, respectively, Ankom200 Fiber Analyzer, Ankom Technology, Fairport, NY, USA), total tannins (TT), total phenols (TP) (Folin–Ciocalteu method, Makkar, Reference Makkar2003) and condensed tannins (CT) (Vanillin method, Price et al., Reference Price, Van Scoyoc and Butler1978).
Saliva collection
Parotid saliva samples could be ideal for identifying proline-rich protein (PRP), however, animals mix their feed with the complete saliva. Furthermore, other TBSPs besides PRPs (i.e. histatins) are present in the whole saliva. Therefore, it was decided to obtain whole saliva samples. At the end of every week, saliva samples were collected in the morning (after 12 h of fasting to minimize contamination of saliva with food). Saliva was collected from the oral cavity using a flexible plastic pipe attached to a 50 ml centrifuge conical tube, with the aid of a low-pressure vacuum pump (Felisa® model ARSA, AR1500L, Fabricantes Feligneo, S.A. de C.V., Zapopan, Jalisco, Mexico). Tubes were kept inside a cool box with ice during collection and transportation to the laboratory. Saliva samples were centrifuged at 2200×g for 10 min and the supernatant was kept at 4°C. On alternate weeks, saliva samples were either processed fresh, for turbidity [using the haze development test (HDT)], or lyophilized to determine the protein content. Both measurements were used to build the turbidity protein index (TPI).
Saliva samples were obtained every week on three strategic periods of the experiment:
• Baseline period (D10 to D14): Saliva characterization without dietary tannins.
• Period 1 (D15 to D56): To assess a change due to the ingestion of foliage-containing tannins (Groups TST and TLT compared with CG).
• Period 2 (D57 and D112): To assess a changes after withdrawing the foliage (TST) or maintaining the foliage consumption (TLT).
Saliva turbidity
Fresh saliva samples (4 ml) were mixed in a vortex with 4 ml of water solution containing either tannic acid (Sigma Co., St. Louis, MO, USA) or L. latisiliquum TR extract (produced according to Capetillo et al., Reference Capetillo, Reyes, Sandoval and Camacho2003) 1% w/v. The L. latisiliquum extract contained TP (18.8% tannic acid equivalent), TT (18.4% tannic acid equivalent) and CT (58.2% catechin equivalent).
Haze development was measured with UV/Vis spectrophotometer (Perkin-Elmer, Lambda 25, Waltham, MA, USA) at 610 nm of transmittance. The 0 min value was taken as the baseline to assess changes after 90 min (Δ% turbidity). Data of Δ% turbidity was presented in such a way that a positive value (increased turbidity or haze development) was considered a higher content of TBSP. Meanwhile, a negative value represents a lower TBSP content.
Salivary protein was determined in the lyophilized saliva (Lowry et al., Reference Lowry, Rosebrough, Farr and Randall1951) using bovine serum albumin (22%, Sigma Co.) as standard.
TPI
To correct for differences in the saliva protein content, a TPI was used to compare the tannin-binding capacity of the salivary proteins. The TPI was calculated with the means obtained during each period as follows:
 ${\rm TPI}=\Delta \,\%\,{\rm turbidity}/\left[ {{\rm salivary protein (mg)}} \right]$
Statistical analyses
The nature of each data set was different and needed different transformation procedures. Data obtained with tannic acid was not statistically compared with that obtained with L. latisiliquum. However, the results obtained with the saliva exposed to tannic acid and saliva exposed to L. latisiliquum were discussed in its appropriated context. Thus, the saliva turbidity data were transformed before their respective analyses with natural logarithms (when exposed to tannic acid), and square transformation (when exposed to L. latisiliquum extract). Then, the normal distribution of data was confirmed before the respective analyses. The TPI data were also transformed with natural logarithms before statistical analyses.
The change in salivary turbidity or TPI of the three groups was compared between groups using repeated measures ANOVA using the Proc Mixed with the maximum likelihood method [Statistical Analysis System (SAS), 2002]. The model included the main effects (group and period), the interaction (group×period) and the baseline data (which was used as a covariate). The repeated statement defined the variance structure for repeated measurements. The subject (SUB=animal) defined the variable on which repeated measurements were taken. Two types of variance-covariance structures were used: unstructured (UN) and variance components (VC). The different models were compared using the maximum likelihood ratio test for the estimation of variance components by a χ 2 test. The degrees of freedom was the difference of total of parameters for each model and the test statistic was the difference of the value −2 log likelihood of the respective Proc Mixed analysis (UN v. VC models) from the mixed output. The P-value calculated on the statistic test was compared with the specified χ 2 distribution. There were no differences between the different models meaning that there was no association between the different periods. Thus, a GLM for analysis of covariance was used. The model included the main effects (group and period), the interaction (group×period) and the baseline data (period 1), which was used as a covariate.
Dry matter intake data of L. latisiliquum fresh fodder of TST and TLT groups, during the second period, were not normally distributed and were compared with the non-parametric Mann–Whitney test.
Results and discussion
Diet composition and dry matter intake
The chemical composition of the different food ingredients offered to experimental animals is described in Table 1. The mean of L. latisiliquum dry matter intake for TST and TLT groups were 300.7±3.95 and 299.8±4.13, respectively (P>0.05). The P. purpureum grass and the commercial concentrate were both free of CT. The average value of CT in L. latisiliquum was 26.2±2.1 g/kg DM. The TST and TLT groups had similar consumption of L. latisiliquum fodder. Therefore, differences in TPI values would not be due to differences in the quantity of TR forage ingested (stimulus).
Chemical composition (g/kg DM) of the food ingredients used to feed the growing lambs to determine the saliva turbidity response

DM=dry matter; Lig=lignin; TP=total phenol (Folin–Ciocalteu; tannic acid equivalent); TT=total tannin (Folin–Ciocalteu+PVPP; tannic acid equivalent); CT=condensed tannins (Vanillin method; catechin equivalent).
Haze development
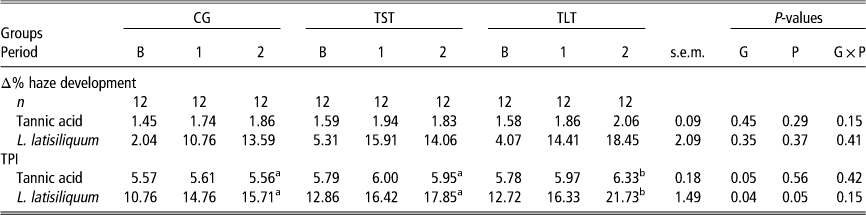
When tannic acid was used, haze development values (turbidity response) were not different between the groups in the experiment (Table 2). The TLT group showed a non-significant tendency to increase saliva transmittance (Δ% turbidity) compared with CG. When L. latisiliquum extract was used, there were no differences in turbidity among the experimental groups (Table 2). Similar to the results with tannic acid, there were no differences between groups on the baseline and first periods although groups fed with L. latisiliquum showed 30% more response.
Least squares means of haze development (Δ%) and TPI of saliva from sheep exposed to tannic acid and Lysiloma latisiliquum extractFootnote †

TPI=turbidity protein index.
n=number of replicates per treatment for each variable (haze and TPI) within each tannin source (tannic acid and L. latisiliquum extract).
Adjusted means are presented according to the appropriated transformation for each variable: Δ% tannic acid=Ln; Δ% L. latisiliquum=square root; TPI tannic acid=Ln; TPI L. latisiliquum=squared.
a,bDifferent letters indicate significant differences on TPI between groups on period 2 (P≤0.05).
† Saliva was obtained from the different experimental groups (CG, TST and TLT) during the three experimental periods (baseline 1 and 2).
In both cases, the lack of significance could be explained by differences in the salivary protein concentration. Thus, the latter seems a dilution effect as described for humans (Kallithraka et al., Reference Kallithraka, Bakker, Clifford and Vallis2001).
TPI
The TPI of CG was similar to the baseline data for the entire experimental period (112 days). The TPI found with tannic acid increased in TLT group during the experiment (Table 2). The TPI of TST group did not increase further after the TR forage was withdrawn. Although the CG showed the lowest TPI, the only difference between CG and TLT was found on period 2, when TLT had a higher TPI (P≤0.05). Similarly, when L. latisiliquum extract was used, there were no differences on TPI values between groups on the baseline and period 1. Also, the TPI of the TLT group was higher than that of CG during period 2 (P<0.05). These results were obtained from sheep without previous exposure to TR forages. Thus, it could indicate that the consumption of TR fodder induces a higher TPI. The latter is consistent with previous evidence suggesting the presence of TBSP in sheep and goats with browsing experience (Alonso-Díaz et al., Reference Alonso-Díaz, Torres-Acosta, Sandoval-Castro and Capetillo-Leal2012). The lack of response found with the TST group suggests that stopping the ingestion of TR fodders may lead to the reduction of TBSP production in lambs. Thus, possibly reducing the metabolic cost associated with protein synthesis.
Conclusions
The saliva of hair sheep consuming TR L. latisiliquum fresh fodder (TLT group) could increase TPI compared with control lambs not exposed to tannins. Whereas, the salivary TPI of TST lambs would not differ from CG lambs because the tannin stimulus of L. latisiliquum is withdrawn.
Acknowledgments
This work was supported financially by CONACYT No. 106146 and a collaboration between France and Mexico (CONACYT-PCP 04/09). J. J. Vargas-Magaña acknowledges PROMEP-SEP, Mexico for a PhD scholarship. The technical assistance from Israel Chan-Pérez is greatly acknowledged.