Introduction
Transparent conducting oxides (TCOs) have been used to fabricate devices, such as photovoltaics,[Reference Jang, Kim, Ghorpade, Shin, Gang, Park, Kim, Lee and Kim1] touchscreens,[Reference Chen, Liu, Zhang, Guo, Yin, Wang, Li, Zhang, Wang and Zhang2] and liquid crystal displays,[Reference Ko, Gu, Cheon, Roh, Kim, Jod, Hyun and Kim3] because of high transparency in the visible spectrum and low resistivity.[Reference Olson, Rost, Gaskins, Szwejkowski, Braun and Hopkins4] Indium thin oxide,[Reference Jin, Choi, Kim, Park, An, Kim, Kim, Diao and Jung5] gallium-doped indium zinc oxide,[Reference Solís-Cortés, Navarrete-Astorga, Costa-Krämer, Salguero-Fernandez, Schrebler, Leinen, Dalchiele, Ramos-Barrado and Martín6] zinc oxide (ZnO),[Reference Carlé, Helgesen, Madsen, Bundgaard and Krebs7] and aluminum-doped indium zinc oxide (AZO)[Reference Khan, Baek, Mobin and Kim8] are typical TCO materials. Among these, AZO has attractive properties due to its lower cost for large area technology, the abundance of its component species, non-toxicity, and high stability in hydrogen plasma, thermal stability, and high transmittance at visible wavelengths.[Reference Khan, Baek, Mobin and Kim8–Reference Choi, Gong, Johnson, Golledge, Yeom and Park12] Most importantly, AZO has been shown to have high transmission (80%–90%) in the visible while having fairly low resistivities (10−4 to 10−3 Ω cm). AZO-coated substrates have been prepared by a variety of methods including pulsed laser deposition (PLD),[Reference Kumarakurua, Cherns and Collins9] sol–gel,[Reference Kumar, Ganesh, Shkir, AlFaify and Valanarasu10] radio-frequency magnetron sputtering,[Reference Jilani, Abdel-wahab, Al-ghamdi, Dahlan and Yahia11] and atomic layer deposition (ALD).[Reference Choi, Gong, Johnson, Golledge, Yeom and Park12] Among these, ALD has the best thickness and doping level control, extremely smooth and pinhole-free surfaces, and easy mass production.[Reference George13] Here, the goal was to achieve low resistivity while maintaining high transparency. To do this, very high purity water, low pressures, and high nitrogen flow rates were used at deposition temperatures to determine the effect on the structure, surface morphology, and electrical–optical properties of ALD-AZO thin films.
Experimental
Transparent, conductive AZO thin films were deposited on Corning glass substrates using a Savannah series from Cambridge Nano Tech Inc. (MA/USA) at various growth temperatures (180–235 °C). The frequency ratio of Zn–O and Al–O cycles was constant at 19/1 to obtain AZO thin films with 999 layers per film. Diethylzinc, trimethylaluminum, and high-purity H2O were used as precursors of zinc, aluminum, and oxygen, respectively. During deposition, high-purity nitrogen gas with a flow rate of 200 SCCM was injected into the reaction chamber as a carrier and purging gas. The chamber pressure was 0.015 Torr. Prior to the deposition, the glass substrates were cleaned with Hellmanex, acetone, methanol, isopropyl, and deionized water to obtain an extremely clean substrate. After then, the substrates were dried at 100 °C for 24 h. The structural properties of AZO thin films were characterized by x-ray diffraction (XRD; Bruker-AXS D5005 Diffractometer, WA/USA). The morphologic properties were obtained via a Zeiss Gemini 500 field emission scanning electron microscopy (FESEM) (Jena/Germany). The elemental compositions were determined from a ZEISS LS-10 Life Science scanning electron microscopy (SEM) (Jena/Germany). A four-point in-line tip configuration (Veeco FPP5000, CA/USA) was used to determine sheet resistivity. UV–VIS–NIR spectra were obtained to examine the optical properties of the thin films using a PerkinElmer Lambda 950 spectrometer (MA/USA).
Results and discussion
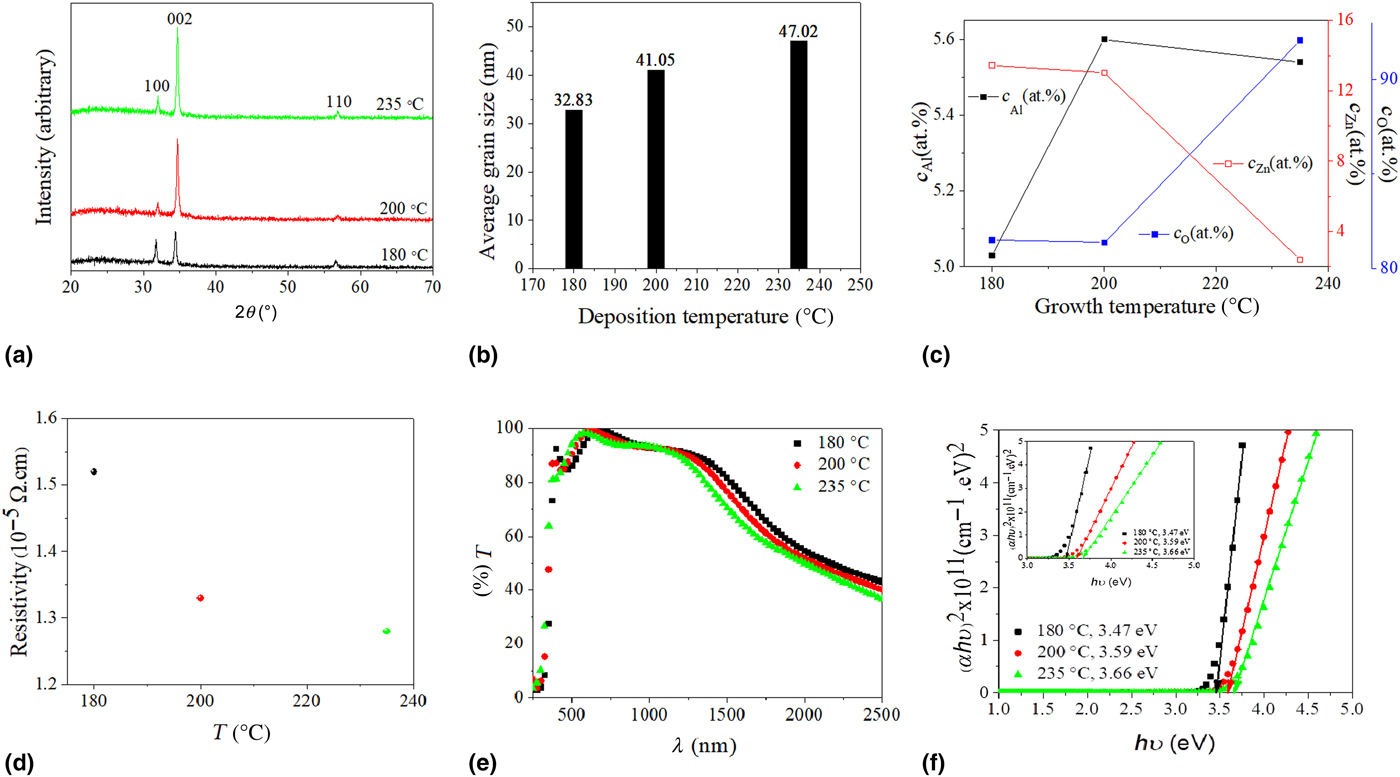
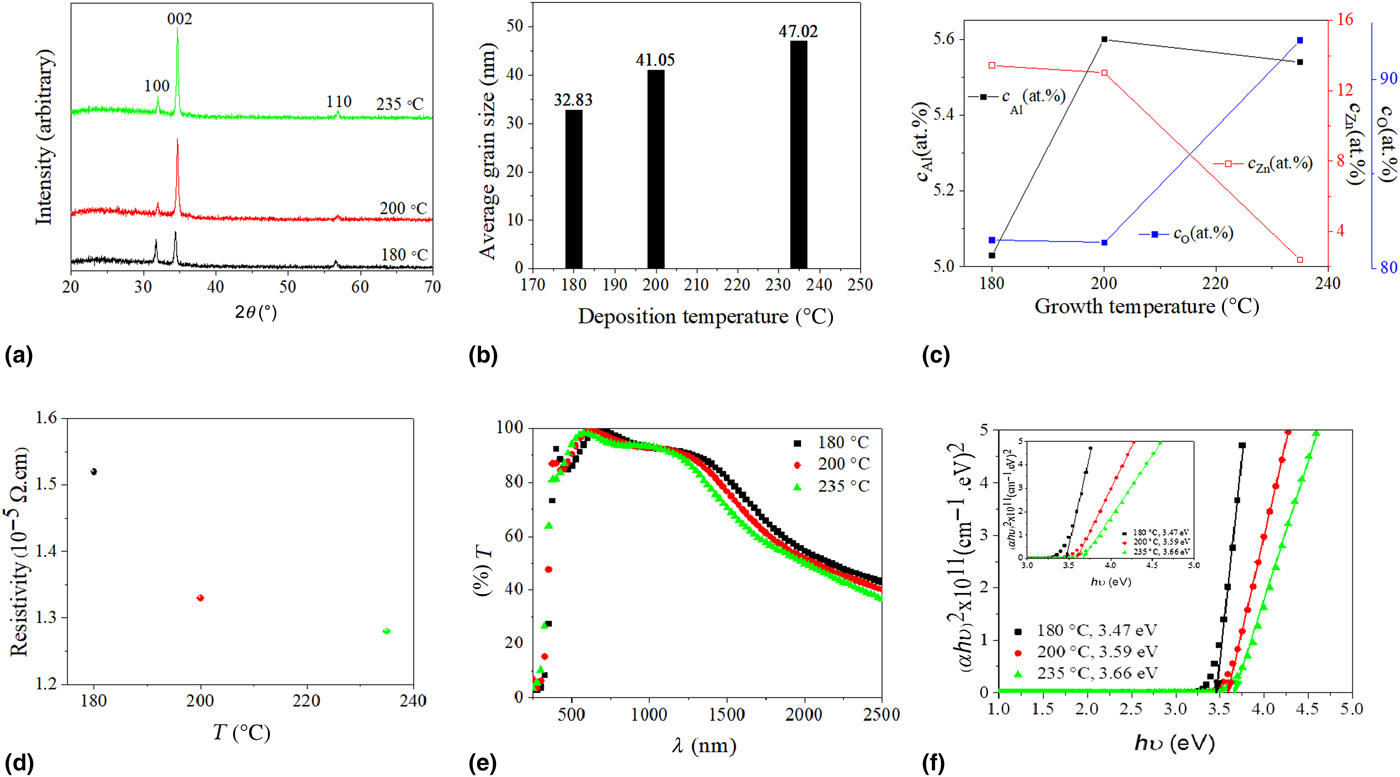
Figure 1(a) shows the XRD spectra of three AZO thin films, each grown at different temperatures (180, 200, and 235 °C). The peaks (2θ = 31.881°, 34.545°, and 56.701°) are well suited with (100), (002), and (110), respectively, of ZnO with the hexagonal Wurtzite structure. Secondary phases, such as Al2O3 or ZnAl2O3, are not present at least within the diffraction limit. Similar behavior was observed in the XRD pattern of thin films produced by Jilani et al.[Reference Jilani, Abdel-wahab, Al-ghamdi, Dahlan and Yahia11] using radio frequency (DC/RF) magnetron sputtering. In fact, the crystallinity of AZO is often reported to reach a plateau as substrate temperature is increased (200–300 °C) for both ALD and sputter deposition.[Reference Jilani, Abdel-wahab, Al-ghamdi, Dahlan and Yahia11,Reference Chang and Hon14,Reference Ahn, Lee and Cho15] It also appears that the crystallinity produced by ALD is better than that produced by DC/RF sputter deposition at the same temperature. The intensity of the (002) peak increased with deposition temperature more than that of the (100) and (110) peaks, which actually slightly decreased. Therefore, it appears that the AZO thin films became textured, with the close-packed planes parallel to the substrate, due to increased surface diffusion of the adatoms at elevated temperatures. This c-axis orientation is common to hexagonal structures because (002) planes have the lowest surface energy density and internal stress.[Reference Kumar, Ganesh, Shkir, AlFaify and Valanarasu10] The texture coefficient TC (hkl) was calculated using the following equation[Reference Prabua, Valanarasua, Ganesh, Shkir, AlFaify, Kathalingam, Srikumare and Chandramohan16,Reference Barret and Massalki17] and compared in Table I, where 1 is untextured.[Reference Kumar, Ganesh, Shkir, AlFaify and Valanarasu10]

TC(hkl) is the texture coefficient of (hkl) plane, I(hkl) is the intensity measured for (hkl) plane, I o(hkl) is the intensity of (hkl) plane taken from standard data in PDF cart, and N is the total reflection number. Another interesting point is that the lattice parameter of the thin films decreased with increased substrate temperature, as evidenced by the increasing diffraction angles (Fig. 1(a)).
(a) XRD spectra of AZO thin films. (b) Average grain size of AZO thin films as a function of substrate temperature. (c) Atomic ratio (%) of AZO thin films as a function of substrate temperature. (d) Change of resistivity of AZO thin films as a function of substrate temperature. (e) Transmittance (T%) spectra of AZO thin films. (f) (αhν)2-hν graphs of the AZO thin films.
Structural parameters of AZO thin films depending on deposition temperature. Texture coefficient (TC(200)), lattice parameters (a (Å) and c (Å)), unit cell volume (V (Å)), average grain size (D (nm)), dislocation density (δ (nm−2)), average micro-strain (ε), film thickness (t (nm)), resistivity (ρ (Ω cm)), the average transmittance (T) (590–890 nm), energy band gap (E g (eV)).

The lattice constants of AZO thin films were calculated using the following equation, assuming the Wurtzite hexagonal structure.[Reference Kumar, Ganesh, Shkir, AlFaify and Valanarasu10]

where (hkl) are the Miller indices of the particular planes, a = b and c are the lattice parameters, and d is the interplanar distance.[Reference Kumar, Ganesh, Shkir, AlFaify and Valanarasu10] The calculated lattice parameters and cell volumes were all approximately equivalent to the standard values (ICSD 01-075-0576, Table I). However, the lattice parameters decreased with an increasing deposition temperature as Al3+ occupied Zn2+ lattice sites[Reference Dasgupta, Neubert, Lee, Trejo, Lee and Prinz18] because the ionic radius of the Zn2+ (0.74 Å) is bigger than that of Al3+ (0.53 Å).[Reference Choi, Gong, Johnson, Golledge, Yeom and Park12] The average grain size was determined by the Scherrer formula, Eq. (3) (Fig. 1(b), Table I).

where λ is the X-ray wavelength (λ = 1.5405 Å), β is the angular width at half maximum intensity (FWHM) of the peak, and θ is the Bragg angle.[Reference Warren19,Reference Barhoumi, Leroy, Duponchel, Gest, Yang, Waldhoff and Guermazi20] As expected, the AZO film obtained at the highest temperature, 235 °C, has the largest grain size (Fig. 1(b) and Table I). The dislocation density and micro-strain of the AZO thin films were also calculated using the following equations.[Reference Kumar, Ganesh, Shkir, AlFaify and Valanarasu10]


where β is the full-width half-maximum and θ the diffraction angle.[Reference Kumar, Ganesh, Shkir, AlFaify and Valanarasu10] Again, it is observed that the thin films obtained at the highest substrate temperature (235 °C) had the lowest dislocation density and micro-strain. These results are summarized in Table I. The values in Table I indicate that overall film quality is improved with an increasing deposition temperature. Similar observations were reported by Kumar et al.[Reference Kumar, Ganesh, Shkir, AlFaify and Valanarasu10] and Barhoumi et al.[Reference Barhoumi, Leroy, Duponchel, Gest, Yang, Waldhoff and Guermazi20]
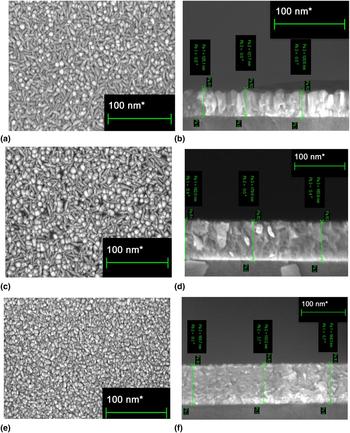
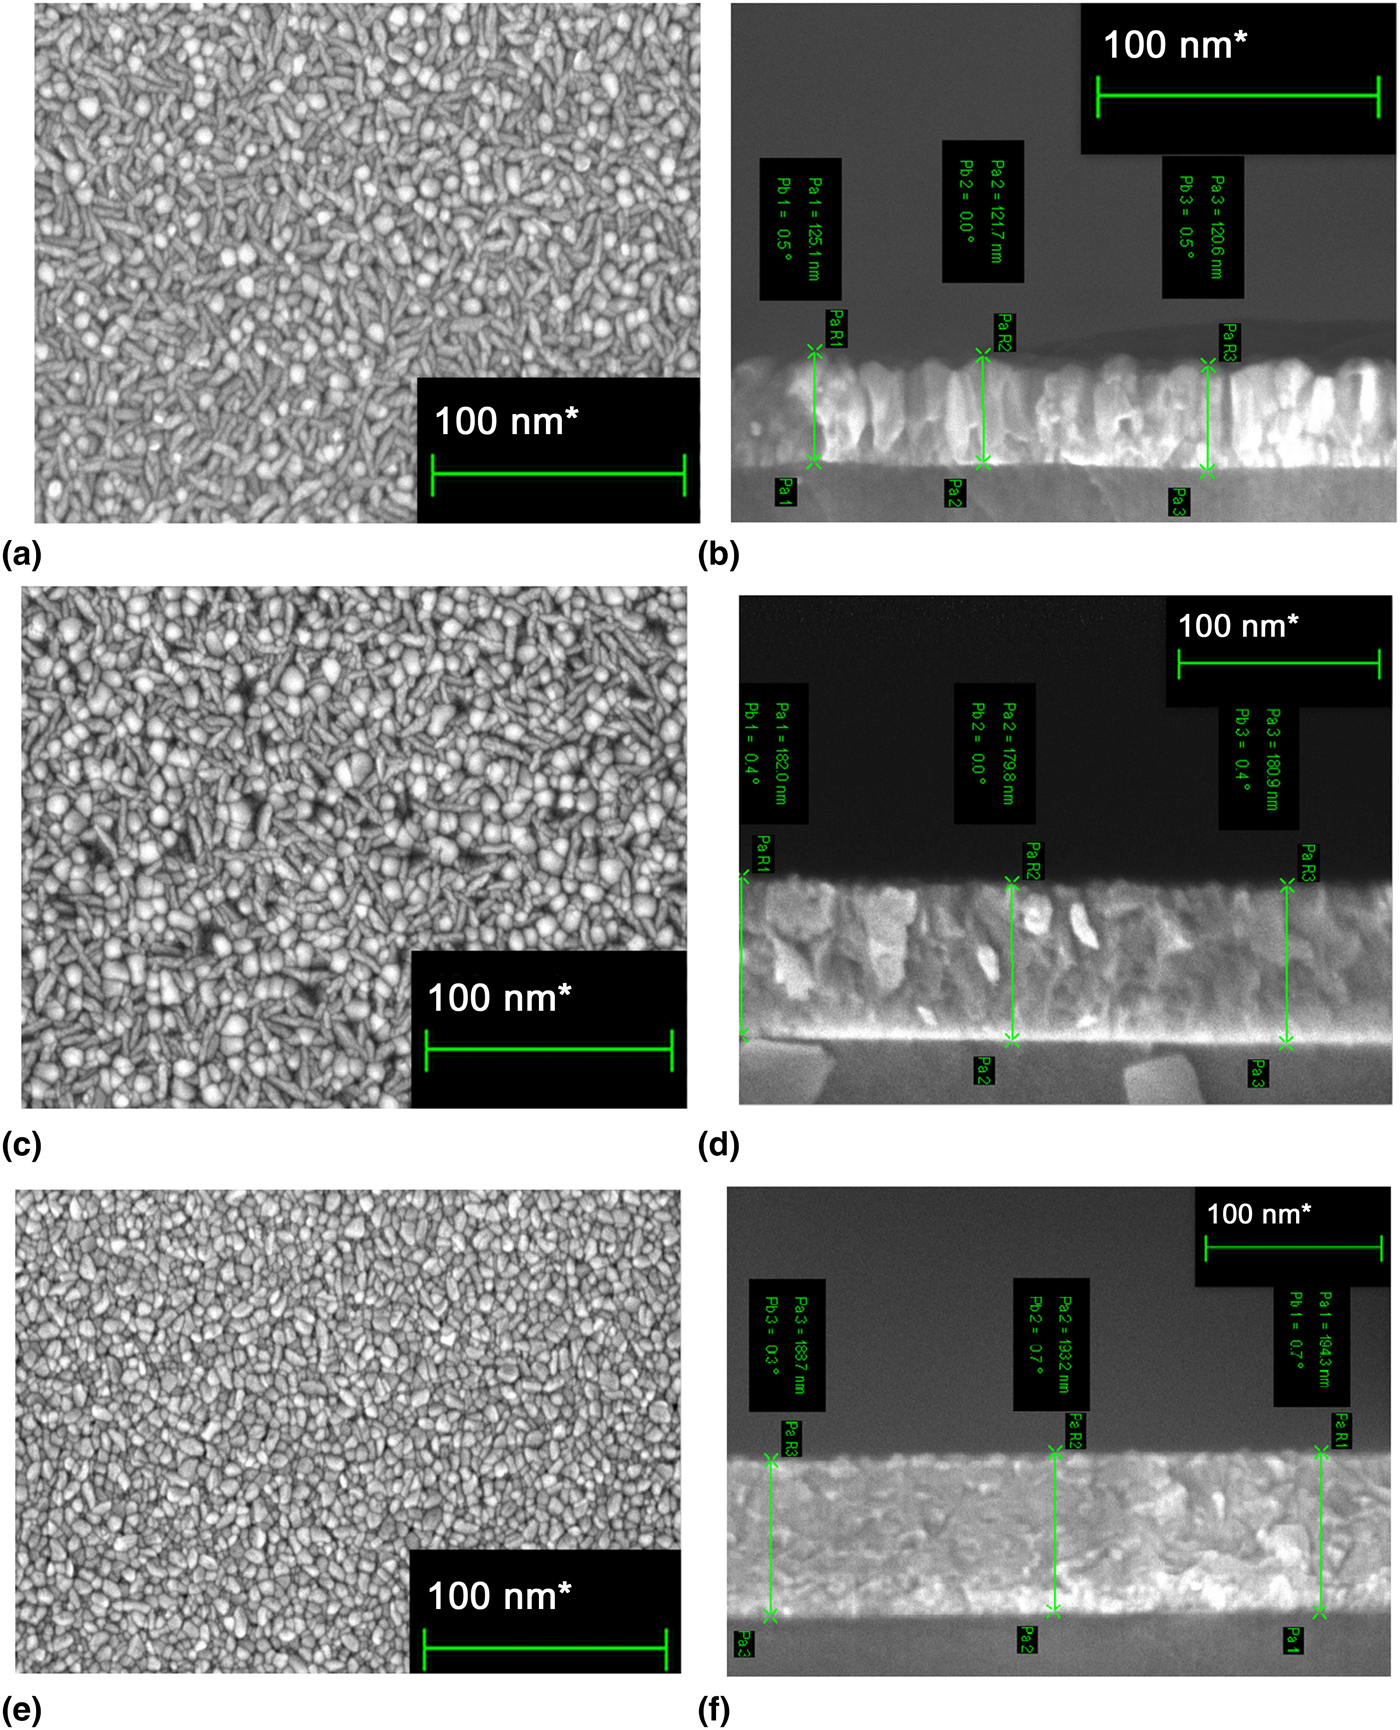
Figure 2 shows FESEM top-view and cross-section images of the AZO films obtained at different substrate temperatures. As seen via the texturing and Sherrer analysis above, the grain size and shape gradually change with deposition temperature. The grains appear to be a mixture of typical columnar (zone 2 of Thorton Diagram) and plate-like grains at low substrate temperatures (Fig. 2). The same shapes and sizes were observed by other researchers[Reference Ahn, Lee and Cho15,Reference Dasgupta, Neubert, Lee, Trejo, Lee and Prinz18] where there are mixed c-axis and other orientations. With increased substrate temperatures, the grains become more equiaxed as is characteristic of zone 3 structures in the Thorton Diagram. In physical vapor deposition, like sputtering, equiaxed grains typically only occur when substrate temperatures are over 0.8× the melting temperature of the film material. For ZnO, this would be about 1000 °C. It is therefore interesting that the slow layer by layer growth of ALD enables these high-quality structures at much lower temperatures. The observed grain sizes agree with those determined using the Scherrer equation.
Surface and cross-sectional FESEM of AZO thin films deposited at ((a) and (b)) 180 °C, ((c) and (d)), 200 °C, and ((e) and (f)) 235 °C.
EDX was used to determine the atomic ratio (%) of Al and Zn. According to data, the atomic ratio of Al increased with increasing the growth temperature while that of Zn decreased with increasing the growth temperature (Fig. 1(c)). The reason is that the growth rates of the ZnO and Al2O3 change with temperatures. The similar behavior was observed by Steglich et al.[Reference Steglich, Bingel, Jia and Falk21] and Szyszka.[Reference Szyszka22]
With the structural variations mentioned above, it is not surprising that the resistivity of the thin films was also dependent on the deposition temperature (Fig. 1(d)). It was also not surprising that the resistivity decreased with increasing deposition temperature due to less scattering as the grain size increased. What is surprising is the very low values of resistivity that were measured (1.52 × 10⁻⁵, 1.33 × 10⁻⁵, and 1.28 × 10⁻⁵ Ω cm). These values are lower than that of the films typically obtained via ALD and the other methods. Balaprakash et al.[Reference Balaprakash, Gowrisankar, Sudha and Rajkumar23] used a sol–gel to deposit AZO on glass for resistivity of 3.2 × 10⁻² Ω cm. Gu et al.[Reference Gu, Hu, Guo, Wu, Wang, Wang, Yua, Wei, Zheng, Wang and Chen24] fabricated AZO via RF sputtering for resistivity of 3.4 × 10⁻³ Ω cm. Dasgupta et al.[Reference Dasgupta, Neubert, Lee, Trejo, Lee and Prinz18] measured resistivity of AZO deposited on borosilicate glass substrates at 200 °C as 3.0 × 10⁻³ Ω cm. Choi et al.[Reference Choi, Gong, Johnson, Golledge, Yeom and Park12] measured ALD-grown (at 250 °C) AZO films on Si and glass as 5.876 × 10⁻⁴ Ω cm. Wen et al.[Reference Wen, Sahu, Kim and Han25] sputtered AZO for 5.2 × 10⁻⁴ Ω cm. Up to now, Agura et al.[Reference Agura, Suzuki, Matsushita, Aoki and Okuda26] reported the lowest resistivity of 8.5 × 10⁻⁵ Ω cm for AZO films deposited by PLD that had similar grain sizes to the films presented here. According to this comparison, the thin films obtained in this study have the lowest resistivity which we attribute to high-purity precursors, high nitrogen-flow rates, and low processing pressures. While this may result in lower yield (film: precursor ratio), the high-quality films may be worth the expense for some applications. These AZO thin films have much promise for transparent conductors because in addition to low resistivity, they had excellent transparency (>90%) over a wide wavelength range (360–1200 nm, Fig. 1(d)). To date, transmission windows from 380 to 780 nm are available with 86.40% transmission with resistivities limited to approximately 1.97 × 10⁻³ Ω cm. For lower resistivities (5.876 × 10⁻⁴ Ω cm), transmission windows decrease to 380–780 nm with 85.93% transmission.[Reference Choi, Gong, Johnson, Golledge, Yeom and Park12] Kim et al.[Reference Kim, Osofsky, Prokes, Glembocki and Pique27] observed transmission values of 80.1% with 4.7 × 10⁻⁴ Ω cm resistivity, or transmission values of 90.6% with 5.85 × 10⁻³ Ω cm resistivity. Here, we present a process to make AZO films with 96.4% transmission over 590–890 nm with 1.28 × 10⁻⁵ Ω cm resistivity, or 98.4% transmission with 1.52 × 10⁻⁵ Ω cm resistivity. Variations in transmission are likely due to the scattering of light from grains, where grains closest to quarter-wavelength will cause the most scattering, in this case, those deposited at higher temperatures.[Reference Vorobyeva, Rumyantseva, Vasiliev, Kozlovskiy, Soshnikova, Filatova, Zaytsev, Zaytseva and Gaskov28] Additionally, the transmittance ratio of the films decreases at long infrared wavelengths (Fig. 1(e)). This phenomenon can be explained via Drude's model. According to this model, as the carrier concentration increases with increasing film thickness (Table I), the transmittance is reduced.[Reference Frank and Kostlin29]
To determine direct energy band gap values of the thin films, the following equation was used,

where α is the absorption coefficient, K is a constant, hν is photon energy and E g is the band gap energy.[Reference Tauc, Grigorovici and Vancu30] The (αhν)2 versus (hν) plot for the AZO thin films is shown in Fig. 1(f). The values of the direct band gap were found to be 3.47, 3.59, and 3.66 eV for the films deposited at 180, 200, and 230 °C, respectively.[Reference Choi, Gong, Johnson, Golledge, Yeom and Park12,Reference Chang and Hon14,Reference Ahn, Lee and Cho15] A widening band gap with increased deposition temperature was also observed by Ahn et al.[Reference Ahn, Lee and Cho15]. As compared with the optical band gap of pure ZnO film, 3.2 eV,[Reference Kim and Tai31] these values are high and increase with increasing the deposition temperature. The reason may be ascribed to the Burstein–Moss effect.[Reference Xia, Wang, Shi, Zhang, Hea, Lv and Suna32] At elevated temperatures, more Al3+ atoms diffuse into the ZnO layer and then can partially replace the Zn2+ sites. So, the absorption edge acts to increase energies further than the band gap of pure ZnO.[Reference Choi, Gong, Johnson, Golledge, Yeom and Park12]
The extinction coefficient (k) and refractive index (n) values were estimated from the following equations[Reference Benramdane, Murad, Misho, Ziane and Kebbab33]:

and

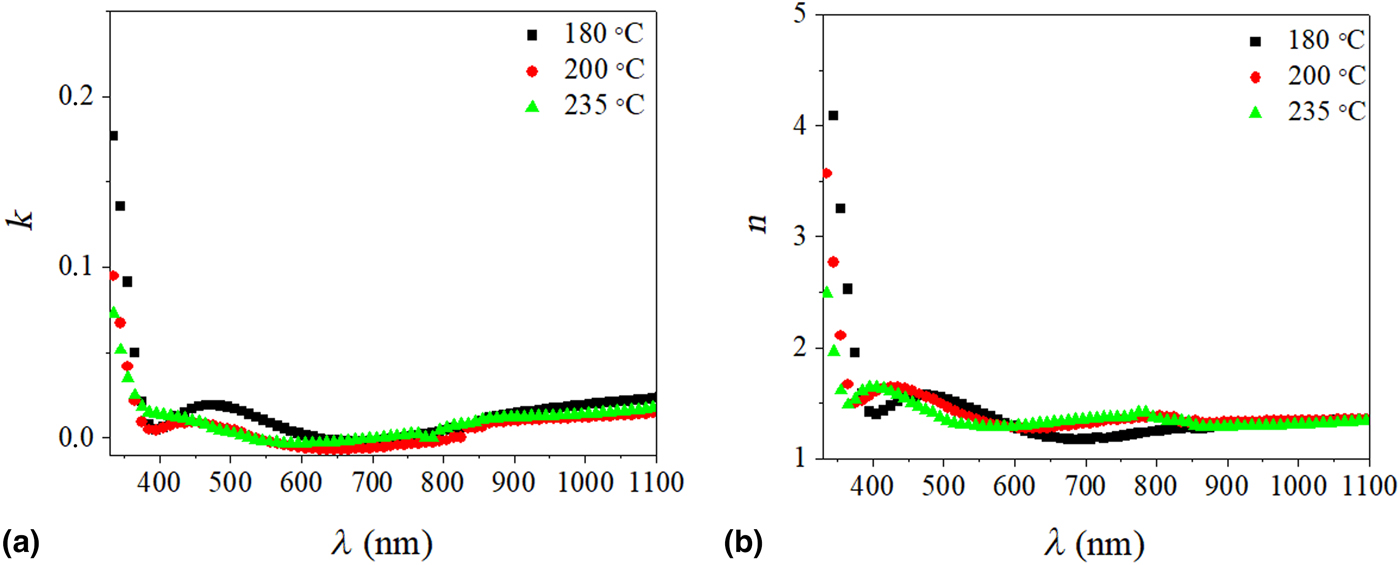
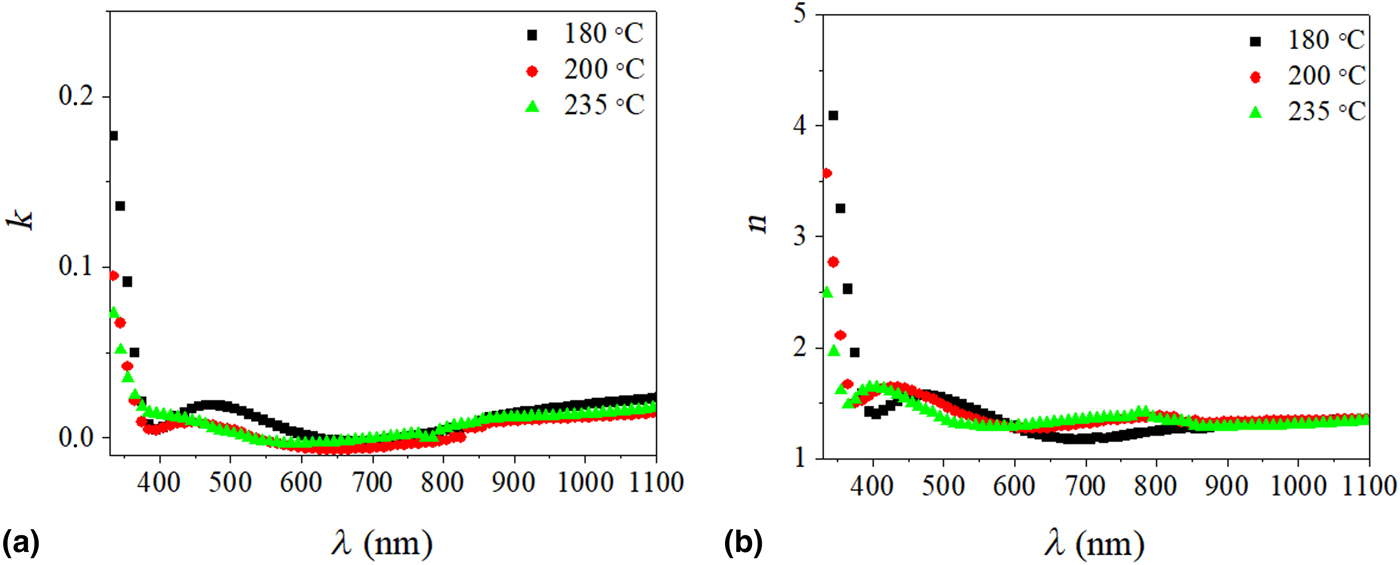
(Figs. 3(a) and 3(b)). k varied from 0.017 to 0.003 at 500 nm, which are very low, similar to that observed by Zheng et al.[Reference Zheng, Zhang, Li, Chen, Wang, Zheng, Li, Hu, Dai and Chen34] (Fig. 3(a)). Optical indices were measured to be 1.54–1.36 at 500 nm (Fig. 3(b)). Similar values for the refractive index were reported by Mihaiu et al.[Reference Mihaiu, Toader, Anastasescu, Gabor, Petrisor, Stoica and Zaharescu35]. These variations in the refractive index while maintaining low k values could be useful in future photonic crystals that maximize transparency and conductivity together. Dielectric coefficients of the thin films were calculated from the following equations[Reference Hodgson36]:


According to results, ε 1 (3.36–1.83) and ε 2 (0.054–0.006) values also changed with the substrate temperature. The figures of dielectric coefficients can be found in Supplementary Material. The calculated values were low, as expected for the high (95%) optical transparency of the thin films.
(a) Extinction coefficient (k) and (b) refractive index (n) of AZO thin films.
Conclusion
This work shows the structural, electrical, and optical properties of AZO thin films that were obtained using ALD at growth temperatures from 180 to 235 °C. These thin (122.5–192.1 nm) films were grown on commercial glass, and they had hexagonal Wurtzite structures. The grain size and texturing increased with increasing the growth temperature. In addition, the films densified with lower dislocation density and micro-strain. Thanks to an increasing grain size from 32.830 to 47.020 nm, the resistivity decreased from 1.52×10⁻⁵ to 1.28×10⁻⁵ Ω cm. Moreover, >90% transparency was obtained for more than the entire visible range (360–1200 nm), and the 96% transparency at 600 nm indicated that only reflection type interference prevented even higher values for the whole range. Reflection engineering can, therefore, be used for future improvements. The optical band gap of the thin films increased from 3.46 to 3.68 eV with increasing in the substrate temperature. Low resistivity, high optical transparency, and a wide bandgap indicate that these films are very good candidates for optical instruments such as solar cells.
Supplementary Material
The supplementary material for this article can be found at https://doi.org/10.1557/mrc.2019.82.
Acknowledgment
This work was supported by the Scientific and Technical Research Council of Turkey (TUBITAK) under Grant No. 1059B191200565-ID 893022. Portions of this work were conducted in the Minnesota Nano Center, which is supported by the National Science Foundation through the National Nano Coordinated Infrastructure Network (NNCI) under Award No. ECCS-1542202.