







1. Introduction
Turbulent convection driven by buoyancy and subject to background rotation is a phenomenon of great relevance in many physical disciplines, especially in geo- and astrophysics and also in engineering applications. In a model system of Rayleigh–Bénard convection (RBC) (Bodenschatz, Pesch & Ahlers Reference Bodenschatz, Pesch and Ahlers2000; Ahlers, Grossmann & Lohse Reference Ahlers, Grossmann and Lohse2009; Lohse & Xia Reference Lohse and Xia2010), a fluid is confined in a container where the bottom is heated, the top is cooled and the vertical walls are adiabatic. The temperature inhomogeneity leads to a fluid density variation, which, in the presence of gravity, produces convective fluid motion. When the system rotates with respect to the vertical axis, significant modification of the flow occurs owing to the rotational influence, including the suppression of the onset of convection (Nakagawa & Frenzen Reference Nakagawa and Frenzen1955; Chandrasekhar Reference Chandrasekhar1961), the enhancement or suppression of turbulent heat transport over different ranges of Rayleigh number  ${Ra}$ and Prandtl number
 ${Pr}$ (Rossby Reference Rossby1969; Pfotenhauer, Niemela & Donnelly Reference Pfotenhauer, Niemela and Donnelly1987; Zhong, Ecke & Steinberg Reference Zhong, Ecke and Steinberg1993; Julien et al. Reference Julien, Legg, McWilliams and Werne1996; Liu & Ecke Reference Liu and Ecke1997), the transformation of thermal plumes into thermal vortices with a rich variety of local structure dynamics (Boubnov & Golitsyn Reference Boubnov and Golitsyn1986, Reference Boubnov and Golitsyn1990; Hart, Kittelman & Ohlsen Reference Hart, Kittelman and Ohlsen2002; Vorobieff & Ecke Reference Vorobieff and Ecke2002) and the emergence of robust wall modes before the onset of the bulk mode (Buell & Catton Reference Buell and Catton1983; Pfotenhauer et al. Reference Pfotenhauer, Niemela and Donnelly1987; Zhong, Ecke & Steinberg Reference Zhong, Ecke and Steinberg1991; Ecke, Zhong & Knobloch Reference Ecke, Zhong and Knobloch1992; Goldstein et al. Reference Goldstein, Knobloch, Mercader and Net1993; Herrmann & Busse Reference Herrmann and Busse1993; Kuo & Cross Reference Kuo and Cross1993).
The dimensionless control parameters in rotating RBC are the Rayleigh number  ${Ra} \equiv \alpha g \varDelta H^3/(\kappa \nu )$, the Prandtl number
 ${Pr}\equiv \nu /\kappa$, the Ekman number
 ${\textit {Ek}}\equiv \nu /(2\varOmega H^2)$ and the diameter-to-height aspect ratio of the container,
 $\varGamma \equiv D/H$. Here
 $\alpha$ denotes the isobaric thermal expansion coefficient,
 $\nu$ the kinematic viscosity,
 $\kappa$ the thermal diffusivity of the fluid,
 $g$ the acceleration due to gravity,
 $\varOmega$ the angular rotation rate,
 $\varDelta \equiv T_+-T_-$ the difference between the temperatures at the bottom (
 $T_+$) and top (
 $T_-$) plates,
 $H$ the distance between the isothermal plates (the cylinder height) and
 $D\equiv 2R$ the cylinder diameter. The Rossby number
 ${Ro} \equiv {\sqrt {\alpha g\varDelta H}}/({2 \varOmega H}) = \sqrt {{Ra}/{\textit {Pr}}} \,{\textit {Ek}}$ is another important non-dimensional parameter that provides a measure of the balance between buoyancy and rotation and is independent of dissipation coefficients.
The important global response parameter in thermal convection is the averaged total heat transport between the bottom and top plates, described by the Nusselt number,  ${Nu}\equiv (\langle u_zT \rangle _{z}-\kappa \partial _z\langle {T}\rangle _{z})/(\kappa \varDelta /H)$. Here,
 $T$ denotes the temperature,
 $\boldsymbol {u}$ is the velocity field with component
 $u_z$ in the vertical direction, and
 $\langle \cdot \rangle _{z}$ denotes the average in time and over a horizontal cross-section at height
 $z$ from the bottom.
Rotation has various effects on the structure of the convective flow and on the global heat transport in the system. Rotation inhibits convection and causes an increase of the critical  ${Ra}_c \sim {\textit {Ek}}^{-4/3}$ at which the quiescent fluid layer becomes unstable throughout the layer (Nakagawa & Frenzen Reference Nakagawa and Frenzen1955; Chandrasekhar Reference Chandrasekhar1961; Rossby Reference Rossby1969; Lucas, Pfotenhauer & Donnelly Reference Lucas, Pfotenhauer and Donnelly1983; Zhong et al. Reference Zhong, Ecke and Steinberg1993). In finite containers and at sufficiently large rotation rates, however, a different instability occurs at lower
 ${Ra}_w \sim {\textit {Ek}}^{-1}$ in the form of anticyclonically drifting wall modes (Buell & Catton Reference Buell and Catton1983; Pfotenhauer et al. Reference Pfotenhauer, Niemela and Donnelly1987; Zhong et al. Reference Zhong, Ecke and Steinberg1991; Ecke et al. Reference Ecke, Zhong and Knobloch1992; Goldstein et al. Reference Goldstein, Knobloch, Mercader and Net1993; Herrmann & Busse Reference Herrmann and Busse1993; Kuo & Cross Reference Kuo and Cross1993; Ning & Ecke Reference Ning and Ecke1993; Zhong et al. Reference Zhong, Ecke and Steinberg1993; Goldstein et al. Reference Goldstein, Knobloch, Mercader and Net1994; Liu & Ecke Reference Liu and Ecke1997, Reference Liu and Ecke1999; Zhang & Liao Reference Zhang and Liao2009; Favier & Knobloch Reference Favier and Knobloch2020). The relative contribution of the wall modes to the total heat transport depends on
 $\varGamma$ (Rossby Reference Rossby1969; Pfotenhauer et al. Reference Pfotenhauer, Niemela and Donnelly1987; Ning & Ecke Reference Ning and Ecke1993; Zhong et al. Reference Zhong, Ecke and Steinberg1993; Liu & Ecke Reference Liu and Ecke1999) with decreasing contribution – roughly as the perimeter-to-area ratio – with increasing
 $\varGamma$.
There are several regions of bulk rotating convection where rotation plays an important role, namely a rotation-affected regime and a rotation-dominated regime. In the former, where  ${Ro} \lesssim 1$, heat transport varies as a power law in
 ${Ra}$, i.e.
 ${Nu} = A({\textit {Ek}}) {Ra}^{0.3}$, and can be enhanced or weakly suppressed by rotation relative to the heat transport without rotation (Rossby Reference Rossby1969; Zhong et al. Reference Zhong, Ecke and Steinberg1991; Julien et al. Reference Julien, Legg, McWilliams and Werne1996; Liu & Ecke Reference Liu and Ecke1997; King et al. Reference King, Stellmach, Noir, Hansen and Aurnou2009; Liu & Ecke Reference Liu and Ecke2009; Zhong et al. Reference Zhong, Stevens, Clercx, Verzicco, Lohse and Ahlers2009) depending on the range of
 ${Ra}$ and
 $Pr$. In the latter case, in which
 ${Ro} \ll 1$, heat transport changes much more rapidly with
 ${Ra}$ in what is known as the geostrophic regime of rotating convection (Sakai Reference Sakai1997; Grooms et al. Reference Grooms, Julien, Weiss and Knobloch2010; Julien et al. Reference Julien, Knobloch, Rubio and Vasil2012; Ecke & Niemela Reference Ecke and Niemela2014; Stellmach et al. Reference Stellmach, Lischper, Julien, Vasil, Cheng, Ribeiro, King and Aurnou2014; Cheng et al. Reference Cheng, Madonia, Guzmán and Kunnen2020).
Despite considerable previous work, the spatial distribution of flow and heat transport in confined geometries has not been well studied for high  ${Ra}$ and low
 ${Ro}$ when one is significantly above the onset of bulk convection but still highly affected by rotation. Recently, Zhang et al. (Reference Zhang, van Gils, Horn, Wedi, Zwirner, Ahlers, Ecke, Weiss, Bodenschatz and Shishkina2020) demonstrated in direct numerical simulations (DNS) and experiments that a boundary zonal flow (BZF) develops near the vertical wall of a slender cylindrical container (
 $\varGamma =1/2$) in rapidly rotating turbulent RBC for
 ${Pr}=0.8$ (pressurized gas SF
 $_6$) and over broad ranges of
 ${Ra}$ (
 ${Ra}=10^9$ in DNS and for
 $10^{11} \lesssim {Ra} \lesssim 10^{14}$ in experiments) and
 ${\textit {Ek}}$ (
 $10^{-6} \lesssim {\textit {Ek}} \lesssim 10^{-5}$ in the DNS and for
 $3 \times 10^{-8} \lesssim {\textit {Ek}} \lesssim 3 \times 10^{-6}$ in experiments). The BZF becomes the dominant mean flow structure in the cell for
 ${Ro} \lesssim 1$, at which the large-scale mean circulation (termed the large-scale circulation; LSC) vanishes (Vorobieff & Ecke Reference Vorobieff and Ecke2002; Kunnen et al. Reference Kunnen, Clercx, Geurts, van Bokhoven, Akkermans and Verzicco2008; Weiss & Ahlers Reference Weiss and Ahlers2011a,Reference Weiss and Ahlersb). Further, it contributes a disproportionately large fraction of the total heat transport.
Another group (de Wit et al. Reference de Wit, Guzman, Madonia, Cheng, Clercx and Kunnen2020) also showed the existence of the BZF and its strong influence on heat transport using DNS for  ${Pr}=5$ (water) and
 $\varGamma =1/5$ for
 ${\textit {Ek}} = 10^{-7}$ in the range
 $5 \times 10^{10} \lesssim {Ra} \lesssim 5 \times 10^{11}$. Thus, the BZF has been observed in different fluids, in cells of different aspect ratios and over a wide range of parameter values. Given the strongly enhanced heat transport in the BZF region (de Wit et al. Reference de Wit, Guzman, Madonia, Cheng, Clercx and Kunnen2020; Zhang et al. Reference Zhang, van Gils, Horn, Wedi, Zwirner, Ahlers, Ecke, Weiss, Bodenschatz and Shishkina2020), it is important to explore the BZF in detail. Here we investigate the robustness of the BZF with respect to
 ${Pr}$ and to
 $\varGamma$ in the geostrophic regime; we do not address here the transition from the low rotation state to the BZF.
Recently, Favier & Knobloch (Reference Favier and Knobloch2020) demonstrated for  $Ek = 10^{-6}$ through DNS that the linear wall modes of rotating convection (Buell & Catton Reference Buell and Catton1983; Zhong et al. Reference Zhong, Ecke and Steinberg1991; Ecke et al. Reference Ecke, Zhong and Knobloch1992; Goldstein et al. Reference Goldstein, Knobloch, Mercader and Net1993; Herrmann & Busse Reference Herrmann and Busse1993; Kuo & Cross Reference Kuo and Cross1993; Ning & Ecke Reference Ning and Ecke1993; Zhong et al. Reference Zhong, Ecke and Steinberg1993; Liu & Ecke Reference Liu and Ecke1997, Reference Liu and Ecke1999; Sánchez-Álvarez et al. Reference Sánchez-Álvarez, Serre, del Arco and Busse2005; Horn & Schmid Reference Horn and Schmid2017; Aurnou et al. Reference Aurnou, Bertin, Grannan, Horn and Vogt2018) evolve with increasing
 ${Ra}$ and appear to be robust with respect to the emergence of bulk convection even with well-developed turbulence. They suggested that the BZF may be the nonlinear evolution of wall modes, an idea that we address briefly but that requires significantly more analysis and comparison than can be included here.
In the present work, a series of DNS is carried out to study the robustness and the scaling properties of the BZF with respect to Rayleigh number  ${Ra}$, Ekman number
 ${\textit {Ek}}$, Prandtl number
 ${Pr}$ and cell aspect ratio
 $\varGamma$. We explore the extended scalings of the characteristics of the BZF, including the width of the BZF, the drift frequency of the BZF and the heat transport within the BZF in terms of these non-dimensional parameters. We first present our numerical methods, then discuss the results of our calculations and conclude with our main findings.
2. Numerical method
We present results of DNS of rotating RBC in a cylindrical cell obtained using the goldfish code (Shishkina et al. Reference Shishkina, Horn, Wagner and Ching2015; Kooij et al. Reference Kooij, Botchev, Frederix, Geurts, Horn, Lohse, van der Poel, Shishkina, Stevens and Verzicco2018) for  ${Ra}$ up to
 $5\times 10^{9}$ and
 ${\textit {Ek}}$ down to
 $10^{-7}$. In the DNS, the Oberbeck–Boussinesq approximation is assumed as in Horn & Shishkina (Reference Horn and Shishkina2014). Centrifugal force effects are neglected since the Froude number in experiments is typically small (see Zhong et al. Reference Zhong, Stevens, Clercx, Verzicco, Lohse and Ahlers2009; Horn & Shishkina Reference Horn and Shishkina2015).
The governing equations based on the Oberbeck–Boussinesq approximation are
 \begin{gather} \boldsymbol{\nabla}\boldsymbol{\cdot}\boldsymbol{u}=0, \end{gather}
 \begin{gather}\partial_t \boldsymbol{u} + (\boldsymbol{u}\boldsymbol{\cdot}\boldsymbol{\nabla})\boldsymbol{u} ={-} \frac{1}{\rho}\boldsymbol{\nabla} p+ \nu\nabla^2 \boldsymbol{u} - 2\boldsymbol{\varOmega} \times \boldsymbol{u}+\alpha(T-T_0)g\boldsymbol{e}_z, \end{gather}
 \begin{gather}\partial_t T + (\boldsymbol{u}\boldsymbol{\cdot}\boldsymbol{\nabla}) T = \kappa\nabla^2 T. \end{gather}
Here,  $\boldsymbol {u}=(u_r,u_\phi ,u_z)$ is the velocity with radial, azimuthal and vertical coordinates, respectively,
 $\rho$ is the density,
 $p$ is the reduced pressure,
 $\boldsymbol {\varOmega }=\varOmega \boldsymbol {e}_z$ is the angular rotation-rate vector,
 $T$ is the temperature with
 $T_0=(T_++T_-)/2$, and
 $\boldsymbol {e}_z$ is the unit vector in the vertical direction. The applied boundary conditions are no slip for the velocity on all surfaces, constant temperature for the top and bottom plates and adiabatic for the sidewall. To non-dimensionalize the governing equations, we use
 ${\varDelta =T_+-T_-}$ as the temperature scale, the cylinder height
 $H$ as the length scale and the free-fall velocity
 $\sqrt {\alpha g \varDelta H}$ as the velocity scale (the corresponding time scale is
 $\tau _{ff} = \sqrt {H/ (\alpha g \varDelta )}$).
To evaluate the grid requirements for the simulations, we consider the thermal and velocity boundary layers (BLs) near solid boundaries. The thickness of the BLs near the heated and cooled plates are calculated as
 \begin{equation} \delta_{th}= H/(2{Nu}). \end{equation}
This is the standard way to define the thermal BL thickness under the assumption of pure conductive heat transport within this layer (cf. Ahlers et al. Reference Ahlers, Grossmann and Lohse2009). The viscous BL thicknesses near the plates ( $\delta _{u}$) and near the sidewall (
 $\delta ^{{sw}}$) are defined as the distances from the corresponding walls to the location where the maxima of, respectively,
 $\sqrt {\langle {u_r}^2\rangle _{t, \phi , r}+\langle {u_\phi }^2\rangle _{t, \phi , r}}\,(z)$ and
 $\sqrt {\langle {u_\phi }^2\rangle _{t, \phi , z}+\langle {u_z}^2\rangle _{t, \phi , z}}\,(r)$ are obtained. The velocity components are all averaged in time and over the surface parallel to the corresponding wall. The same criterion was used previously in studies of the sidewall layers in rotating convection (see Kunnen et al. Reference Kunnen, Stevens, Overkamp, Sun, van Heijst and Clercx2011).
The computational grids are set to be sufficiently fine to resolve the mean Kolmogorov microscales (Shishkina et al. Reference Shishkina, Stevens, Grossmann and Lohse2010) in the bulk and within the BLs (see table 2 in the Appendix). Grid nodes are clustered near the walls to resolve thermal and velocity BLs, resulting in grids that are non-equidistant in both the radial and vertical directions. As rotation increases, the viscous BL gets thinner (Kunnen et al. Reference Kunnen, Clercx, Geurts, van Bokhoven, Akkermans and Verzicco2008; Stevens, Verzicco & Lohse Reference Stevens, Verzicco and Lohse2010; Horn & Shishkina Reference Horn and Shishkina2015) so more points are required near boundaries: we take at least seven points within each BL. The details of all simulated parameters and the corresponding grid resolution are listed in table 2 along with a benchmark comparison between  ${Nu}$ data from these simulations and from experimental data in compressed gases with similar
 ${Pr}$ from Wedi et al. (Reference Wedi, Van Gils, Bodenschatz and Weiss2021); the agreement is excellent. To explore the robustness of the BZF with respect to
 ${Ra}$,
 ${Pr}$ and
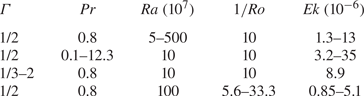
 $\varGamma$, we conducted simulations in three groups, i.e. in every group we vary only one parameter while keeping the others fixed. The specific parameter ranges are shown in table 1 (also included in several figures with
 ${Ra} = 10^9$ and
 ${Pr} = 0.8$ are data in the range
 $0.5 \leq 1/{Ro} \leq 5$ from Zhang et al. (Reference Zhang, van Gils, Horn, Wedi, Zwirner, Ahlers, Ecke, Weiss, Bodenschatz and Shishkina2020); the calculation details for those values are included in the Appendix).
Ranges of  $\varGamma$,
 ${Ra}$,
 ${Pr}$,
 ${Ro}^{-1}$ and
 ${\textit {Ek}}$. For details, see the Appendix.
Details of the DNS: including the time of statistical averaging,  $t_{{avg}}$, normalized with the free-fall time
 $\tau _{ff}$; the number of nodes
 $N_r$,
 $N_\phi$ and
 $N_z$ in the directions
 $r$,
 $\phi$ and
 $z$, respectively; the numbers of nodes within the thermal BL
 $\mathcal {N}_{{th}}$ (near the plates), within the viscous BL
 $\mathcal {N}_{{u}}$ (near the plates), and within the viscous BL
 $\mathcal {N}^{{sw}}_{{u}}$ (near the sidewall); the relative thicknesses of the viscous BL
 $\delta _u/H$ and the thermal BL near the plates
 $\delta _{th}/H$, and the viscous BL near the sidewall
 $\delta ^{{sw}}_{u}/H$; and the maximal value of the ratio of the mesh size to the mean Kolmogorov microscale,
 $\max (h/\eta _k)$.

3. Results
3.1. Boundary zonal flow structure
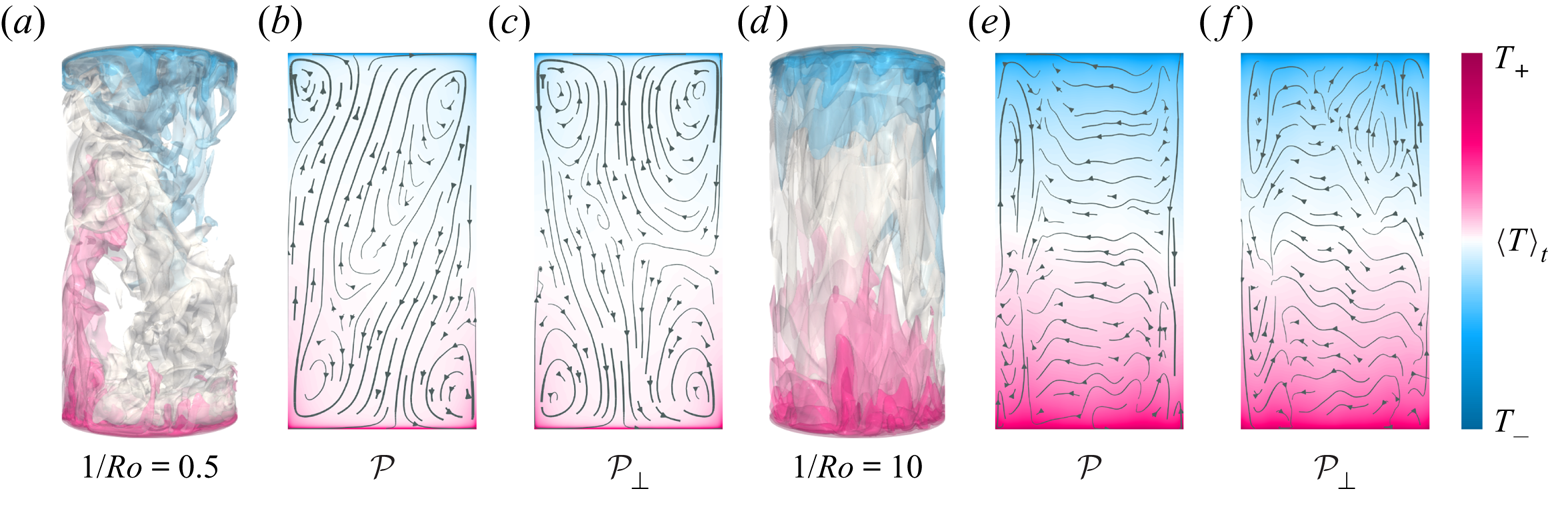
Our goal here is to explore the robustness of the BZF with respect to variations of control parameters. We follow closely the approach and characterization presented in Zhang et al. (Reference Zhang, van Gils, Horn, Wedi, Zwirner, Ahlers, Ecke, Weiss, Bodenschatz and Shishkina2020) but focus on the geostrophic regime where the BZF is well developed. After presenting our main results, we consider the BZF with respect to wall mode structures. We begin with the influence of rotation on the overall temperature and velocity fields in the cell. In figure 1, for particular cases of  $1/{Ro}=0.5$ (weak rotation) and
 $1/{Ro}=10$ (fast rotation), three-dimensional instantaneous temperature distributions (figure 1a,d) and two-dimensional vertical cross-sections (figure 1b,c,e,f) of the time-averaged flow fields are shown. The two-dimensional views are taken in a plane
 $\mathcal {P}$ (figure 1b,e), which in the case of a weak rotation is the LSC plane, and additionally in a plane
 $\mathcal {P}_\perp$ that is perpendicular to
 $\mathcal {P}$ (figure 1c,f). For slow rotation, an LSC spanning the entire cell with two secondary corner rolls is observed in
 $\mathcal {P}$ whereas a four-roll structure is seen in
 $\mathcal {P}_\perp$, typical of classical RBC at large
 ${Ra}$ and for
 $\varGamma \sim 1$ (see e.g. Shishkina, Wagner & Horn Reference Shishkina, Wagner and Horn2014; Zwirner et al. Reference Zwirner, Khalilov, Kolesnichenko, Mamykin, Mandrykin, Pavlinov, Shestakov, Teimurazov, Frick and Shishkina2020). Near the plates, the LSC and the secondary corner flows move the fluid towards the sidewall (figure 1b) so the Coriolis acceleration (
 $-2\varOmega \boldsymbol {e}_z\times \boldsymbol {u}$) induces anticyclonic fluid motion close to the plates.
Isosurfaces of instantaneous temperature  $T$
 $(a)$ and time-averaged flow fields
 $(b{,}c)$, visualized by streamlines (arrows) and temperature (colours), for
 ${Ra}=10^9$ and
 $1/{Ro}=10$, in vertical orthogonal planes
 $\mathcal {P}$
 $(b{,}e)$ and
 $\mathcal {P}_\perp$
 $(c{,}f)$. In the case of weak rotation
 $(a\text {--}c)$,
 $\mathcal {P}$ is the plane of the LSC
 $(b)$. Averaging in
 $(b{,}c)$ is conducted over 1000 free-fall time units. For strong rotation
 $(e{,}f)$, mean radial and axial velocity magnitudes are approximately 10-fold smaller than those for weak rotation
 $(b{,}c)$.
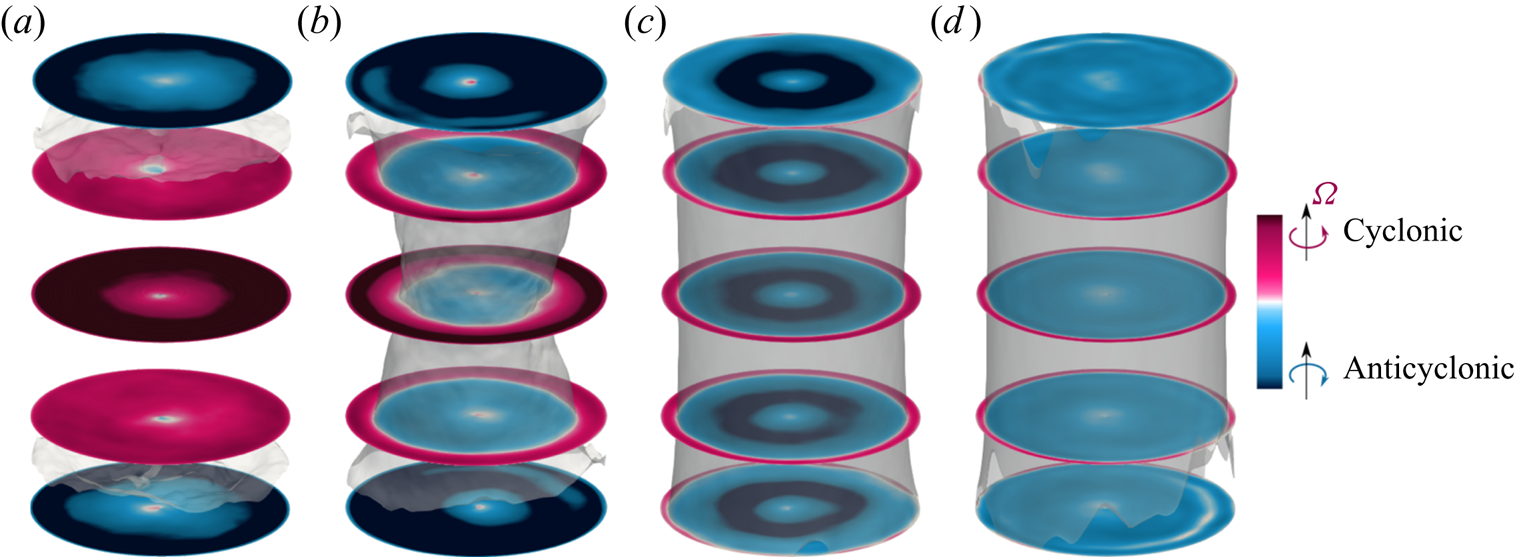
In the central part of the cell, at  $z=H/2$, the radial component of the mean velocity,
 $\langle u_r\rangle _t$, always points towards the cell centre (figure 1a,b). Therefore, Coriolis acceleration results in cyclonic fluid motion in the central part of the cell, as is also observed in the time-averaged azimuthal velocity field
 $u_{\phi }$ in figure 2(a). Cases at higher rotation rates are shown in figures 1(d–f) and 2 (see also Kunnen et al. Reference Kunnen, Stevens, Overkamp, Sun, van Heijst and Clercx2011). For both small and large rotation rates, the presence of viscous BLs near the plates implies anticyclonic motion of the fluid there. For strong rotation, the subject of this paper, with high and constant angular velocity
 $\varOmega$, the fluid velocity becomes more uniform along
 $\boldsymbol {e}_z$ owing to the Taylor–Proudman constraint with larger components of lateral velocity compared to the vertical component as in figure 1(e,f). Thus, anticyclonic fluid motion not only is present in the vicinity of the plates, but also involves more and more fluid volume with increasing
 ${Ro}^{-1}$. With increasing rotation rate, anticyclonic motion grows from the plates towards the cell centre whereas cyclonic motion at
 $z=H/2$ remains near the sidewall and becomes increasingly more localized there (figure 2c,d).
Time-averaged fields  $\langle u_{\phi }\rangle _t$ for
 ${Pr}=0.8$,
 $\varGamma =1/2$,
 ${Ra}=10^9$ and
 $(a)$
 $1/{Ro}=0.5$,
 $(b)$
 $1/{Ro}=2$,
 $(c)$
 $1/{Ro}=10$ and
 $(d)$
 $1/{Ro}=20$.
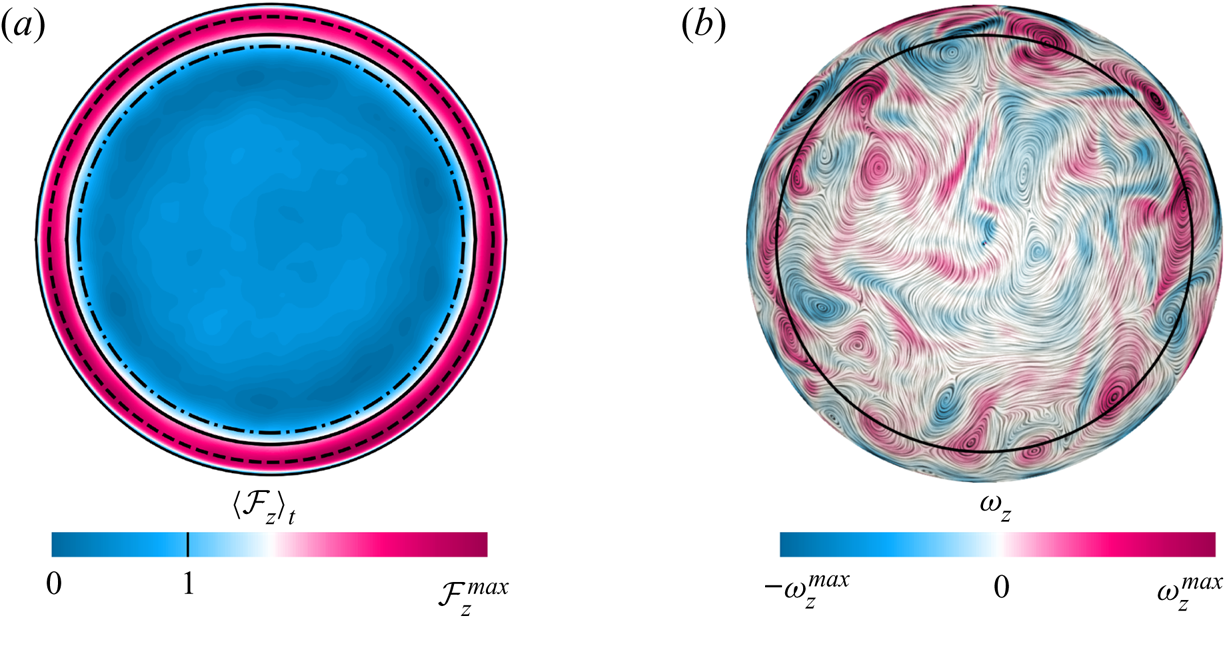
As introduced in Zhang et al. (Reference Zhang, van Gils, Horn, Wedi, Zwirner, Ahlers, Ecke, Weiss, Bodenschatz and Shishkina2020), the BZF in rapidly rotating turbulent convection is characterized by an anticyclonic bulk flow, cyclonic vortices clustering near the sidewall and anticyclonic drift of thermal plumes (see figures 3a,b and 4). These structures are associated with the bimodal temperature probability density functions (p.d.f.s) obtained in the measurements and DNS near the sidewall (Zhang et al. Reference Zhang, van Gils, Horn, Wedi, Zwirner, Ahlers, Ecke, Weiss, Bodenschatz and Shishkina2020; Wedi et al. Reference Wedi, Van Gils, Bodenschatz and Weiss2021). The radial location  $r_0$ where the mean fluid motion at
 $z/H=1/2$ changes from anticyclonic to cyclonic as indicated by the solid line in figure 3 (see also inset of figure 6a below) is used to describe the width of the BZF
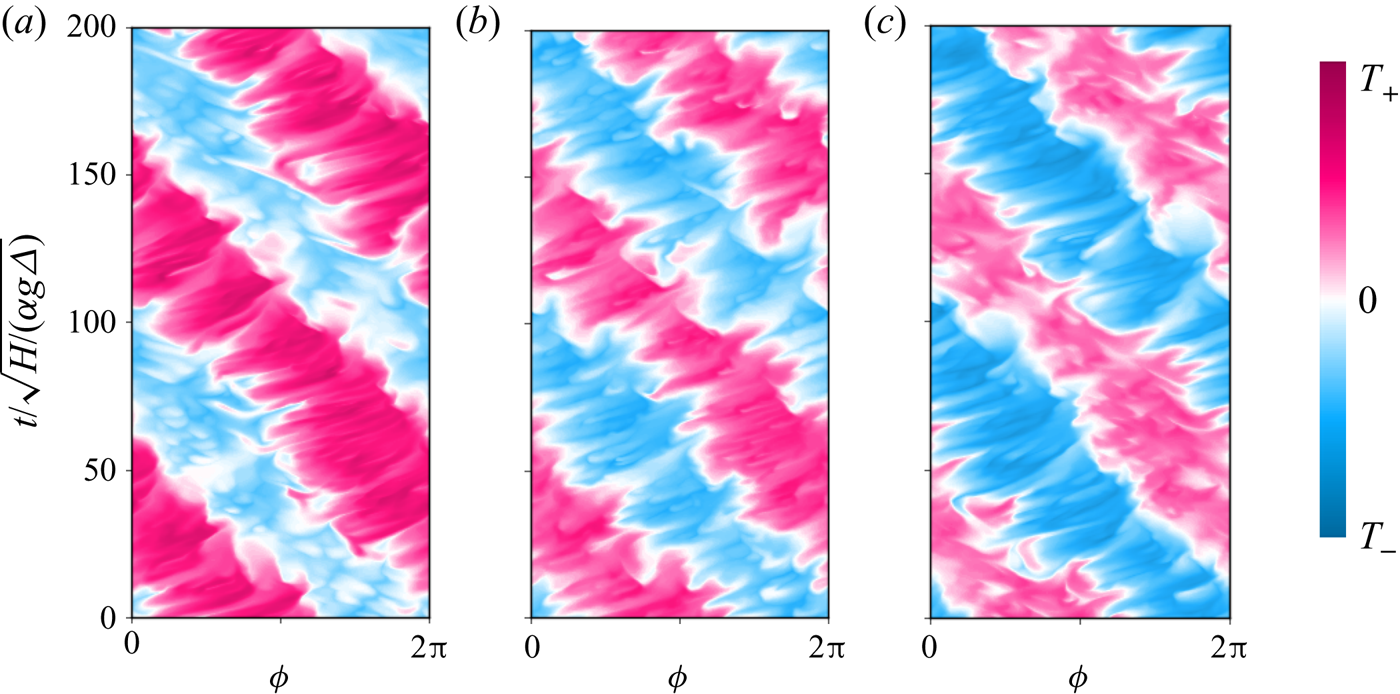
 $\delta _0 = R - r_0$. As one might expect, vertical coherence of the BZF is enhanced by strong rotation. In figure 4, time–angle plots of the temperature at three different heights show that the drift frequency
 $\omega = 2 {\rm \pi}R(\textrm {d}\phi (r_{u_\phi ^{max}})/\textrm {d}t)/(2 {\rm \pi}R/m) = m\,\textrm {d}\phi (r_{u_\phi ^{max}})/\textrm {d}t$ is quite constant along
 $z$ without significant phase differences, i.e. the BZF maintains good vertical coherence. Here, the mode number
 $m$ equals 1 and
 $\textrm {d}\phi (r_{u_\phi ^{max}})/\textrm {d}t$ denotes the angular velocity of the temperature drift at
 $r=r_{u_\phi ^{max}}$, where the maximum of the time-averaged azimuthal velocity is obtained. In the lower half of the cell, for
 $z=H/4$, warm plumes dominate, so the warm regions (pink stripes) are wider, whereas in the upper half of the cell, for
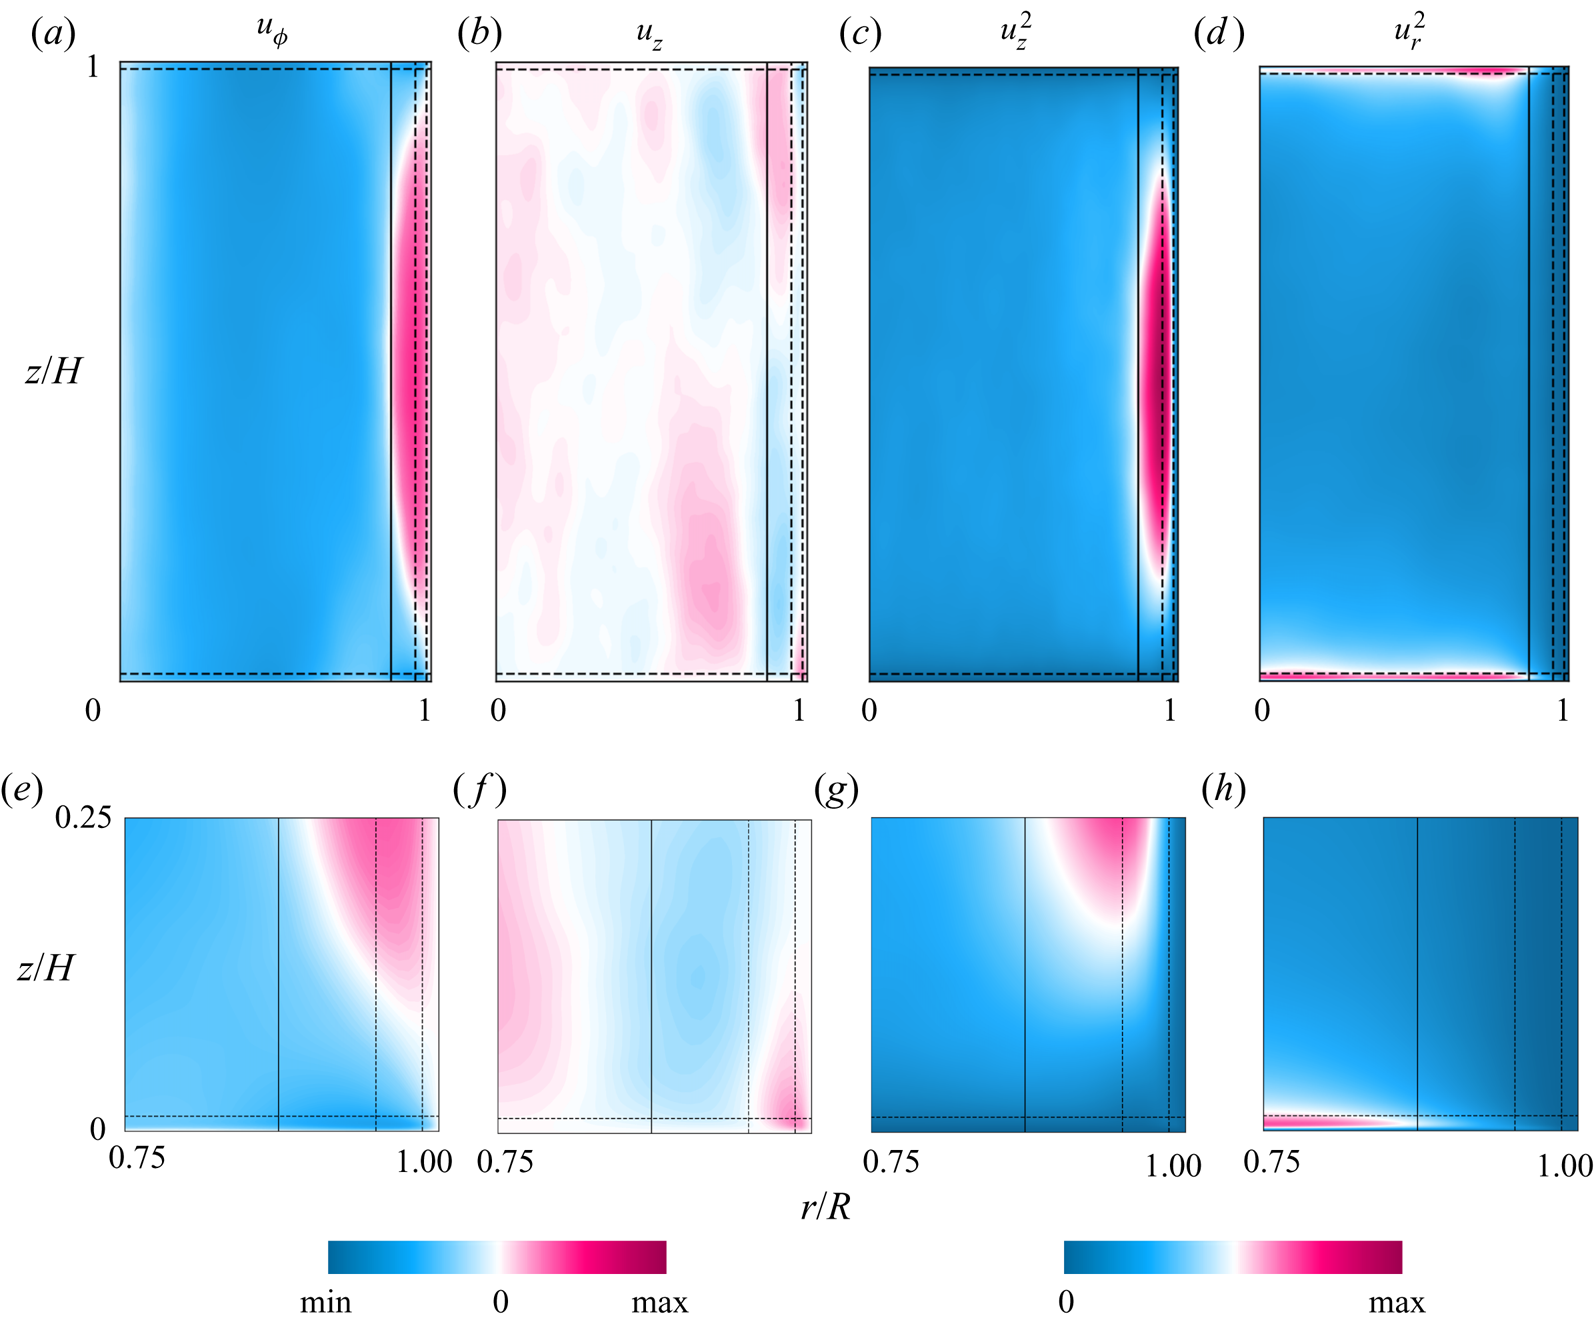
 $z=3H/4$, cold plumes dominate, resulting in wider cooler regions (blue stripes). Similarly, figures 2(c,d) and 5(a,d) show that the zonal flow develops away from the top and bottom plates and extends vertically throughout the bulk. Figure 5 illustrates that, owing to the drift, time-averaged fields in the vertical plane average to zero and do not capture important features of the flow motion, in particular, the
 $u_z$ field. The averaged
 $u^2_z$, however, does retain important information about the locations of the Stewartson ‘1/3’ and ‘1/4’ layers (dashed lines) and the BZF (solid line).
For  ${Ra}=10^9$,
 $1/{Ro}=10$,
 ${Pr}=0.8$,
 $\varGamma =1/2$ and
 $z = H/2$:
 $(a{,}b)$ horizontal cross-sections of
 $(a)$ time-averaged vertical heat flux
 $\langle \mathcal {F}_z\rangle _{{t}}$ and
 $(b)$ instantaneous vertical component of vorticity
 $\omega _z$ (negative values correspond to anticyclonic fluid motion), together with two-dimensional streamlines. The solid line indicates the radial position
 $r_0$ that defines the BZF by the condition
 $\langle u _\phi (r_0, z=H/2 )\rangle _{{t}}=0$. In
 $(a)$, the dash-dotted line (inner circle) and the dashed line (outer circle) are, respectively, the radial locations of
 $\langle \mathcal {F}_z\rangle _{{t}}=1$ (global averaged heat flux) and
 $u_\phi ^{max}$, the maximum of the time-averaged azimuthal velocity.
For  ${Pr}=0.8$,
 $\varGamma =1/2$,
 ${Ra}=10^9$,
 $1/{Ro}=20$ and
 $r=R$: time evolution of temperature distribution (space–time plot of temperature) at height
 $(a)$
 $z=H/4$,
 $(b)$
 $z=H/2$ and
 $(c)$
 $z=3H/4$.
Time-averaged flow fields in a vertical plane, for  ${Ra}=10^9$,
 $1/{Ro}=10$,
 ${Pr}=0.8$ and
 $\varGamma =1/2$. The ranges of variables are, respectively:
 $(a{,}b{,}e{,}f)$ from
 $-0.17$ to 0.17; and
 $(c{,}d{,}g{,}h)$ from 0 to 0.0289.
3.2. Contribution to heat transport
An important and unexpected property of the BZF in rotating RBC is its disproportionately large contribution to the heat transport in the system. Figures 3(a) and 6 show that the averaged heat flux inside the BZF is much stronger than in the region outside the BZF. To be clear about the averaging, we define
 \begin{gather} \mathcal{F}_i(r, \phi, z) \equiv (u_iT-\kappa\partial_iT)/(\kappa\varDelta /H),\quad i=r, \phi, z, \end{gather}
 \begin{gather}\langle {Nu} (r, t) \rangle_\phi \equiv (2 {\rm \pi})^{{-}1} \int_0^{2 {\rm \pi}} \mathcal{F}_z(r, \phi, z=H/2)\, \textrm{d}\phi, \end{gather}
 \begin{gather}\langle {Nu} (t) \rangle_{V} \equiv({\rm \pi} R^2 H)^{{-}1} \int_0^{2{\rm \pi}} \int_0^R \int_0^H \mathcal{F}_z (r, \phi,z) r\,\textrm{d}r\,\textrm{d}\phi\,\textrm{d}z, \end{gather}
 \begin{gather}\langle {Nu} (t) \rangle_{BZF} \equiv ({\rm \pi} (R^2-r_0^2))^{{-}1}\int_0^{2{\rm \pi}} \int_{r_0}^R \mathcal{F}_z(r,\phi, z=H/2) r\,\textrm{d}r\,\textrm{d}\phi, \end{gather}
 \begin{gather}R_f \equiv \langle {Nu} \rangle_{{BZF},t}/\langle {Nu} \rangle_{V,t}, \end{gather}
 \begin{gather}R_h \equiv (\langle {Nu} \rangle_{{BZF},t} \, {\rm \pi}(R^2-r_0^2))/(\langle {Nu} \rangle_{V,t} \, {\rm \pi}R^2) = \frac{R^2-r_0^2}{R^2} \langle {Nu} \rangle_{{BZF},t}/\langle {Nu} \rangle_{V,t}, \end{gather}
where  $r_0=R-\delta _0$. The quantity
 $R_f$ is the ratio of the mean vertical heat flux within the BZF to the vertical heat flux averaged over the whole cell. The quantity
 $R_h$ reflects the portion of the heat transported through the BZF compared to the total transported heat. Especially, in figure 6(a), the time- and
 $\phi$-averaged radial profile at the mid-height for
 ${Ra} = 10^9$,
 ${Pr} = 0.8$ and
 $\varGamma = 1/2$ shows a significant peak of heat transport inside the BZF, and the peak amplitude increases dramatically as rotation becomes stronger. Thus, although the width of the BZF shrinks with increasing rotation, thereby reducing the effective area of the BZF with respect to the whole domain, as shown in figure 6(b), the increasing magnitude of the peak makes the heat transport carried by the BZF quite significant. Note that the annular BZF region of width
 $\delta _0$ is smaller than the positive contribution to the heat transport, as shown in the inset of figure 6(a).
 $(a)$ Radial profiles of normalized time- and
 $\phi$-averaged heat flux
 $\langle {Nu} \rangle _{\phi ,t}(r)/\langle {Nu} \rangle _{V,t}$ at
 $z=H/2$, for different rotation rates. The inset shows the radial profiles of time- and
 $\phi$-averaged
 $u_{\phi }$, where solid lines pass through
 $\langle u_{\phi } \rangle _{\phi ,t}=0$ (radial location corresponds to
 $r_0$).
 $(b)$ Ratio of BZF area to the total area at
 $z=H/2$, i.e.
 $\mathcal {A}_0 = (R^2-r_0^2)/R^2$.
 $(c)$ Ratio of mean vertical heat flux inside the BZF to mean global heat flux, i.e.
 $R_f$ (3.5).
 $(d)$ Ratio of heat transported inside the BZF (solid circles) or in an extended zone
 $R-2\delta _0 < r < R$ (open circles) to total transported heat, i.e.
 $R_h$ (
 $R_h^*$) (3.6). For all panels
 ${Ra}=10^9$,
 ${Pr}=0.8$ and
 $\varGamma =1/2$.
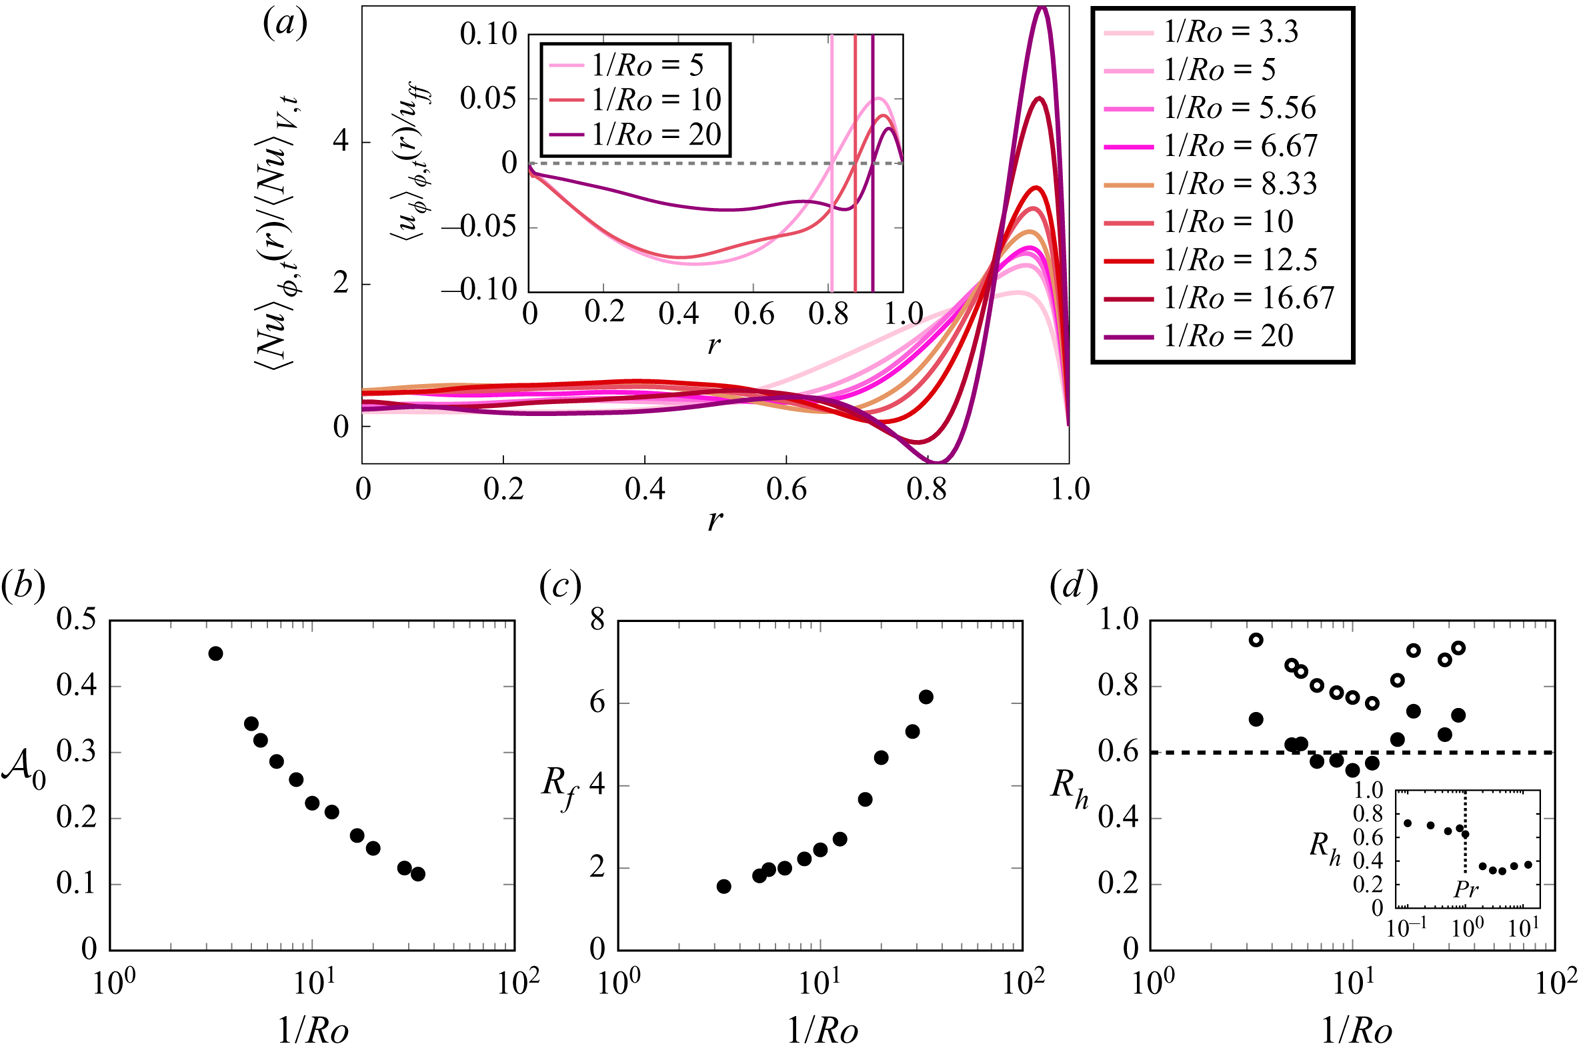
Figure 6(c) reveals that the enhancement of the local heat transfer within the BZF increases more rapidly when rotation is very strong ( $1/{Ro} \gtrsim 10$). As a result of these properties, the heat transport carried by the BZF for these parameter values is always more than 60 % of the total heat transport at fast rotation (see figure 6d). Note, however, that the effect of the BZF on the heat transport extends over a wider range
 $r < r_0$; over some range,
 $Nu$ is actually negative (see figure 6a), implying an anticorrelation of vertical velocity and buoyancy, i.e. warm fluid going down or cooler fluid moving up. If we modify the annular averaging to take into account the decreased
 $Nu$ region as well as the inner structure of the BZF, i.e. we average over the extended region
 $R - 2\delta _0 \leq r \leq R$, we get the ratio
 $R_h^*$, which is also shown in figure 6(d) (open symbols) where one sees an even larger fractional contribution.
We also consider the dependence of the heat transport ratio  $R_h$ as a function of
 ${Pr}$ (see inset of figure 6d). Interestingly, for
 ${Pr} <1$ we find
 $0.6 < R_h < 0.7$, whereas for
 ${Pr} > 1$ we have
 $0.3 < R_h < 0.4$, with a quite sharp transition for
 ${Pr} \approx 1$. The origin of this rather sharp change emphasizes the important role that
 ${Pr}$ plays, perhaps through the competition between thermal and viscous BLs. Finally, comparing our computation of the total
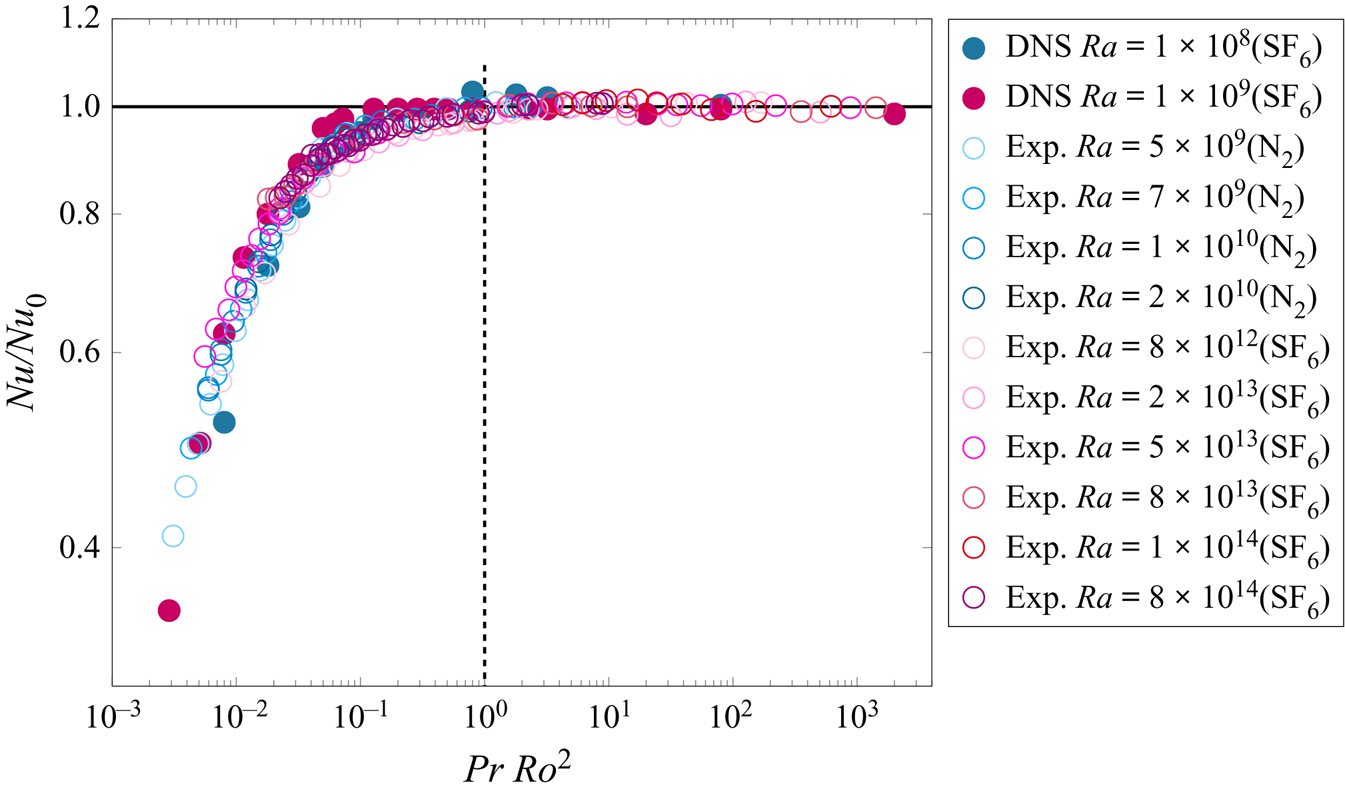
 $Nu$ with increasing rotation with that of Wedi et al. (Reference Wedi, Van Gils, Bodenschatz and Weiss2021) (see figure 13 in the Appendix), we conclude, given the close agreement, that the contribution of the BZF affects both measures of
 $Nu$ substantially and needs to be taken into account when considering the scaling of geostrophic heat transport in experiments and also in DNS with no-slip sidewall boundary conditions (see also de Wit et al. Reference de Wit, Guzman, Madonia, Cheng, Clercx and Kunnen2020).
Double-logarithmic scale plot of  ${Nu}/{Nu}_0$ versus
 ${Pr}{Ro}^2$. The horizontal line indicates
 ${Nu}/{Nu}_0 = 1$; the vertical dashed line indicates the value
 ${Ro}_t$, i.e. a transition between buoyancy-dominated convection at larger
 ${Ro}$ (
 ${Nu} \approx {Nu}_0$) and the rotation-dominated regime at smaller
 ${Ro}$ (
 ${Nu} < {Nu}_0$). Experimental data are from Wedi et al. (Reference Wedi, Van Gils, Bodenschatz and Weiss2021).
3.3. Dependence on  ${Ra}$, ${Pr}$ and $\varGamma$


We first discuss the qualitative robustness of the BZF with respect to  ${Ra}$,
 ${Pr}$ and
 $\varGamma$ before we consider its quantitative spatial and temporal properties. We demonstrate the character of the BZF with respect to variations of
 ${Pr}$ and
 $\varGamma$ by considering time–angle plots of temperature
 $T$ at
 $z=H/2$ and
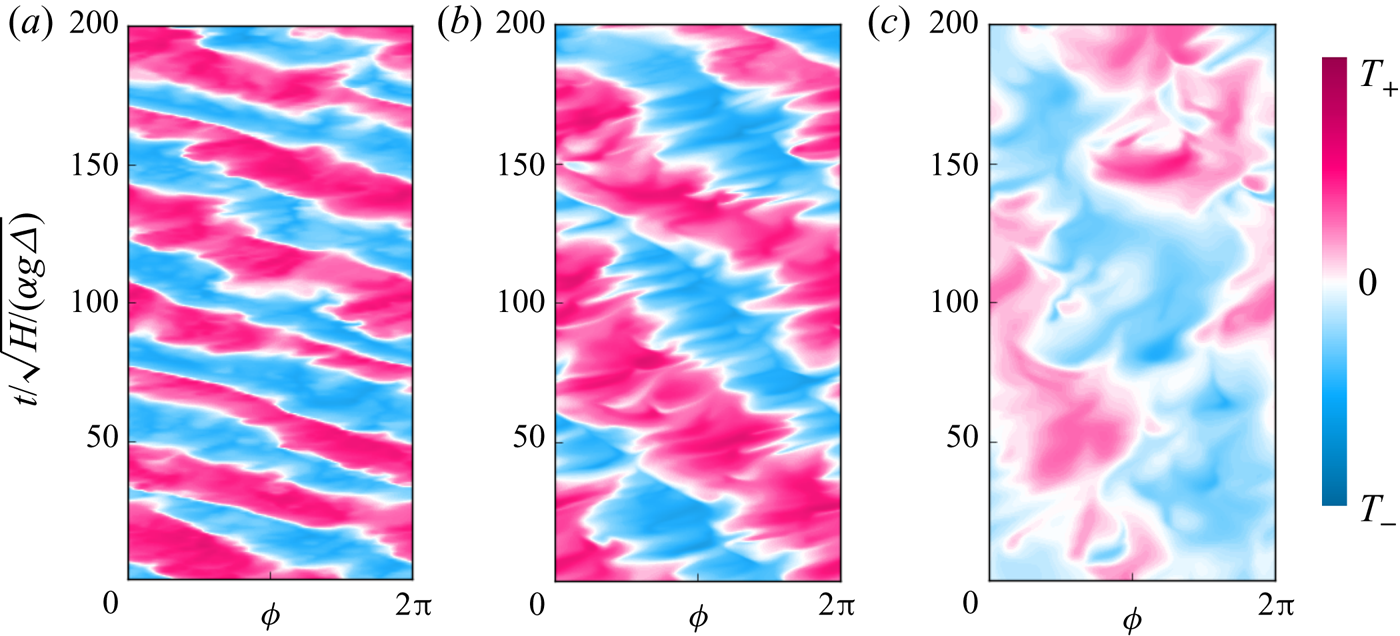
 $r=R$. Figure 7(a) shows that the BZF exists in the flows at different
 ${Pr}=0.1,\ 0.8$ and 4.38 (also for
 ${Pr}=0.25,\ 0.5,\ 2,\ 3,\ 7$ and 12.3, not shown), i.e. from small to large
 ${Pr}$. Although there are some quantitative differences among the three cases, they all qualitatively demonstrate the existence of the BZF for more than two decades of
 ${Pr}$.
Space–time plots of temperature  $T$ at the sidewall,
 $r=R$, and at half-height,
 $z=H/2$, for
 ${Ra} = 10^8$,
 $1/{Ro} = 10$,
 $\varGamma = 1/2$, and
 $(a)$
 ${Pr}=0.1$,
 $(b)$
 ${Pr}=0.8$ and
 $(c)$
 ${Pr}=4.38$.
The qualitative dependence of the BZF on the aspect ratio  $\varGamma$ is shown in figure 8 for three different aspect ratios:
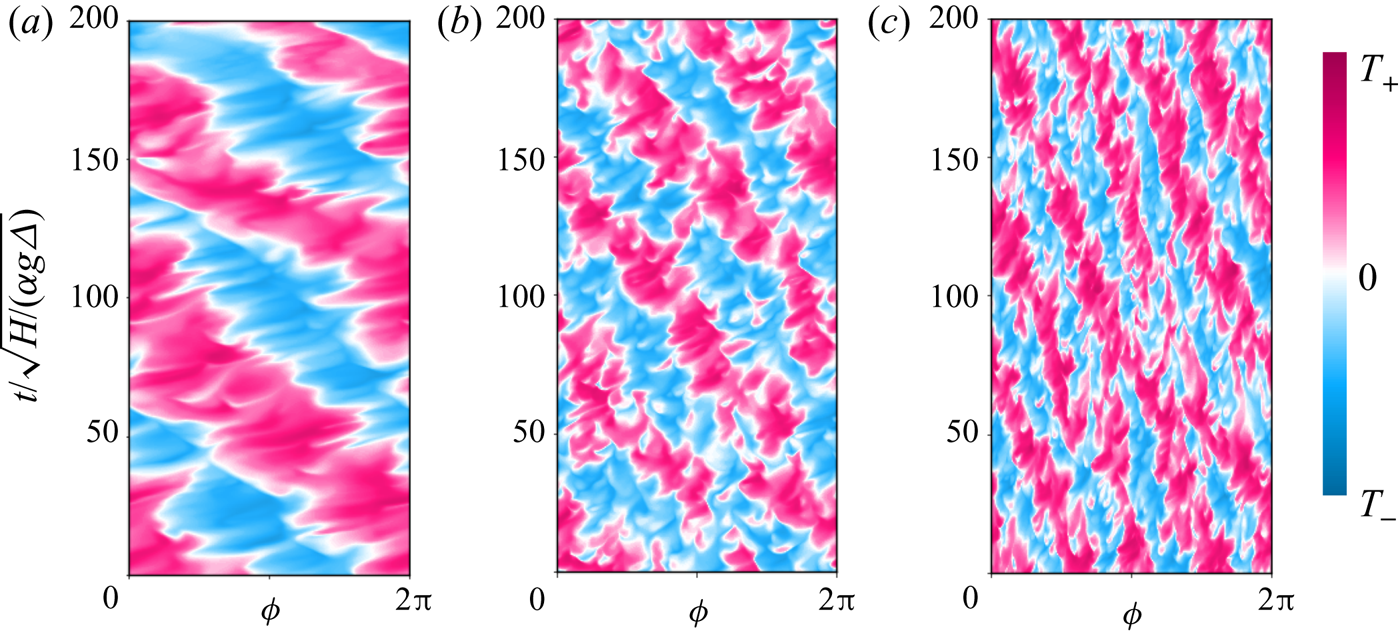
 $\varGamma = 1/2,\ 1$ and 2. The BZF is present in all three cases, has the same scaling of BZF width when scaled by
 $H$, i.e.
 $\delta _0/H$ is independent of
 $\varGamma$ (see figure 9d inset), and has a drift period (in units of free-fall time
 $\tau _{ff} = \sqrt {H/ (\alpha g \varDelta )} = \tau _\kappa {\textit {Pr}}^{-1/2} {Ra}^{-1/2}$, where
 $\tau _\kappa = H^2/\kappa$ is the thermal diffusion time) of approximately 70. The quantitative scaling of the drift frequency is analysed later, and the data are tabulated in the Appendix (see table 2). The wavelength
 $\lambda$ of the travelling BZF mode is independent of
 $\varGamma$ for these three values in a straightforward way, as seen in figure 8, namely
 $\lambda /H = {\rm \pi}/2$, so that the number of wavelengths around the circumference is
 $m=2 \varGamma$ and the wavenumber is
 $k=2{\rm \pi} /\lambda = 4/H$. We note, however, that this relationship is for a limited number of values of
 $\varGamma$ and control parameters
 ${Ra}$ and
 ${Ro}$. Thus, we make no strong claims to its generality. Indeed, there is already evidence from de Wit et al. (Reference de Wit, Guzman, Madonia, Cheng, Clercx and Kunnen2020) that for
 $\varGamma = 1/5$ one gets
 $m=1 \neq 2\varGamma$, and we made additional measurements with
 $\varGamma = 1/3$ and 3/4 that also yield
 $m=1$. We conjecture that, owing to periodic azimuthal symmetry,
 $m$ will take on only integer values, similar to the situation for wall mode states (Ecke et al. Reference Ecke, Zhong and Knobloch1992; Goldstein et al. Reference Goldstein, Knobloch, Mercader and Net1993; Ning & Ecke Reference Ning and Ecke1993; Zhong et al. Reference Zhong, Ecke and Steinberg1993; Liu & Ecke Reference Liu and Ecke1999) in cylindrical convection cells. Because of this periodic constraint, one cannot have
 $m<1$, so small aspect ratios with
 $\varGamma \lesssim 1$ have
 $m=1$. We also note that the mode-number dependence on
 $\varGamma$ of the BZF is similar to that of the
 $\varGamma$ dependence of linear wall state mode number, i.e.
 $m \approx 3 \varGamma$ (Goldstein et al. Reference Goldstein, Knobloch, Mercader and Net1993; Herrmann & Busse Reference Herrmann and Busse1993; Kuo & Cross Reference Kuo and Cross1993; Ning & Ecke Reference Ning and Ecke1993; Liu & Ecke Reference Liu and Ecke1999; Zhang & Liao Reference Zhang and Liao2009). Given that our states have values of
 ${Ra}$ that are 10–100 times greater than the linear wall mode onset
 ${Ra}_w$, this difference is not unreasonable and the correspondence is very suggestive. In particular, a range of mode numbers are stable near onset (Ning & Ecke Reference Ning and Ecke1993; Zhong et al. Reference Zhong, Ecke and Steinberg1993; Liu & Ecke Reference Liu and Ecke1999) owing to the azimuthally periodic boundary conditions. Significantly above onset there seems to be a selection towards lower mode numbers: for example, Zhong et al. (Reference Zhong, Ecke and Steinberg1993, figures 3 and 8) with
 $\varGamma = 2$ show stable wall modes with
 $m = 4,\ 5,\ 6$ and 7 near onset but only the
 $m=4$ and 5 modes persist for higher
 ${Ra}$, which yields
 $m = 2\varGamma$ and
 $m = 2.5 \varGamma$, respectively, consistent with our results for the BZF (see also Favier & Knobloch Reference Favier and Knobloch2020).
Space–time plots of temperature  $T$ at the sidewall,
 $r=R$, and at half-height,
 $z=H/2$, for
 ${Ra} = 10^8$,
 $1/{Ro}=10$,
 ${Pr}=0.8$, and
 $(a)$
 $\varGamma =1/2$,
 $(b)$
 $\varGamma =1$ and
 $(c)$
 $\varGamma =2$.
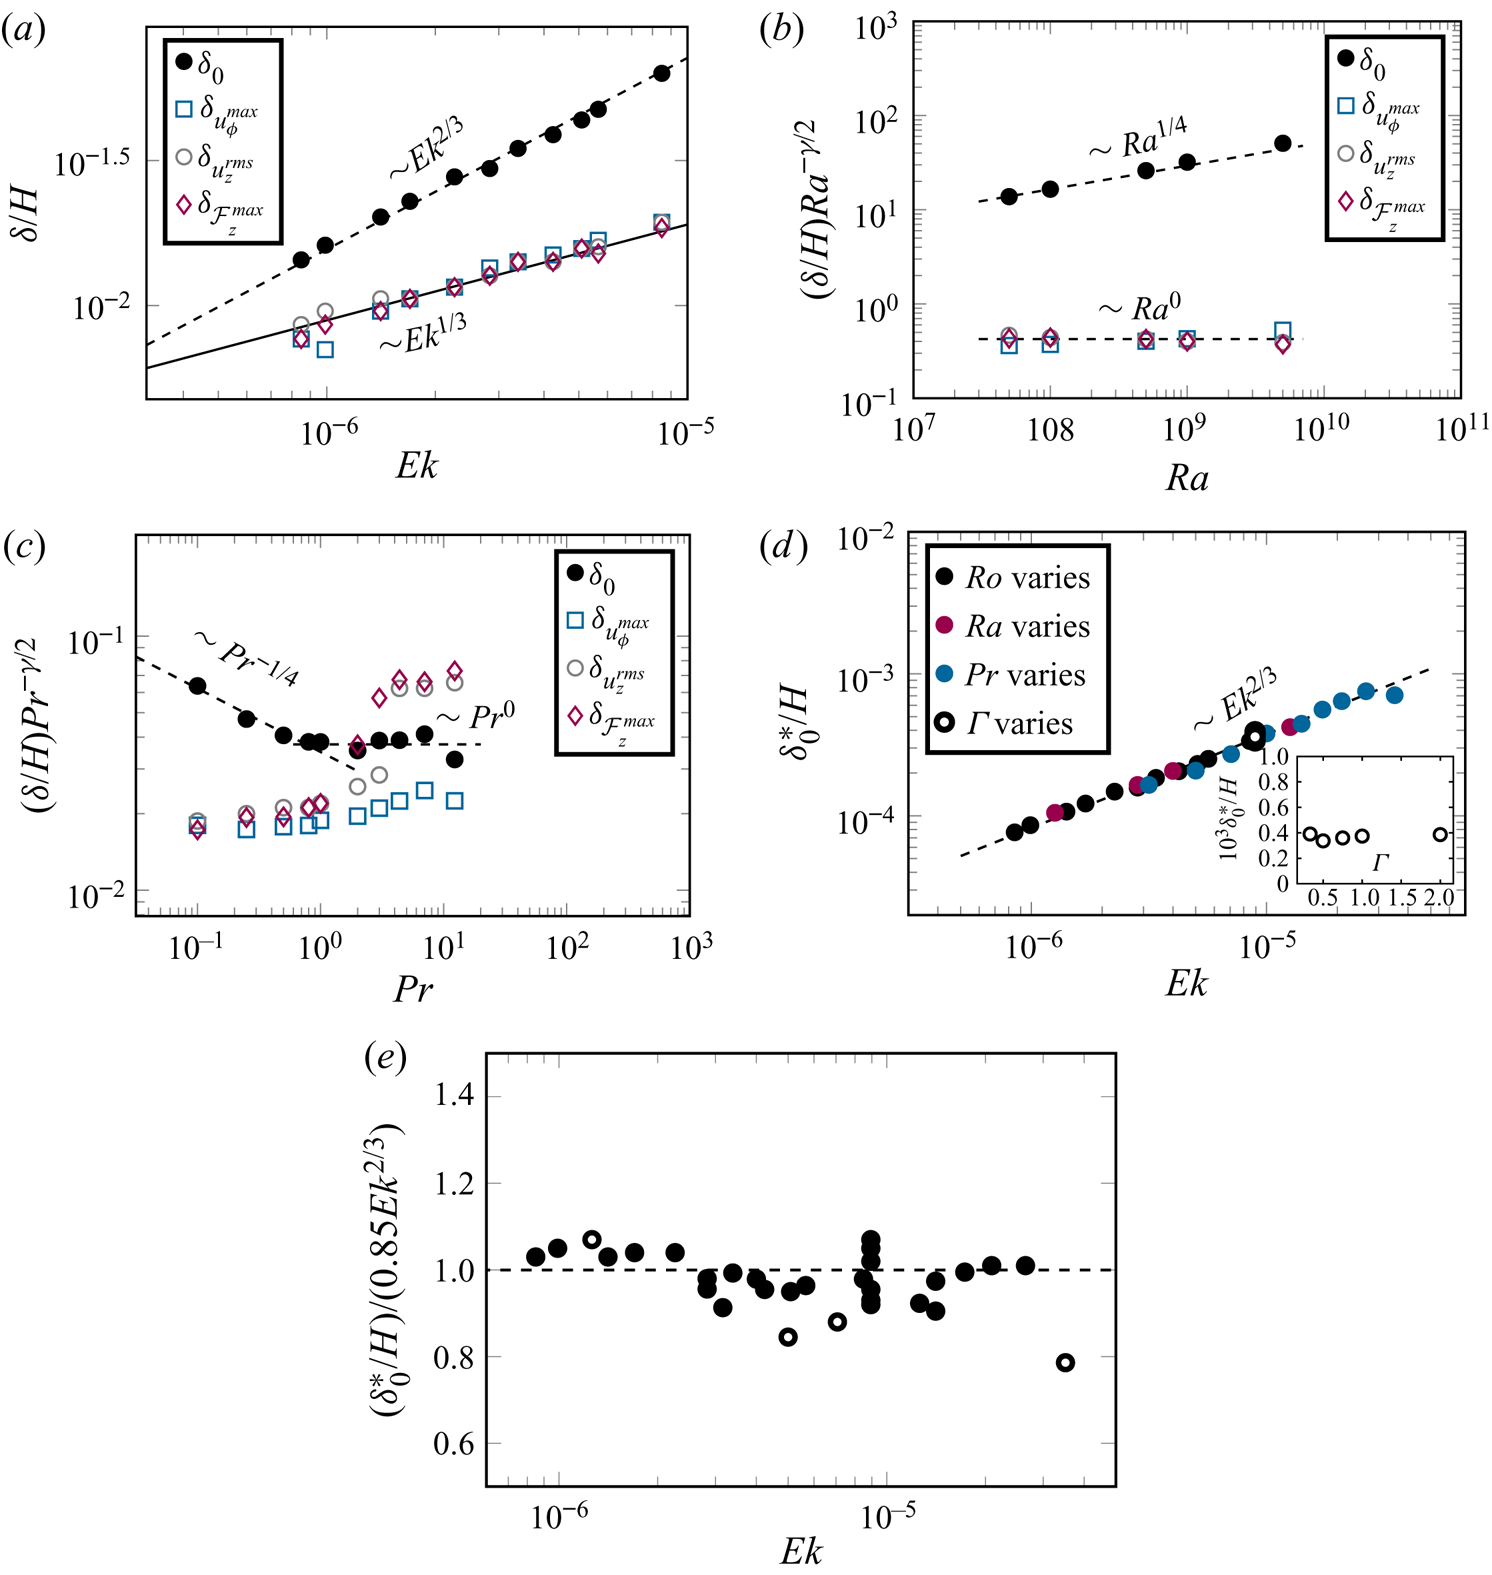
 $(a)$ Scaling with
 ${\textit {Ek}}$ of characteristic widths
 $\delta /H \sim {\textit {Ek}}^{\gamma }$ (for
 $\delta _0$, the distance from the vertical wall to the location where
 $\langle u _{\phi }\rangle _{{t}}=0$), for
 ${Ra}=10^9$,
 ${Pr}=0.8$ and
 $\varGamma =1/2$. For
 $\delta _0/H$, one obtains
 $\gamma \sim 2/3$, whereas for other
 $\delta /H$, one has
 $\gamma = 1/3$.
 $(b)$ Scaling with
 ${Ra}$ of compensated width
 ${Ra}^{\gamma /2} \delta _0/H$ for fixed
 $1/{Ro}=10$ and
 ${Pr} =0.8$.
 $(c)$ Scaling with
 ${Pr}$ of compensated width
 ${Pr}^{-\gamma /2} \delta _0/H$ for
 ${Ra}=10^8$ and
 $1/{Ro} = 10$.
 $(d)$ Scaling with
 ${\textit {Ek}}$ of normalized BZF width
 $\delta _0^\ast /H = {Ra}^{-1/4} {\textit {Pr}}^{1/4} \delta _0/H$ (for
 ${Pr} < 1$) and
 $\delta _0^\ast /H = {Ra}^{-1/4} {\textit {Pr}}^{0} \delta _0/H$ (for
 ${Pr} > 1$); for compactness, we write the two scalings with
 ${Pr}$ as
 ${Pr}^{\{-1/4,\ 0\}}$. The inset shows
 $\delta _0^\ast /H$ versus
 $\varGamma$.
 $(e)$ Compensated plot of BZF width
 $(\delta _0/H)/(0.85 Pr^{\{-1/4,\ 0\}}{Ra}^{1/4} {\textit {Ek}}^{2/3})$ versus
 ${\textit {Ek}}$ (all data from table 2 are shown; open symbols are cases with larger statistical uncertainty owing to shorter averaging time).
3.4. Spatial and temporal scales
We next consider the quantitative dependence of the different layer widths on  ${Ra}$,
 ${\textit {Ek}}$ and
 $Pr$, looking for a universal scaling of the form
 $\delta /H \sim {\textit {Pr}}^\xi {Ra}^\beta {\textit {Ek}}^\gamma$. In figure 9(a), the dependence of
 $\delta _0/H$ on
 ${\textit {Ek}}$ for
 ${Ra} = 10^9$,
 ${Pr} = 0.8$ and
 $2< 1/Ro <20$ is shown to be consistent with an
 ${\textit {Ek}}^{2/3}$ scaling, whereas the widths based on other measures scale closely as
 ${\textit {Ek}}^{1/3}$, i.e.
 $\gamma$ takes on values of 2/3 and 1/3 for BZF width and velocity layer widths, respectively. (Because the statistical uncertainty in our reported exponents is of the order of 5 %–10 %, we report fractional scalings consistent with the data to within these uncertainties; they are not intended to denote exact results.) As mentioned in Zhang et al. (Reference Zhang, van Gils, Horn, Wedi, Zwirner, Ahlers, Ecke, Weiss, Bodenschatz and Shishkina2020), the BZF is characterized by bimodal temperature p.d.f.s near the sidewall. This property was used in both DNS and experimental measurements to identify the BZF over a wide range of
 ${Ra}$. Here, we conduct a more detailed analysis of the DNS data to explore how the width of the BZF changes with
 ${Ra}$. We compute the width at fixed
 ${Ro} = {Ra}^{1/2} {\textit {Pr}}^{-1/2} {\textit {Ek}}$ so
 ${\textit {Ek}}={Ro}\,{Ra}^{-1/2} {\textit {Pr}}^{1/2}$. To determine the scaling with
 ${Ra}$ at fixed
 $Ro=1/10$, we have that
 $\delta /H \sim {Ra}^{\beta -\gamma /2}$. By multiplying by
 ${Ra}^{\gamma /2}$ we obtain the scaling exponent
 $\beta$. In figure 9(b), we plot
 $(\delta _0/H) {Ra}^{1/3}$ and
 $(\delta /H) {Ra}^{1/6}$ corresponding to
 $\gamma$ values of 2/3 and 1/3, respectively. From this plot, we obtain values for
 $\beta$ of 1/4 and 0, respectively. Similarly for the dependence on
 ${Pr}$, we plot in figure 9(c) the corrected quantities
 $(\delta /H) {\textit {Pr}}^{\gamma /2}$, which yields
 $\delta _0/H$ scalings for
 $\xi$ of
 $-1/4$ for
 ${Pr} < 1$ and 0 for
 ${Pr} > 1$. The other layer widths based on
 $u_\phi$,
 $u_z$ and
 $\mathcal {F}_z$ are independent of
 ${Pr}$ for
 ${Pr} < 1$ but do not collapse for
 ${Pr} >1$. The separation of the different widths for
 ${Pr}>1$ suggests some interesting behaviour not captured by our scaling ansatz.
Finally, we can collapse all the data for BZF width onto a single scaling curve by plotting in figure 9(d)  $\delta _0^\ast /H = \delta _0/H ({\textit {Pr}}^{\{1/4,\ 0\}} {Ra}^{-1/4} )$ versus
 ${\textit {Ek}}$ (to compact the different scalings with
 ${Pr}$ we denote them as
 ${Pr}^{\{1/4, 0\}}$ for scaling with
 ${Pr} < 1$ and
 ${Pr}>1$, respectively) so that we can conclude that
 $\delta _0/H \sim {\textit {Pr}}^{\{-1/4, 0\}} {Ra}^{1/4} {\textit {Ek}}^{2/3}$. The results at one set of parameter values
 $\{{Ra}, {\textit {Pr}}, {Ro} \}$ are independent of
 $\varGamma$ (see figure 9d inset), which implies that
 $\delta _0/H \sim \varGamma ^{0}$ (other dependences on
 $\varGamma$ are not ruled out for other parameter values, although it is reasonable to assume it to be general in the absence of other data). Thus, we plot in figure 9(d) all the data with different
 $\varGamma$,
 ${Pr}$,
 ${Ra}$ and
 ${\textit {Ek}}$ to obtain scalings
 \begin{gather} \delta_0/H \approx 0.85 \varGamma^{0} {\textit{Pr}}^{{-}1/4} {Ra}^{1/4} {\textit{Ek}}^{2/3}, \quad \text{for}\ {\textit{Pr}}<1, \end{gather}
 \begin{gather}\delta_0/H \approx 0.85 \varGamma^{0} {\textit{Pr}}^{0} {Ra}^{1/4} {\textit{Ek}}^{2/3}, \quad \text{for}\ {\textit{Pr}}>1. \end{gather}
We plot in figure 9(e) the scaled BZF width  $(\delta _0/H)/(0.85 \varGamma ^{0} {\textit {Pr}}^{\{-1/4,\ 0\}} {Ra}^{1/4} {\textit {Ek}}^{2/3})$. One sees that the data scatter randomly within
 ${\pm }10\,\%$, quite good agreement.
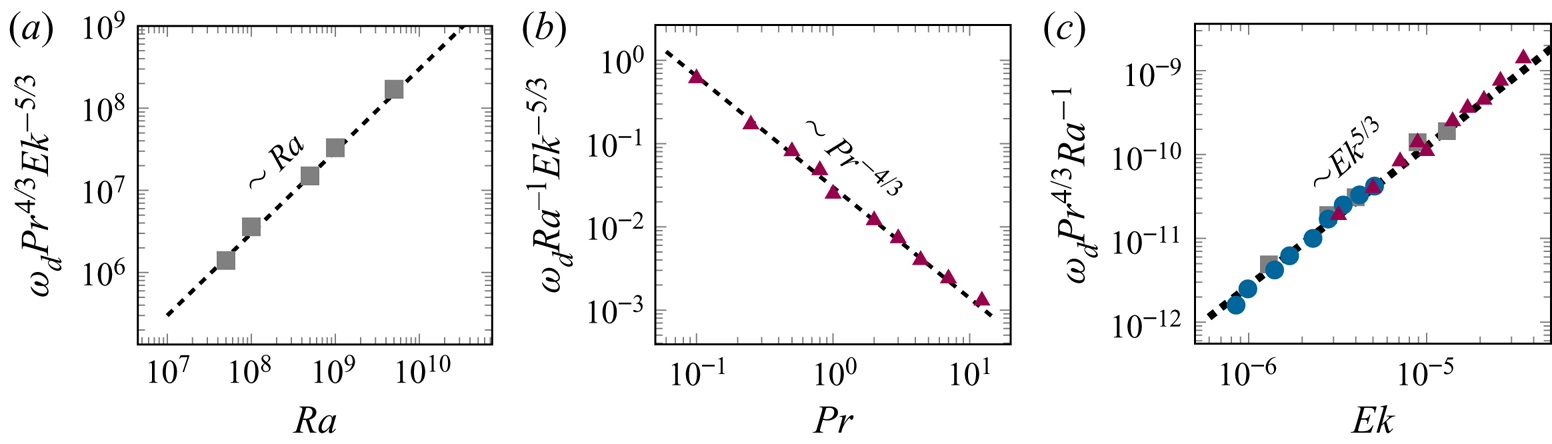
The BZF drifts anticyclonically, the same as the direction of travelling wall modes of rotating convection (Zhong et al. Reference Zhong, Ecke and Steinberg1991; Ecke et al. Reference Ecke, Zhong and Knobloch1992; Herrmann & Busse Reference Herrmann and Busse1993; Kuo & Cross Reference Kuo and Cross1993). We plot in figure 10(a) the drift frequency  $\omega _d \equiv \omega /\varOmega$ versus
 ${Ra}$ showing scaling as
 $Ra$ and in figure 10(b) versus
 ${Pr}$ showing scaling as
 ${Pr}^{-4/3}$(data in both are corrected for constant-
 ${Ro}$ conditions). In figure 10(c), we scale out the dependence on
 ${Ra}$ and
 ${Pr}$, i.e.
 $\omega _d {Ra}^{-1} {\textit {Pr}}^{4/3}$, and observe reasonable collapse with
 $Ek^{5/3}$ scaling. From the cases listed in table 2, we get the frequency scaling in terms of
 ${Ra}$,
 ${Pr}$,
 $\varGamma$ and
 ${\textit {Ek}}$ as
 \begin{equation} \omega_d \approx 0.03 \varGamma^{0} {\textit{Pr}}^{{-}4/3} {Ra} \,{\textit{Ek}}^{5/3}. \end{equation}
The linear dependence on  ${Ra}$ is consistent with earlier results (Horn & Schmid Reference Horn and Schmid2017; Favier & Knobloch Reference Favier and Knobloch2020; de Wit et al. Reference de Wit, Guzman, Madonia, Cheng, Clercx and Kunnen2020) and suggests that there is a correspondence between the states we observe and the nonlinear manifestation of linear wall mode states. The scalings we have determined for
 $\omega _d$ with
 ${\textit {Ek}}$ and
 $Pr$ will be useful in making a more quantitative comparison with the wall mode hypothesis among datasets with different
 ${\textit {Ek}}$ and
 $Pr$. Such an analysis is beyond the scope of the present work and will be presented elsewhere. These scalings, of course, depend on the definition of the time unit. Using the free-fall time or the vertical thermal diffusion time, respectively, we obtain
 \begin{gather} \omega/\sqrt{\alpha g \varDelta/H} \approx 0.015 \varGamma^{0} {\textit{Pr}}^{{-}5/6} {Ra}^{1/2} {\textit{Ek}}^{2/3}, \end{gather}
 \begin{gather}\omega/ ( \kappa/H^2 ) \approx 0.015 \varGamma^{0} {\textit{Pr}}^{{-}1/3} {Ra} \, {\textit{Ek}}^{2/3}, \end{gather}
which both show the same  ${\textit {Ek}}$ scaling as
 $\delta _0$, i.e.
 ${\textit {Ek}}^{2/3}$ (see figure 9a). For the three choices of time scale, the drift frequency decreases with increasing
 ${Pr}$ for all
 ${Pr}$ as opposed to the scaling of
 $\delta _0/H$, which has different scaling for small and large
 ${Pr}$ (see figures 9c and 12b).
Scalings of  $\omega _d$:
 $(a)$ data scaled by
 ${Pr}^{4/3} {\textit {Ek}}^{-5/3}$ showing
 ${Ra}$ scaling;
 $(b)$ data scaled by
 ${Ra}^{-1} {\textit {Ek}}^{-5/3}$ showing
 ${Pr}^{-4/3}$ scaling; and
 $(c)$ data scaled by
 ${Pr}^{4/3} {Ra}^{-1}$ showing
 ${\textit {Ek}}^{5/3}$ scaling (cases at different
 ${Ra}$ ( grey squares), at different
 ${Pr}$ ( red triangles) and at different
 ${Ro}$ (blue circles)).
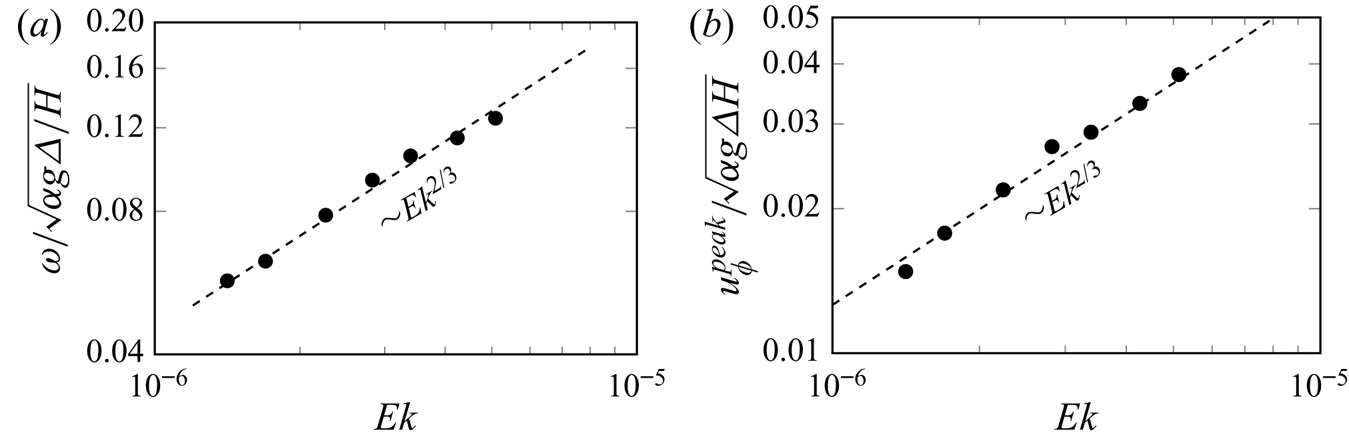
As reported in Zhang et al. (Reference Zhang, van Gils, Horn, Wedi, Zwirner, Ahlers, Ecke, Weiss, Bodenschatz and Shishkina2020) and shown here in figure 3, the thermal structures drift anticyclonically, opposite to the azimuthal velocity, which is cyclonic near the sidewall, as shown in figure 2(b–d). We show in figure 11(a) that the drift frequency decreases as rotation increases with a scaling  ${\textit {Ek}}^{2/3}$. In figure 11(b), we show that the near-plate azimuthal velocity
 $u_\phi ^{peak}$ is also anticyclonic and shows the same scaling behaviour with
 ${\textit {Ek}}$ (see figure 10b) as the BZF width and drift frequency. Based on this observation, we believe that the drift characteristics of the BZF are determined not only by the presence of the vertical wall but also by the near-plate region.
For fixed  ${Ra}=10^{9}$ and rotation rates,
 $1/{Ro}=5.6$, 6.7, 8.3, 10, 12.5, 16.7 and 20:
 $(a)$ drift frequency
 $\omega$ of BZF; and
 $(b)$ maximum absolute value of
 $u_{\phi }$ near plates (mean value of two maxima). In both panels
 ${Pr}=0.8$ and
 $\varGamma =1/2$.
Finally, we consider the range of  ${Ra}$ and
 ${\textit {Ek}}$ in which the BZF is observed in this study. There are three regions defined by the onset of wall mode convection
 ${Ra}_w \approx 32 {\textit {Ek}}^{-1}$, the onset of bulk convection
 ${Ra}_c = A {\textit {Ek}}^{-4/3}$ and the transition from geostrophic convection (Grooms et al. Reference Grooms, Julien, Weiss and Knobloch2010; Julien et al. Reference Julien, Knobloch, Rubio and Vasil2012) to buoyancy-dominated convection
 ${Ra}_t = {\textit {Pr}}\, {Ro}_t^2 {\textit {Ek}}^{-2}$, where
 ${Ro}_t \approx 1$ (see figure 13 in the Appendix) is the transition Rossby number out of the geostrophic regime (Julien et al. Reference Julien, Legg, McWilliams and Werne1996; King et al. Reference King, Stellmach, Noir, Hansen and Aurnou2009; Liu & Ecke Reference Liu and Ecke2009; Weiss & Ahlers Reference Weiss and Ahlers2011b) as indicated in the
 ${Ra}$–
 ${\textit {Ek}}$ phase diagram in figure 12(a). Our data fall solely within the geostrophic regime of bulk convection, but we include the other zones for context. According to Chandrasekhar (Reference Chandrasekhar1961) (see also Clune & Knobloch Reference Clune and Knobloch1993), the critical Rayleigh number for the onset of convection is
 ${Ra}_{c} \sim {\textit {Ek}}^{-4/3}$ with a prefactor
 $A$ that is weakly dependent on
 ${\textit {Ek}}$, in the range 6–8.7 (Chandrasekhar Reference Chandrasekhar1961; Niiler & Bisshopp Reference Niiler and Bisshopp1965); we use a value of 7.5 consistent with our range of
 ${\textit {Ek}}$.
 $(a)$ The
 ${Ra}$–
 ${Pr}$ phase diagram. Different rotating convective states are labelled. The dashed horizontal line corresponds to
 ${Ra} = 10^9$. Critical
 ${\textit {Ek}}$ values
 ${\textit {Ek}}_w$,
 ${\textit {Ek}}_c$ and
 ${\textit {Ek}}_t$ are indicated. The
 ${\textit {Ek}}$ data (solid circles) correspond to values in
 $(b)$.
 $(b)$ Widths of BZF
 $\delta _0$ and Stewartson
 ${\sim }{\textit {Ek}}^{1/3}$ layer
 $\delta _{u_z}^{{rms}}$ at
 ${Ra}=10^9$ (DNS) versus
 ${\textit {Ek}}$. Vertical dashed lines (black, blue and red, respectively) are the critical Ekman numbers for onset of wall modes (
 ${\textit {Ek}}_w$), onset of bulk convection (Chandrasekhar Reference Chandrasekhar1961; Niiler & Bisshopp Reference Niiler and Bisshopp1965) (
 ${\textit {Ek}}_c$), and transition to rotation-dominated regimes (
 ${\textit {Ek}}_t$) for
 ${Pr}=0.8$,
 ${Ra}=10^9$ and
 $\varGamma =1/2$.
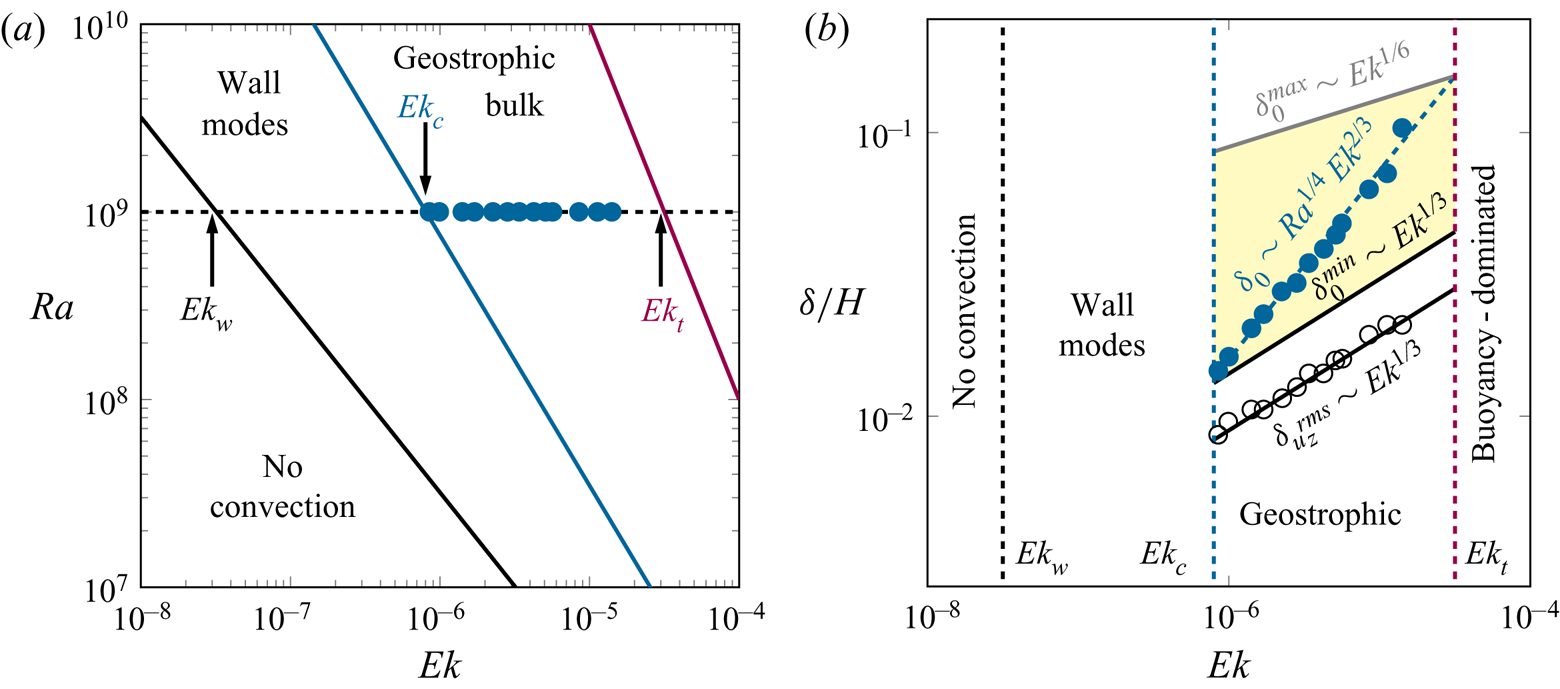
To illustrate one aspect of this range, we consider the BZF width  $\delta _0/H$ versus
 ${\textit {Ek}}$ for
 ${Ra} = 10^9$ in figure 12(b). A path of constant
 ${Ra} = 10^9$ (figure 12a) yields
 ${\textit {Ek}}_w \approx 32 Ra^{-1} = 3.2 \times 10^{-8}$,
 ${\textit {Ek}}_c = (A\, Ra^{-1})^{3/4} = 8 \times 10^{-7}$ and
 ${\textit {Ek}}_t = {Ro}_t {\textit {Pr}}^{1/2} Ra^{-1/2} = 2.8 \times 10^{-5}$. Here the subscripts ‘
 $w$’, ‘
 $c$’ and ‘
 $t$’ correspond, respectively, to the onset of wall mode, bulk convection and transition from rotation to buoyancy-dominated regime. These values are indicated by vertical dashed lines in figure 12(b). Knowing the dependence of the critical
 ${Ra}_{c}$ and
 ${\textit {Ek}}$, and using the relations (3.7) and (3.8), we can evaluate the smallest possible
 $\delta _{0}$ for any fixed
 ${\textit {Ek}}$, i.e.
 $\delta _0^{min} \sim {Ra}_c^{1/4}{\textit {Ek}}^{2/3} \sim {\textit {Ek}}^{1/3}$ (see
 $\delta _0^{min}$ in figure 12b). Connecting these onset points, we obtain the black line in the diagram, which is parallel to the Stewartson ‘1/3’ layer scaling. The gap between these two black solid lines depends slightly on
 $A$, but the ratio of the BZF width to the Stewartson layer width is constant (based on
 $\delta ^{rms}_{u_z}$) at the onset of convection (the fixed gap). Thus, although the BZF width decreases faster than the Stewartson layer as rotation increases, there is no crossing of the BZF boundary and the boundary of the Stewartson layer at extremely fast rotation because bulk convection ceases before they can cross. Note that all the data considered here fall within the geostrophic range of rotating convection; what happens in the wall mode region is not addressed.
The other bound on the BZF scaling depends on when rotation becomes significant. An estimate is made based on a plot of  ${Nu}/{Nu}_{0}$ versus
 ${Pr}\,{Ro}^2$ for our DNS and for experimental data from Wedi et al. (Reference Wedi, Van Gils, Bodenschatz and Weiss2021) (see figure 13 in the Appendix), where the data for
 ${Ra}$ from
 $10^8$ to
 $10^{14}$ merge onto a single curve. Here
 ${Nu}_0$ is the Nusselt number in the non-rotating case. Using an empirical estimate
 ${Ro}_t \approx 1$ for the onset of the rotation-dominated regimes, i.e. the geostrophic regime, we get an estimate for the largest possible
 $\delta _0$, for any
 ${\textit {Ek}}$ (grey line in figure 12, that is,
 $\delta _0^{max} \propto {Ra}_t^{1/4}{\textit {Ek}}^{2/3} \propto {Ro}_t^{1/2}{\textit {Ek}}^{1/6} \approx {\textit {Ek}}^{1/6}$). (The value
 ${Pr}\,{Ro}_t^2 \approx 1$ is the onset in figure 13, but in the experiments
 ${Pr}$ varies from 0.7 to 0.9 and in the DNS
 ${Pr}=0.8$; thus here we take
 ${Pr}=1$, which gives
 ${Ro}_t \approx 1$, for simplicity.)
It is remarkable that the BZF regime is confined by these two critical lines ( $\sim {\textit {Ek}}^{1/6}$ and
 $\sim {\textit {Ek}}^{1/3}$) and the range confined in between gets broader for higher
 ${Ra}$. In other words, at low
 ${Ra}$, the BZF is only observed over a small range of rotation rates. At large
 ${Ra}$, the BZF exists over a much broader range of rotation rates (Zhang et al. Reference Zhang, van Gils, Horn, Wedi, Zwirner, Ahlers, Ecke, Weiss, Bodenschatz and Shishkina2020; Wedi et al. Reference Wedi, Van Gils, Bodenschatz and Weiss2021). For any fixed
 ${Ra}$, the BZF exists in a certain
 ${\textit {Ek}}$ range that is determined by the grey and black lines in figure 12(b) and the BZF width changes as
 $\delta _0\sim {\textit {Ek}}^{2/3}$ over that range. How the BZF contributes to the heat transport relative to the contribution of the laterally unbounded system in the geostrophic regime remains an open question. Further, the connection between the BZF and linear wall modes requires additional work to understand the relationship between the two convective states.
4. Conclusion
The BZF is found to be an important flow structure in rapidly rotating turbulent Rayleigh–Bénard convection in the geostrophic regime and is robust over considerable ranges of  ${Ra}$,
 ${\textit {Ek}}$,
 ${Pr}$ and
 $\varGamma$. The main structure, drift of plume pairs, is found to be a
 $m=2\varGamma$ mode for the choices of
 $\varGamma = 1/2$, 1 and 2; additional values of
 $\varGamma = 1/3$ and 3/4 yield
 $m=1$, suggesting mode 1 for
 $\varGamma \lesssim 1$. In addition, the BZF carries a large portion of the total heat; its contribution to the total heat transport is approximately
 $60\,\%$ of the heat transport at fast rotation,
 $\textit {Ro} < 0.1$, and for
 $\textit {Pr} <1$. For
 $\textit {Pr} > 1$, the BZF heat transport contribution drops to approximately
 $35\,\%$. Understanding this important contribution to the heat transport is essential in analysing experiments in rotating convection in the geostrophic regime.
The scaling of the BZF width  $\delta _0$ depends on
 ${Pr}$,
 ${Ra}$ and
 ${\textit {Ek}}$ as
 $\delta _0/H \sim \varGamma ^{0} Pr^{\{-1/4,\ 0\}} {Ra}^{1/4} {\textit {Ek}}^{2/3}$ (that is,
 ${Pr}^{-1/4}$ for small-to-moderate
 ${Pr}$ and independent of
 ${Pr}$ for large
 ${Pr}$). The universal scaling of the BZF and the sidewall BLs is very clean for
 ${Pr} < 1$ but the BZF is less coherent for
 ${Pr} >1$ and the sidewall BL widths behave differently for those conditions. Further, the sharp decrease in the BZF heat transport contribution similarly marks a transition to a perhaps more complex BZF state for
 ${Pr} > 1$. The drift frequency of the BZF shows scaling
 $\omega /\varOmega \sim \varGamma ^{0} Pr^{-4/3} {Ra}\,{\textit {Ek}}^{5/3}$, indicating that the drift frequency decreases significantly as
 ${Pr}$ increases, is proportional to
 ${Ra}$ and decreases rapidly with increasing rotation (decreasing
 ${\textit {Ek}}$). Interestingly,
 $\omega$ seems to be more robust than
 $\delta$ with respect to changes in
 ${Pr}$. Finally, the BZF shares qualitative and some quantitative characteristics with linear wall modes, and establishing the connection between these two states will be an important area of future research.
Acknowledgements
The authors would like to thank E. Bodenschatz, D. Lohse, M. Wedi and S. Weiss for fruitful discussions, cooperation and support. The authors acknowledge the Leibniz Supercomputing Centre (LRZ) for providing computing time.
Funding
This work was supported by the Deutsche Forschungsgemeinschaft (X.Z. and O.S., grant number Sh405/8, Sh405/7 (SPP 1881 Turbulent ‘Superstructures’)); and the Los Alamos National Laboratory LDRD program under the auspices of the US Department of Energy (R.E.E.).
Declaration of interests
The authors report no conflict of interest.
Appendix
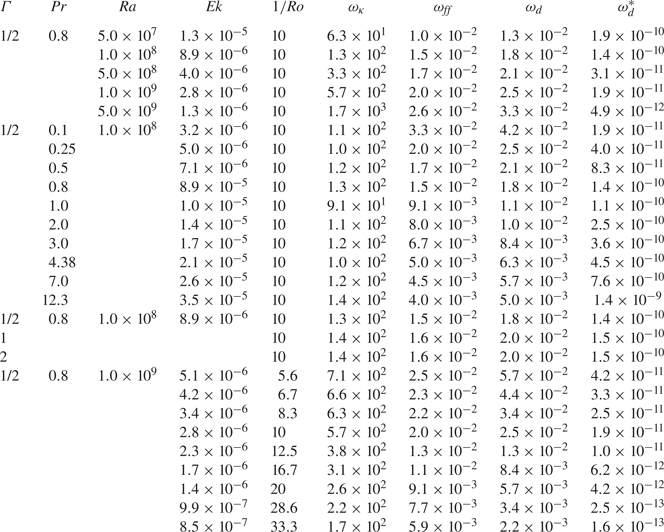
We tabulate here a full characterization of the parameters in the DNS (see table 2) and compare our results for  $Nu$ with experimental data from Wedi et al. (Reference Wedi, Van Gils, Bodenschatz and Weiss2021). The excellent agreement is a strong indication that our DNS are fully resolved. We also include the resulting numerical values of the BZF drift frequency for different choices of time scale (see table 3), namely
 $\omega _\kappa$,
 $\omega _{ff}$ and
 $\omega _d$ for different parameter values
 $\varGamma$,
 ${Pr}$,
 ${Ra}$,
 ${\textit {Ek}}$ and
 $1/{Ro}$.
Values of  $\varGamma$,
 ${Ra}$,
 ${Pr}$,
 ${\textit {Ek}}$,
 ${Ro}^{-1}$,
 $\omega _\kappa = \omega H^2/\kappa$,
 $\omega _{ff} = \omega ( H/ ( g \alpha \varDelta ))^{1/2}$,
 $\omega _d = \omega /\varOmega$ and
 $\omega _d^* = \omega _d {\textit {Pr}}^{4/3} {Ra}^{-1}$. (For
 $\varGamma = 1/3$ and 3/4, there are insufficient data to determine
 $\omega$.)


 Open access

