I. INTRODUCTION
Gold nanoparticles are extensively used for seeding growth of III–V semiconductor nanowires, as they are known to yield uniform nanowire morphology over a large range of process conditions. Reference Dick1 However, gold is well known to have a high diffusivity in silicon and to deteriorate its electrical properties by introducing mid-gap states, Reference Tavendale and Pearton2 complicating integration of III–V nanowires into Si-based devices. In addition, the most favorable growth direction for gold-seeded III–V nanowires is 〈111〉 B, while the 〈001〉 direction would be preferable for integration with Si electronics. Finally, gold-seeded nanowires grown in the 〈111〉 B direction have a strong tendency to form stacking faults, Reference Hornstra3 which are also detrimental to the electronic properties. Reference Schroer and Petta4,Reference Thelander, Caroff, Plissard, Dey and Dick5 For these reasons it is of great interest to explore gold-free growth techniques, for example using alternative metal seed particles. Pd and Fe have for example been shown to initiate the growth of nanowires in other preferential directions, including 〈110〉, Reference Xu, Wang, Guo, Liao and Gao6,Reference Regolin, Khorenko, Prost, Tegude, Sudfeld, Kästner, Dumpich, Hitzbleck and Wiggers7 〈111〉 A, Reference Heun, Radha, Ercolani, Kulkarni, Rossi, Grillo, Salviati, Beltram and Sorba8,Reference Heun, Radha, Ercolani, Kulkarni, Rossi, Grillo, Salviati, Beltram and Sorba9 and 〈001〉, Reference Regolin, Khorenko, Prost, Tegude, Sudfeld, Kästner, Dumpich, Hitzbleck and Wiggers7 in some cases without any stacking faults. In addition to defect-free zinc blende, more exotic polytypes, such as 4H, have been observed for example in Cu-seeded nanowires. Reference Hillerich, Ghidini, Dick, Deppert and Johansson10 Finally, intentional incorporation of atoms from the seed particle can potentially be used to tailor nanowire properties; for example Sn atoms from the seed particle have been used for doping, Reference Sun, Jacobsson, Chen, Nilsson, Thelander, Lehmann and Dick11 and the incorporation of Fe or Mn is proposed to enable nanowires with magnetic properties. Reference Regolin, Khorenko, Prost, Tegude, Sudfeld, Kästner, Dumpich, Hitzbleck and Wiggers7,Reference Martelli, Rubini, Piccin, Bais, Jabeen, De Franceschi, Grillo, Carlino, D'Acapito, Boscherini, Cabrini, Lazzarino, Businaro, Romanato and Franciosi12,Reference Jabeen, Piccin, Felisari, Grillo, Bais, Rubini, Martelli, D'Acapito, Rovezzi and Boscherini13 Additional investigations include III–V nanowires grown using Ag, Reference Vogel, de Boor, Becker, Wittemann, Mensah, Werner and Schmidt14 Bi, Reference Fanfair and Korgel15 Nb, Reference Zhuang, Li, Xue, Zhang, Zhang, Wang and Shen16 Ni, Reference Weng, Burke and Redwing17 Ta, Reference Li, Xue, Zhuyang, Chen, Yang, Qin, Huang and Zhang18 and Tb Reference Chen, Xue, Zhuang, Qin, Li and Yang19 as seed particles. However, there is a lack of large-scale systematic growth parameter studies to understand the growth behavior of III–V nanowires seeded by particles of other materials than gold.
The steady-state phase of the seed nanoparticle during growth is an important consideration for the resulting nanowire properties. Depending on the particle phase, nanowire growth is governed by either the vapor–liquid–solid (VLS) Reference Wagner and Ellis20 or the vapor–solid–solid (VSS) Reference Persson, Larsson, Stenström, Ohlsson, Samuelson and Wallenberg21 mechanism. Gold-seeded growth typically occurs in the VLS regime (gold nanoparticles form liquid alloy droplets during nanowire growth), due to the low eutectic temperature of gold with many semiconductors. However, by alloying Au with Ag Reference Chou, Wen, Reuter, Su, Stach and Ross22 or Al Reference Ross, Wen, Kodambaka, Wacaser, Reuter and Stach23 a solid phase can be promoted (VSS growth), which has been shown to result in atomically sharp heterointerfaces for Si/Ge nanowires. VSS growth is typically associated with lower growth rates Reference Kodambaka, Tersoff, Reuter and Ross24 ; however in situ studies of Pd-seeded VSS growth of Si nanowires Reference Hofmann, Sharma, Wirth, Cervantes-Sodi, Ducati, Kasama, Dunin-Borkowski, Drucker, Bennett and Robertson25 show axial growth rates higher than typically reported for other VSS growth. Reference Chou, Wen, Reuter, Su, Stach and Ross22 Further studies are needed to fully understand the effects of particle phase and material on the resulting nanowire properties. Previous work on Pd-seeded InAs Reference Xu, Wang, Guo, Liao and Gao6,Reference Heun, Radha, Ercolani, Kulkarni, Rossi, Grillo, Salviati, Beltram and Sorba8 and Cu-seeded InP Reference Hillerich, Dick, Messing, Deppert and Johansson26 nanowire growth showed a coexistence of solid and liquid particles on a single growth substrate, suggesting that these materials are good candidates to directly compare the relationship between particle phase and nanowire properties.
In this work, we have studied Pd-seeded GaAs nanowires to gain further insight into the role of the particle during nanowire growth, enabling the transition to a variety of alternative seed materials with properties adapted to the desired nanowire properties and/or application. The Pd particles were generated as an aerosol using a spark discharge generator (SDG). Reference Meuller, Messing, Engberg, Jansson, Johansson, Norlén, Tureson and Deppert27 This technique allows for a high control of the initial particle density and size, making it possible to correlate postgrowth sizes and densities with the initial particle size and density. This is highly important, as particle diameter and proximity effects are known to influence both crystal structure and growth rate of the nanowires. Reference Johansson, Dick, Caroff, Messing, Bolinsson, Deppert and Samuelson28,Reference Borg, Johansson, Storm and Deppert29 We show that Pd-seeded GaAs nanowires grow in various directions, including 〈111〉 and 〈001〉, depending on the growth conditions. Straight nanowires with a specific growth direction are promoted by a high growth temperature and low V/III ratio, in a region of the parameter space where nucleation and thus yield is low. In addition, energy dispersive x-ray spectroscopy (EDX) analysis shows that postgrowth seed particles contain a high amount of Ga if grown at high temperature and low V/III ratio. Although the initial Pd particle size was controlled, the postgrowth particle size varies and is often much smaller than the initial size, suggesting that Pd may be lost during growth.
II. METHOD
A. Nanowire growth
GaAs nanowire growth was carried out by metal–organic vapor phase epitaxy in an AIXTRON 3 × 2 in. close coupled showerhead (CCS) reactor (AIXTRON SE, Herzogenrath, Germany) at a pressure of 100 mbar and 8 slm of total gas flow with H2 as the carrier gas. Before the actual nanowire growth, the aerosol decorated epi-ready GaAs (111)B substrates were annealed at a set temperature of 680 °C for 7 min under arsine (AsH3) with a molar fraction 2.5 × 10⁻³ before setting the desired growth temperature. The parameter space for GaAs nanowire growth covered a set temperature range of 350–600 °C and a V/III ratio range from 0.4 to 65. The V/III ratio was changed by varying either trimethylgallium (TMGa) or AsH3 with corresponding molar fractions between χTMGa = 6.98 × 10⁻⁶ − 6.28 × 10⁻⁵ and
 ${\chi _{{\rm{As}}{{\rm{H}}_3}}} = 4.55 \times {10^{ - 5}} - 2.25 \times {10^{ - 3}}$
(the specific parameter changed is specified in the text). After growth, both sources were switched off and the samples were cooled under H2.
Table I summarizes the growth parameters used for the temperature and V/III series presented in this paper. The two temperature series were performed at a V/III ratio of either 0.8 or 24 and the three V/III series were performed with set temperatures of either 450 or 580 °C. In the figures, a representative subset of samples is shown, whereas the complete series is available in the attached supplementary information.
Temperatures and TMGa and AsH3 molar fractions used for the different series presented in the manuscript.

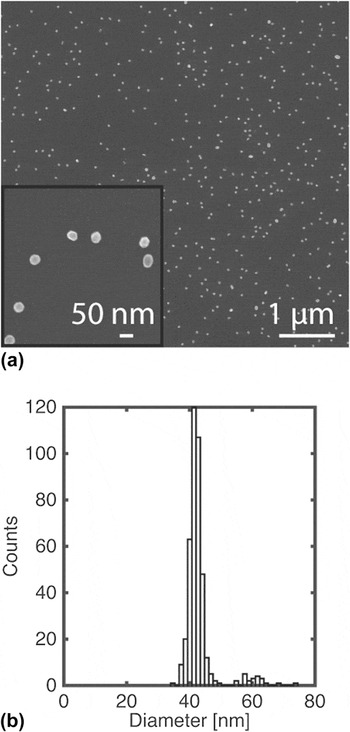
To generate the palladium nanoparticles a SDG was used, see Figure S1. The particle distributions were adapted to the growth series after acquiring feedback from initial nanowire growth experiments. For the V/III series at 450 °C and temperature series at a V/III ratio of 24 the growth time was 5 min, and the substrates were decorated with 42 ± 3 nm Pd particles with a density of 11 µm−2, see Fig. 1. For the temperature series at a V/III ratio of 0.8 and V/III series at 580 °C, the particle size was 40 ± 6 nm with a density of 1.5 µm−2, we will refer to the initial diameter of both initial particle distributions to be 40 nm. Furthermore, a majority of the growth runs were performed on three GaAs (111)B substrates in parallel: one decorated with Pd aerosol particles, one decorated with Au aerosol particles of similar size and density, and finally one bare substrate.
(a) A top-view SEM image of the initial Pd particles before growth with a density of 11 µm−2. In (b), the particle distribution from a bimodal fit yields a dominant peak centered at 42 nm ± 3 nm and a minor peak at 56 nm from overlapping particles.

B. Scanning electron microscopy (SEM) and transmission electron microscopy (TEM) characterization
To evaluate the particle distribution before growth and to perform batch overview analysis of the growth, every nanowire sample was imaged using a Hitachi SU8010 SEM operated at an accelerating voltage of 15 kV (Hitachi, Tokyo, Japan). Size selection and density of the initial particle density was aided by the dedicated software nanoDim. Reference Storm30 The resulting data were used to evaluate overall trends in nanowire morphology and to further carry out a statistical analysis of the relative yield of the different nanowire types (curly, inclined, and vertical; see Sec. IV. A for details). Images used for both initial particle and nanowire analysis were acquired at a 30° tilt angle at 2, 10, and 50 k magnification in the center of the sample with a high pixel density (2560 × 1920) to improve image analysis. For samples with observed local variations, additional images were acquired at different locations, often including an edge image. For estimating the yield of the different wires, an area corresponding to roughly 5000 µm2 was investigated for each sample to count and measure the nanowires manually, whereof the number of vertical or inclined nanowires varied between 7 and 86 with an average of 42. To calculate the nanowire length of vertical nanowires, twice the projected length measured in 30° tilted SEM images was used. However, for inclined nanowires of unknown growth directions, the relationship between the measureable projected length and the true length is unknown. Similarly, curly nanowires kink repeatedly, resulting in the projected length, independent of imaging direction, which always is shorter than the true length. Therefore, the apparent growth rates of curly and inclined nanowires have only been compared qualitatively, side-by-side in SEM images.
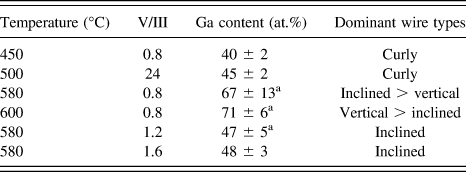
Nanowire transfer for TEM analysis was performed by gently sliding a lacey carbon covered copper grid across the substrate. To ensure that representative nanowires from the entire sample were transferred onto the TEM grid, the mechanical transfer was applied to the entire substrate area. A 300 keV JEOL-3000F (JEOL Ltd., Tokyo, Japan) was used to investigate samples preselected by the SEM batch analysis. Nanowire crystal structure was investigated by high-resolution (HR)-TEM and selected area diffraction pattern (SADP) analysis. For compositional analysis of nanowires and postgrowth particles, EDX was carried out in scanning transmission electron microscopy or in conventional TEM bright field mode by converging the beam onto the nanoparticle, the EDX was aided by Oxford INCA software. The composition is represented in atomic % unless otherwise stated, with an estimated single measurement error of ±2 wt% absolute. Table II shows a mean of 4–10 different nanowires per sample and the error is represented by the sample standard deviation.
Postgrowth gallium content of particles for different growth settings acquired by EDX. The values are presented as the mean Ga atomic % and the standard deviation of the distribution.

a Wide spread of compositions.
III. RESULTS
A. Morphology and structure
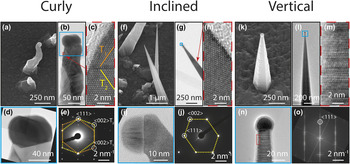
Nanowire growth was observed over a large parameter space with varying morphology; depending on growth conditions, one or several morphologies coexisted on the same substrate. To investigate the effect of growth parameters on morphology the nanowires were divided into three categories: curly, inclined, and vertical (Fig. 2). To observe differences in crystal structure, growth direction, and particle composition, TEM investigations were done on samples where the different types coexisted in reasonable fractions for statistical analysis.
(a) SEM image (30° tilt) of a typical curly nanowire grown at 500 °C and a V/III ratio of 24. (b) TEM image of a nanowire from the sample shown in (a), with a 75 nm wide particle and a nonflat particle/nanowire interface observed in (d). A twinned zinc blende crystal structure is observed from the inset in (c) and confirmed in the SADP of the wire in (e). (f) SEM image (30° tilt) of typical inclined nanowires grown at 580 °C and a V/III ratio of 1.2. (g) TEM image of a nanowire from the sample shown in (f), with a 25 nm particle/nanowire interface observed in (i). A defect-free zinc blende crystal structure and 〈001〉 growth direction are deduced from the SADP in (j) and the inset (h) from the wire in (g). (k) SEM image (30° tilt) of a typical vertical nanowire grown at 590 °C and a V/III ratio of 0.8. (l) TEM image of a vertical nanowire grown at 600 °C and a V/III ratio of 0.8, with a 22 nm truncated spherical particle observed in (n). A mixed crystal structure and a 〈111〉 growth direction are deduced from (m) and FFT of the wire in (o).

Curly nanowires are defined by their frequently changing growth direction and numerous kinks. If grown for long enough the nanowires appear to swirl or curl, hence their name. See Fig. 2(a) for a SEM image of typical curly nanowires with clearly defined particles, where the width of the particle/nanowire interface varies across samples with an average of 57 ± 15 nm. The measurements were done in angles nonperpendicular to the nanowire/particle interface for 77 nanowires across 5 different samples, and this serves as a first approximation of the particle size on curly nanowires. Figure 2(b) shows a TEM bright field image of a curly nanowire. In Fig. 2(d), a typical faceted particle with a nonflat interface to the nanowire is observed. Note that the nonflat interface is not necessarily a consistent feature of the curly nanowires but has not been observed for the other nanowire types. The SADP in Fig. 2(e) from the observed wire reveals a twinned zinc blende crystal structure. In addition, in Fig. 2(c), HRTEM of the structure shows two rotational twins, denoted as T1 and T2. Occasionally curly nanowires continue to grow along a single direction. TEM of such nanowires reveal a flat particle/nanowire interface, either inclined or perpendicular to the growth direction; see (Fig. SI 2).
Inclined nanowires are defined as nanowires that grow in a specific growth direction, inclined to the (111)B substrate, and have no more than one clearly visible kink. See Fig. 2(f) for a SEM image of inclined nanowires grown simultaneously with curly nanowires (visible in the background). Inclined nanowires are typically much longer than curly nanowires, interpreted as having a higher growth rate. In addition, these particular nanowires have four side-facets (only two of them visible in the SEM images), a barely visible particle at the tip, and are tapered. In Fig. 2(g), TEM image of a straight inclined nanowire from the same sample is shown, grown in a 〈001〉 growth direction with defect-free zinc blende crystal structure, as observed by zinc blende stacking in the high resolution inset [Fig. 2(h)] and SADP of the nanowire [Fig. 2(j)]. In Fig. 2(i), the particle diameter is observed to be 25 nm, with a hemispherical or truncated spherical shape. Note that this is considerably smaller than the initial Pd particle diameter of 40 nm. EDX analysis shows that the particle consists of about 50% Ga and 50% Pd. Other growth directions are also expected from extensive SEM investigations, due to common orientations not consistent with 〈001〉 and the presence of nanowires with more than four facets; however, other specific orientations have not been confirmed.
Vertical nanowires are defined as nanowires that are growing straight and vertically aligned to the GaAs (111)B substrate and are thereby presumed to grow in a 〈111〉 B direction. See Fig. 2(k) for a SEM image of a vertical nanowire, which shows tapering and an apparently hexagonal cross section. This is similar to gold-seeded nanowires grown during the identical run; however, gold-seeded nanowires were observed to be shorter, see Fig. SI 3. In Fig. 2(l), a TEM bright field image of a straight nanowire from a sample with mostly vertical nanowires shows numerous rotational stacking defects and the fast Fourier transform (FFT) [Fig. 2(o)] confirms growth along a 〈111〉 direction. In Fig. 2(n), the particle is 22 nm in diameter and spherical (notably smaller than the initial Pd nanoparticle diameter of 40 nm). Additionally, EDX analysis of the particle shows a high Ga incorporation of 75%. Occasionally, vertical nanowires of varying length and particle size are also observed within the same sample, and the side facet smoothness varies (Fig. SI 4).
B. Effect of growth temperature
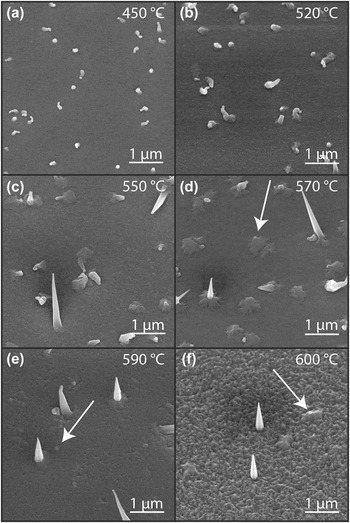
Investigation of the effect of temperature was performed for two V/III ratios; see Fig. 3 for a V/III ratio of 0.8, Fig. 4 for statistics on straight wires at this V/III ratio, and Fig. 5 for a V/III ratio of 24.
Temperature series at a V/III ratio of 0.8, represented by 30° tilt SEM images. (a and b) Below 520 °C only curly nanowires are present. (c) At 550 °C, a mixture of nanowires is observed, including inclined nanowires. (d–f) The relative yield of vertical nanowires increases for increasing temperature and at 600 °C the majority of nanowires are vertical. In addition, the substrate surface is considerably rougher after growth at this temperature. Arrows indicate particles on the substrate (presumed to be Pd) that are not associated with a nanowire.

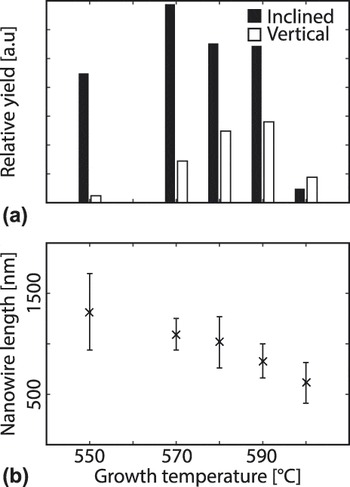
(a) Yield of inclined and vertical nanowires normalised to the initial particle density for a V/III ratio of 0.8 and growth temperatures from 550 to 600 °C. This shows that the formation of vertical nanowires is promoted by a high growth temperature. (b) The mean length of vertical nanowires decreases with increasing temperature (error bars represent the standard deviation).

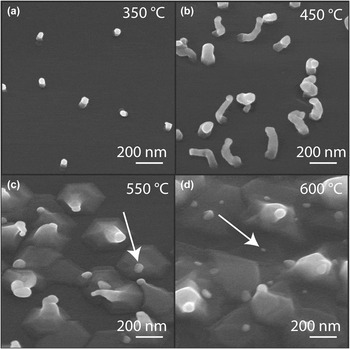
Temperature series at a V/III ratio of 24, represented by 30° tilt SEM images. (a and b) Curly nanowires are observed at lower temperatures while (c and d) at higher temperatures fewer nanowires and substrate growth near the nanowire base are observed.

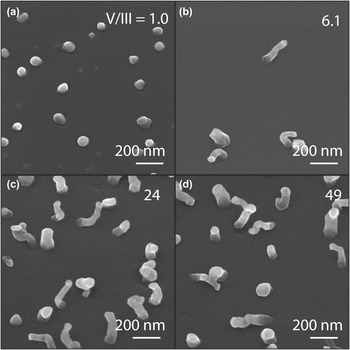
Figure 3 at a V/III ratio of 0.8 shows nanowires from a temperature series grown between 450 and 600 °C. At the lowest studied growth temperatures (450–520 °C) only curly nanowires are observed. At 550 °C inclined nanowires and occasional vertical nanowires are observed in addition to curly nanowires. However, compared to lower growth temperatures, especially to 450 °C, it is clear that the density of curly nanowires is lower. At 570–600 °C, very few curly nanowires are observed and most nanowires are either vertical or inclined. At the highest temperature investigated, 600 °C, we observe mostly vertical nanowires and a considerably rougher substrate surface. The total density of nanowires decreases with temperature, although the initial Pd nanoparticle density was identical for all samples shown here. Hence, not all particles form nanowires at higher temperatures, as is clearly observed from the particles visible on the substrate surface (with examples highlighted using arrows in Fig. 3).
Both vertical and inclined nanowires are observed throughout the temperature range of 550–600 °C, but the relative yield changes with growth temperature; see Fig. 4(a). There are more inclined nanowires than vertical for all but the highest temperature studied, 600 °C. Vertical nanowires are observed first at 550 °C, and the density increases for temperatures up to 590 °C and then decreases. Similarly, inclined nanowires are observed at 550 °C and the density increases for temperatures up to 570 °C and then decreases (inclined wires are occasionally observed even at 520 °C) Furthermore, the average length of the vertical nanowires decreases with growth temperature [Fig. 4(b)], and varies considerably within the same sample.
Figure 5 shows SEM images of selected samples from a temperature series with a V/III ratio of 24; only selected temperatures that represent the major observations are shown. Note that for the 350 °C sample, a lower initial Pd particle density was used; however, density effects were observed to be negligible (see Fig. SI 5). For temperatures up to 400 °C, only very short nanowires are observed. Up to 500 °C, the typical curly nanowires described in connection with Fig. 2 are observed. However, at 550 °C and above, extensive substrate growth is apparent, especially at the nanowire base. In addition, occasional inclined nanowires similar to those grown at lower V/III ratios have been observed at 550 °C. Similarly, to the temperature series at a V/III ratio of 0.8 a decrease in nanowire density is observed at temperatures above 550 °C. The effect is best illustrated at the highest temperature, where higher contrast spots indicate Pd particles that have not initiated (nanowire) growth. Consequently, the main effect of temperature at this V/III ratio is first an increase of growth rate, followed by a small region where inclined nanowires exist, and a transition to substrate/radial growth and reduced nanowire density. The full series is included in Fig. SI 6.
C. Effect of V/III ratio
Three V/III series were performed: two at 580 °C by varying either the AsH3 (Fig. 6) or TMGa (Fig. 7) molar fraction and one at 450 °C (Fig. 8) by varying the AsH3 molar fraction.
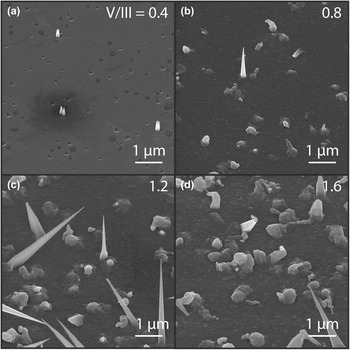
V/III series at 580 °C by changing the AsH3 supply, represented by 30° tilt SEM images. Increasing the V/III ratio controls the transition from (a) vertical, to (b) vertical and curly, to (c) inclined and curly, and (d) mostly curly with some inclined nanowires. In addition, a dramatic increase in nanowire length is observed.

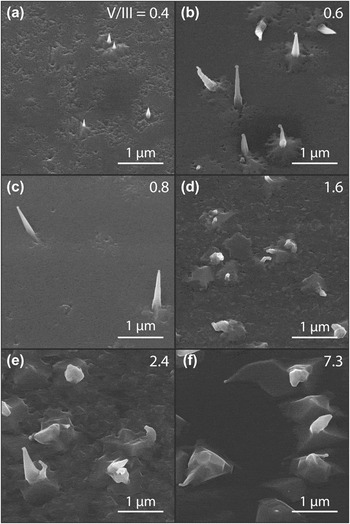
V/III series at 580 °C by changing the TMGa supply, represented by 30° tilt SEM images. For a decreasing TMGa flow (increasing V/III ratio) a transition from (a–c) vertical to (d–f) curly nanowires can be observed.

V/III series at 450 °C by changing the AsH3 supply, represented by 30° tilt SEM images. For an increasing AsH3, (increasing V/III ratio) a transition from (a) low growth rate to (b–d) a higher growth rate is observed.

Figure 6 shows results from the V/III series performed by changing the AsH3 supply at 580 °C. At a very low V/III ratio of 0.4, only short vertical nanowires are observed, while at a V/III ratio of 0.8, longer vertical nanowires and curly nanowires can be observed. At V/III ratios of 1.2 and 1.6, very long inclined nanowires can be recognized. In addition to the inclined nanowires, a larger number of shorter curly nanowires also exist on the substrate. An increase in growth rate with increasing AsH3 is apparent from the increase in total volume of the nanowires, especially noticeable for straight nanowires. In comparison to the temperature series in Fig. 3, a similar morphology change from mixed nanowire types to mainly vertical nanowires is observed for decreasing V/III ratio (decreasing AsH3 flow).
Figure 7 shows a V/III series performed by changing the TMGa supply at 580 °C. Similar to the AsH3 series, a transition from vertical to mixed nanowire types is observed for increasing V/III ratio (decreasing TMGa flow). However, for this series, an increase of growth rate with increasing V/III ratio is not observed. This is perhaps reasonable since in the former case, we were increasing AsH3, while here we decrease TMGa—indicating that the growth is As-limited. In addition, substrate growth near the base of the nanowires is substantial for V/III ratios above 2.4.
Figure 8 shows SEM images of selected samples from a V/III series performed by varying the AsH3 supply at a growth temperature of 450 °C; selected samples are shown to represent the major observations. At V/III ratios below 1.8, only large particles compared to the initial Pd particle size are observed. For V/III ratios above 6.5, the nanowires are curly, and further increasing the AsH3 flow causes no perceivable effect. This suggests that AsH3 flow controls the growth rate at low growth temperatures and low V/III ratio (V-limited regime) but not at high V/III ratio (III-limited regime). Note that for a V/III ratio of 6.5 a lower particle coverage of 1.5 µm−2 was used. Images of the complete V/III series are given in Fig. SI 7.
D. Particle analysis
Table II summarizes the EDX analysis of the postgrowth particle composition depending on growth parameters and the dominant nanowire type of the sample. Only two samples show a very high Ga content, grown at a V/III ratio of 0.8 and temperatures of 580 and 600 °C. These are also the two samples with the highest proportions of vertical nanowires. However, the particle compositional analysis of nanowires grown at 580 °C and a V/III ratio of 0.8 shows a large standard deviation in Ga content strongly indicating that the composition of the particles varies. At lower temperatures and higher V/III ratios, the average Ga content was below 50% and the variation within each sample was lower. The vast majority of the particles showed an As content below the detection limit of the EDX analysis, however particles had up to 9% As, possibly originating from the nanowire.
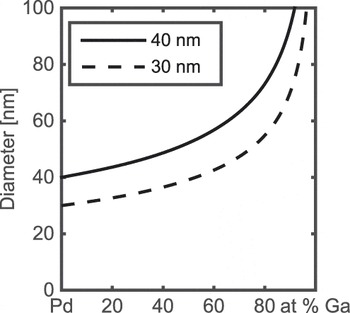
To relate the postgrowth particle size to the known initial Pd nanoparticle size, a basic model was assumed to calculate the expected postgrowth size of a Pd–Ga alloy particle. We assumed a spherical particle and linear density dependence for x of Pd x Ga1−x . The expected size increase with Ga incorporation is shown in Fig. 9, modeling the increase in size for 40 and 30 nm particles as a function of Ga incorporation. From the EDX measurements, we know that postgrowth particles typically consist of 40–50% Ga and in some extreme cases up to 80%. Assuming an initial particle size of 40 nm that would yield almost 50 nm particles for 50% Ga and 70 nm particles for 80% Ga. Such particles have been verified but, interestingly we have also observed particles far smaller than expected, such as the 22 nm particle with 75% Ga in Fig. 2(n), clearly not consistent with an initial particle size of 40 nm. This suggests that the nanoparticles may lose Pd either before or during the growth, for example via particle splitting or incorporation into the growing nanowire. Annealing tests were performed to investigate if the annealing process caused any such effects, however, the results were difficult to interpret. To investigate possible incorporation of Pd into the nanowire, EDX spectra were acquired from several nanowires; however, the Pd signal was always below the detection limit of 2 wt.%. Making some geometric assumptions of truncated cylindrical nanowires, we calculate that the relative mass of the Pd nanoparticle is less than 0.2 wt.% for the two straight wires in Fig. 2. Thus, it is difficult to verify by EDX whether Pd has been incorporated.
Estimated diameter of palladium particles after Ga incorporation, for 40 and 30 nm initial particle diameters.

IV. DISCUSSION
We have observed the formation of three different nanowire morphologies, denoted curly, inclined and vertical. From the explored process parameter space, we observe that high growth temperature and low V/III ratio suppress curly nanowires and promote straight nanowire growth. In parallel, we observe postgrowth a higher Ga content in the particle for nanowires grown at low V/III ratio and high growth temperature, and particles have a more spherical shape compared to the faceted particles observed at lower temperature and higher V/III ratio. From the Pd–Ga phase diagram, Reference Predel and Madelung31 it is known that the liquid phase is promoted by high Ga/Pd ratio and growth temperature. Furthermore, for growth conditions for which we observe both curly and straight nanowires, the straight nanowires are much longer, consistent with the faster growth rate often associated with VLS growth. Reference Kodambaka, Tersoff, Reuter and Ross24,Reference Thombare, Marshall and McIntyre32 Therefore, we propose that the two straight nanowire types, inclined and vertical, are associated with liquid particles, while curly wires are associated with solid particles.
Curly nanowires have been observed to contain multiple rotational twinned zinc blende segments and sometimes to have a nonflat seed particle/nanowire interface. Nanowire growth from solid particles has previously been shown to occur by step/ledge-flow at the seed particle/nanowire interface Reference Hofmann, Sharma, Wirth, Cervantes-Sodi, Ducati, Kasama, Dunin-Borkowski, Drucker, Bennett and Robertson25,Reference Wen, Tersoff, Reuter, Stach and Ross33 ; thus, it has been proposed that such an anisotropic interface induces twin-mediated kinking, responsible for the curly morphology. Reference Xu, Guo, Liao and Sun34 A solid Pd–Ga seed particle may therefore explain the observed curly morphology. Although VSS growth is generally associated with lower growth rates due to the lower bulk diffusion in solids than in liquids, the absolute magnitude of the growth rate also depends on the particle material. Solid Pd nanoparticles have previously been shown in-situ to seed Si nanowires at a remarkable rate, faster than nanowires grown with liquid gold seeds. Reference Hofmann, Sharma, Wirth, Cervantes-Sodi, Ducati, Kasama, Dunin-Borkowski, Drucker, Bennett and Robertson25 This is consistent with our observed curly wires, growing at rates similar to gold seeded nanowires.
Previous work for Pd-seeded InAs nanowires Reference Xu, Guo, Liao and Sun34 reported a coexistence of curly nanowires with large particles and inclined nanowires with small particles. The authors proposed that small particles were more likely to be liquid due to thermodynamic size effects, promoting growth of straight (inclined) nanowires, while larger particles remained solid and promoted curly nanowire growth. It is also well known that small particles promote growth directions such as 〈112〉 and 〈110〉. Reference Schmidt35,Reference Cai, Gong and Wang36 However, in this work, we have, for inclined and vertical Pd-seeded GaAs nanowires, observed particle sizes much smaller than what is expected from the initial particle size. Therefore, it appears that the small particles are not necessarily the cause of inclined and straight growth, but may be a side effect of, for example, unintentional incorporation of Pd into the nanowire. We speculate that the formation of liquid Pd–Ga droplets (rather than solid Pd–Ga particles) may lead to shrinking of the droplet due to a reduced detachment energy.
On the other hand, previous work also shows that the particle/substrate interface of a solid particle may control the nanowire growth direction, leading to for example Au-seeded 〈001〉 InAs Reference Zhang, Zheng, Lu, Chen, Lu and Zou37 and Ni-seeded 〈110〉 Ge. Reference Xu, Guo, Liao and Sun34 It may instead be that all of the nanowires in this study grow with solid particles, but that the different growth conditions and Ga contents lead to different favorable interfaces, in turn leading to the observed morphologies. Since the EDX analysis reported here is performed postgrowth, we cannot definitively conclude what the phase of the particle is during growth. Nevertheless, circumstantial evidence most strongly supports the hypothesis that straight nanowires grow from liquid particles: These nanowires exhibit faster growth rates than curly nanowires (for the same growth conditions), more spherical particles postgrowth, and increased yield (relative to curly nanowires) under conditions for which liquid particles would be most likely to form.
For the explored parameter space, an increase in temperature yields fewer nanowires, attributed to nucleation difficulties. This is problematic for the use of Pd as a seed particle, since it is desirable to achieve nanowires with a high yield for specific growth directions. However, we note that both the inclined and (especially) vertical morphologies are most common for growth conditions where nucleation is difficult. For future applications it is of great interest to improve the nucleation, for example by using a two-step growth procedure, Reference Joyce, Gao, Tan, Jagadish, Kim, Zhang, Guo and Zou38 starting at a different V/III ratio or temperature. However, we have only observed high nucleation rates for conditions leading to growth of only curly nanowires, which is highly unsuitable if a controlled growth direction is desired in the continued growth.
V. CONCLUSION
We have reported the growth of GaAs nanowires seeded from size- and density-controlled Pd nanoparticles at various growth temperatures and V/III ratios. The grown nanowires show three different types of morphologies, denoted as curly, inclined, and vertical. We show that in principle it is possible to tune between these with growth parameters, and among the straight morphologies confirm at least two different growth directions, 〈111〉 B and 〈001〉. We have shown that a low V/III ratio and high growth temperatures, conditions that by EDX are shown to promote a higher Ga incorporation into the Pd particles, in general promote straight nanowire growth. Differences observed in apparent growth rate, composition and the shape of the postgrowth particle suggest that only the straight nanowire types were grown with liquid particles, while curly nanowires most likely grow from solid particles. Furthermore, we have seen evidence that Pd may be lost during growth or annealing, as post growth particle sizes far smaller than the initial size have been observed. Our observations demonstrate that control of the seed nanoparticle phase and composition during growth may allow for selective tuning of nanowire growth direction and morphology.
Supplementary Material
To view supplementary material for this article, please visit http://dx.doi.org/jmr.2015.400.
ACKNOWLEDGMENTS
The authors acknowledge financial support from the European Research Council under the European Union's Seventh Framework Program (FP/2007–2013)/ERC Grant Agreement No. 336126, and from the Swedish Research Council (VR), the Knut and Alice Wallenberg Foundation (KAW) and the Nanometer Structure Consortium at Lund University (nmC@LU).