


I. INTRODUCTION
Due to the interplay between order parameters and external stimulations, ferroics such as ferroelectrics, ferromagnetics, and multiferroics offer many advantages in the field of information storage, sensors and, actuators. Reference Scott1–Reference Martin and Ramesh3 The strain related structural distortion, which often connects to the order parameters of ferroics, has been demonstrated to be an effective degree of freedom to manipulate the properties of ferroic materials. Reference Schlom, Chen, Eom, Rabe, Streiffer and Triscone4,Reference Schlom, Chen, Fennie, Gopalan, Muller, Pan, Ramesh and Uecker5 The enhancement of ferroelectricity, triggering ferroelectricity, and multiferroelectricity can be achieved in thin films where structural distortions are naturally imbedded through substrate constraints. Reference Lee, Fang, Vlahos, Ke, Jung, Kourkoutis, Kim, Ryan, Heeg, Roeckerath, Goian, Bernhagen, Uecker, Hammel, Rabe, Kamba, Schubert, Freeland, Muller, Fennie, Schiffer, Gopalan, Johnston-Halperin and Schlom6–Reference Choi, Biegalski, Li, Sharan, Schubert, Uecker, Reiche, Chen, Pan, Gopalan, Chen, Schlom and Eom8 In addition, the spontaneous structural distortion, an intrinsic feature of ferroic materials below Curie temperature, interacts with the substrate constraint so that novel strains states Reference Catalan, Lubk, Vlooswijk, Snoeck, Magen, Janssens, Rispens, Rijnders, Blank and Noheda9 and domain structures Reference Tang, Zhu, Ma, Borisevich, Morozovska, Eliseev, Wang, Wang, Xu, Zhang and Pennycook10 can emerge. Understanding such kind of interaction, especially how the lattice distortions at an atomic scale behave, would be of crucial to underline the relevant physical natures as well as to potentially manipulate the related physical properties for nanoscale ferroic devices.
BiFeO3, one of the most widely studied ferroics, can show rich phase states, Reference Infante, Lisenkov, Dupé, Bibes, Fusil, Jacquet, Geneste, Petit, Courtial, Juraszek, Bellaiche, Barthélémy and Dkhil11–Reference Yang, He, Suresha, Kuo, Peng, Haislmaier, Motyka, Sheng, Adamo, Lin, Hu, Chang, Tjeng, Arenholz, Podraza, Bernhagen, Uecker, Schlom, Gopalan, Chen, Chen, Ramesh and Chu13 controllable ferroelectric variants, Reference Chu, Cruz, Yang, Martin, Yang, Zhang, Lee, Yu, Chen and Ramesh14,Reference Chu, Zhan, Martin, Cruz, Yang, Pabst, Zavaliche, Yang, Zhang, Chen, Schlom, Lin, Wu and Ramesh15 and versatile domain wall configurations Reference Seidel16 in terms of heterofilms. Tetragonal BiFeO3 with a giant c/a ratio can be stabilized if compressive strain is larger than −4.5%, Reference Zeches, Rossell, Zhang, Hatt, He, Yang, Kumar, Wang, Melville, Adamo, Sheng, Chu, Ihlefeld, Erni, Ederer, Gopalan, Chen, Schlom, Spaldin, Martin and Ramesh12 while the orthogonal phase is predicted to exist when tensile strain is over 1%. Reference Yang, He, Suresha, Kuo, Peng, Haislmaier, Motyka, Sheng, Adamo, Lin, Hu, Chang, Tjeng, Arenholz, Podraza, Bernhagen, Uecker, Schlom, Gopalan, Chen, Chen, Ramesh and Chu13 A stripe-like domain pattern or irregular domain pattern can be produced by using appropriate substrates. Reference Chu, Cruz, Yang, Martin, Yang, Zhang, Lee, Yu, Chen and Ramesh14 For BiFeO3, the effect of heterostructures, in fact, also reflects on mediating the coherent structural distortions that include the rhombohedral distortion and domain wall shear distortion. Theoretical studies based on elastic theory have been done to dealing with the effect of substrate constraints on the rhombohedral distortion. Reference Streiffer, Parker, Romanov, Lefevre, Zhao, Speck, Pompe, Foster and Bai17–Reference Huang, Chen, Wang, He, Yang, Chu and Ramesh20 Experimentally, studies based on reciprocal methods or real space methods have been carried out and mainly focused on domain pattern geometries. Reference Chu, Cruz, Yang, Martin, Yang, Zhang, Lee, Yu, Chen and Ramesh14,Reference Chu, Zhan, Martin, Cruz, Yang, Pabst, Zavaliche, Yang, Zhang, Chen, Schlom, Lin, Wu and Ramesh15,Reference Giencke, Folkman, Baek and Eom21 For example, Chu et al. showed that in-plane lattice constraints of an orthoscandate substrate allow two kinds of rhombohedral distortions (ferroelectric variants) existing in films based on piezoelectric force microscopy (PFM) analysis, Reference Chu, Zhan, Martin, Cruz, Yang, Pabst, Zavaliche, Yang, Zhang, Chen, Schlom, Lin, Wu and Ramesh15 while Giencke et al. reported that by using three dimensional constraints of substrates, only one kind of rhombohedral distortion can be achieved. Reference Giencke, Folkman, Baek and Eom21 Although advanced aberration corrected transmission electron microscope has been applied to study the atomic structures of BiFeO3 thin films. Reference Li, Gao, Nelson, Jokisaari, Zhang, Kim, Melville, Adamo, Schlom and Pan22–Reference Wang, Zhu, Tang, Xu, Liu, Li, Zhang, Wang and Ma25 A direct mapping on an atomic scale of the interaction between substrate constraints and the coherent structural distortions in related ferroics, especially for BiFeO3, is inadequate up to now.
Here, by means of advanced aberration corrected transmission electron microscope, we studied on atomic scale the interplay of substrate constraints and the coherent structural distortions in 109° domain patterned BiFeO3 thin films. Structural parameters including the rhombohedral distortion and domain wall shear distortion near the interface are quantitatively demonstrated. An interfacial layer with asymmetric distributed lattice distortions emerges. The result implies that, by making use of certain internal structural distortions and boundary conditions, additional structural features could be triggered at the local area near/at heterointerfaces in BiFeO3 thin films, which could be helpful for exploring novel properties for related nanoscale ferroelectric devices.
II. EXPERIMENT
(001)P oriented BiFeO3 thin films were epitaxially grown on (110)O oriented GdScO3 and PrScO3 single crystal substrates by pulsed laser deposition (PLD) (where the P and O subscripts stand for pseudocubic and orthorhombic index, respectively). The pseudocubic lattice constants of GdScO3 and PrScO3 are about 3.97 Å and 4.02 Å, Reference Liferovich and Mitchell26 indicating almost zero lateral misfit strain for BiFeO3/GdScO3, whereas a tensile strain as high as 1.5% for BiFeO3/PrScO3. The growth temperature was 680 °C, with an oxygen pressure of 13 Pa and a laser frequency of 10 Hz. After deposition, the films were in situ annealed in pure O2 under 5 × 10⁴ Pa for 30 min before cooled down to room temperature. Scanning transmission electron microscopy (STEM) samples were prepared by conventional methods including slicing, gluing, grinding, and final ion milling. A Titan G2 60–300 microscope (FEI Company, Eindhoven, The Netherlands) with a high-brightness field-emission gun and double aberration (Cs) correctors was used to acquire STEM images. A quantitative analysis of the atomic-resolution STEM images was based on the plug-in in Matlab which determines the positions of atoms by fitting the intensity profiles using two-dimensional Gaussian fittings. Reference Anthony and Granick27 The substrates are used as references to correct possible drift distortions.
III. RESULTS
A. General information
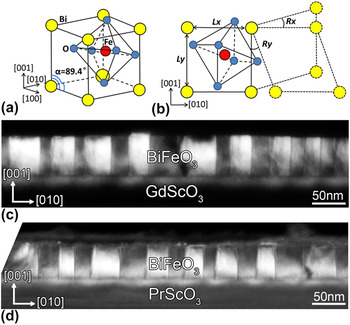
The bulk BiFeO3 has a distorted perovskite structure (space group R3c) with pseudo-cubic unit cell of a = 3.965 Å and α = 89.4°, as shown in Fig. 1(a). The spontaneous polarization (Ps) of BiFeO3 is along 〈111〉P directions, thus eight ferroelectric variants and four ferroelastic variants can exist. The corresponding ferroelectric domain configurations are 109°, 71° and 180°, respectively. In the present work, we focused on the 109° domain pattern since it can be easily obtained Reference Chu, Zhan, Martin, Cruz, Yang, Pabst, Zavaliche, Yang, Zhang, Chen, Schlom, Lin, Wu and Ramesh15,Reference Chu, He, Yang, Yu, Martin, Shafer and Ramesh28 and many novel properties were found on such domain walls. Reference Seidel, Martin, He, Zhan, Chu, Rother, Hawkridge, Maksymovych, Yu, Gajek, Balke, Kalinin, Gemming, Wang, Catalan, Scott, Spaldin, Orenstein and Ramesh29,Reference He, Yeh, Yang, Singh-Bhalla, Liang, Chiu, Catalan, Martin, Chu, Scott and Ramesh30 To describe the structural features of BiFeO3 in an appropriate way, we introduce lattice spacing (L x , L y ) and lattice rotation (R x , R y ) as structural variables in Fig. 1(b). The intrinsic structural nature of the 109° domain pattern and influence of substrate constraints then can be studied in detail. (001)P oriented BiFeO3 thin films were grown on (110)O GdScO3 and (110)O PrScO3 single crystal substrates using PLD. The (110)O oriented scandate substrate has a monoclinic distorted constraint onto BiFeO3 which can result in a 109° domain pattern. Reference Wang, Zhu, Tang, Xu, Liu, Li, Zhang, Wang and Ma25,Reference Chen, Damodaran, Xu, Lee and Martin31 Figures 1(c) and 1(d) show the domain geometries of two systems, BiFeO3(∼60 nm)/GdScO3 and BiFeO3(∼50 nm)/PrScO3, respectively. The stripe-like domain geometry with periodic bright and dark contrast in Figs. 1(c) and 1(d) convinces the existence of the 109° domain pattern. Reference Wang, Zhu, Tang, Xu, Liu, Li, Zhang, Wang and Ma25,Reference Chen, Qi, You, Yang, Huang, Wang, Sritharan and Chen32,Reference Qi, Chen, Huang, Wang, Han, Wang, Yang, Sritharan and Chen33 The BiFeO3/GdScO3 thin film system with negligible lattice mismatch, providing minimized external constraints, can serve as a reference to study the structural feature of the 109° domains, while the BiFeO3/PrScO3 thin film system with a lattice mismatch as large as 1.5% can offer an intense substrate constraint onto 109° domains.
(a) A schematic model of the pseudocubic unit cell of BiFeO3. Note that the interangle of three 〈100〉P axes is 89.4° representing the spontaneous rhombohedral distortion (the P subscript stands for pseudocubic index). (b) Structural variations of BiFeO3. L y and L x represent the local lattice spacing while R x and R y represent the local lattice rotation. (c–d) Dark field images of cross-sectional BiFeO3/GdScO3 and BiFeO3/PrScO3 thin films, respectively.

B. Structural features of unstrained 109° domains
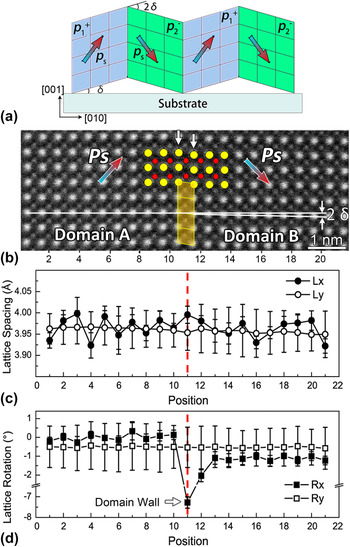
The 109° domains of BiFeO3 are both ferroelectric and ferroelastic, which means that the adjacent domains have different distortion directions, as shown in Fig. 2(a). Each ferroelectric variant obtains a mismatch angle δ with the substrate, thus the adjacent domains have a mismatch angle of 2δ. This mismatch angle stands for a kind of spontaneous structural distortion (rhombohedral distortion). In fact, the structure of the 109° domain pattern far away from the film/substrate interface for BiFeO3 grown on GdScO3 could resemble the ideal situation of the relaxed 109° domain in Fig. 2(a) because the influences of the misfit strain and interface are minimized in such a system. Figure 2(b) is an atomic-resolution high angle annular dark field scanning transmission electron microscopy (HAADF-STEM) image revealing a 109° domain pattern far away from the BiFeO3/GdScO3 interface. As the intensity of the HAADF-STEM image connects to the atomic number (roughly proportional to Z 2), Reference Tang, Zhu, Ma, Borisevich, Morozovska, Eliseev, Wang, Wang, Xu, Zhang and Pennycook10,Reference Nelson, Winchester, Zhang, Kim, Melville, Adamo, Folkman, Baek, Eom, Schlom, Chen and Pan23,Reference Wang, Tang, Zhu, Xu, Liu, Wang, Jagadeesh and Ma24 element species can be deduced according to the intensity of atomic columns. Therefore, in Fig. 2(b), the big bright spots are Bi columns and small weak spots are Fe columns. For the O columns, they are invisible in the HAADF mode due to its weak scattering abilities on electrons. It is also noticeable that the relative displacement of Fe sublattice in each unit cell can be clearly resolved which is inverse with the Ps direction [colored arrow in Fig. 2(b)]. Reference Tang, Zhu, Ma, Borisevich, Morozovska, Eliseev, Wang, Wang, Xu, Zhang and Pennycook10,Reference Nelson, Winchester, Zhang, Kim, Melville, Adamo, Folkman, Baek, Eom, Schlom, Chen and Pan23,Reference Wang, Tang, Zhu, Xu, Liu, Wang, Jagadeesh and Ma24 The rhombohedral distortion visualized by the mismatch angle 2δ of nearby domains can be noticed according to the relative rotation of the horizontal lattice (Bi sublattice) of nearby domains, as shown in Fig. 2(b). The location of the domain wall can be determined based on the directions of sublattice displacements, and the obvious lattice shear distortion can be noticed at the domain wall [marked by the two white arrows and the superposed structural model inserted in Fig. 2(b)]. Note that such a domain wall distortion is concentrated on only one unit cell in width which has been also reported by several studies previously. Reference Wang, Tang, Zhu, Xu, Liu, Wang, Jagadeesh and Ma24,Reference Lubk, Rossell, Seidel, He, Yang, Chu, Ramesh, Hÿtch and Snoeck34,Reference Wang, Nelson, Melville, Winchester, Shang, Liu, Schlom, Pan and Chen35 The above structural features of 109° domains in Fig. 2(b) are further demonstrated in Figs. 2(c) and 2(d) in a quantitative way, where line profiles of L x , L y , R x , and R y across the domain wall are shown. To minimize the scanning noise, the results of unit cells with the same distances (the same unit cell position) to the domain wall are averaged. Figure 2(c) shows the line profiles of L x and L y , which stay nearly constant in both two domains and their domain walls. Figure 2(d) shows the line profiles of R x and R y . On the one hand, R x is relatively stable inside every domain but has a small difference ∼1° between domain A and domain B. This difference precisely represents the mismatch angle 2δ. It is also noticeable that at the domain wall (position 11), R x drops as large as about 7° (the horizontal lattice rotation of domain A is normalized as zero) which features the domain wall lattice shear distortion. On the other hand, R y is nearly unchanged in both two domains and the domain walls. It is worthwhile to mention that these characters of lattice distortions at the domain wall can serve as a fingerprint to identify the location of the 109° domain wall. Based on the above analysis, the lattice distortion feature of unstrained 109° domains can be represented in terms of the rhombohedral distortion 2δ and domain wall distortion R x .
(a) A schematic of relaxed 109° domains. δ is the mismatch angle between the domain and substrate, and 2δ is the mismatch angle of nearby domains. (b) An atomic resolved HAADF-STEM image of a 109° domain pattern far away from the film/substrate interface (BiFeO3/GdScO3) along [100]P the zone axis. The scale bar is 1 nm. The mismatch angle 2δ between domain A and B is traced. (c–d) Line profiles of L x , L y , R x , and R y across the domain wall in (b).

C. Structural features of 109° domains near interface
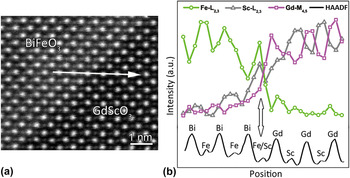
To maintain an epitaxial relationship, local distortions can be imposed onto a film to match the substrate constraint. Reference Streiffer, Parker, Romanov, Lefevre, Zhao, Speck, Pompe, Foster and Bai17,Reference Romanov, Lefevre, Speck, Pompe, Streiffer and Foster18 Such a kind of boundary condition could play an important role in the properties of thin films especially for a ferroelectric thin film due to the coupling of polarization with the lattice distortion. For the BiFeO3/GdScO3 thin film system, although it provides relatively small lateral lattice mismatch, the pinning effect of the film/substrate near the interface would still exist. To clarify such an effect of substrate constraints, we first focus on element intermixing of the interface for the BiFeO3/GdScO3 thin film. Figure 3(a) is an atomic-resolved HAADF-STEM image of the BiFeO3/GdScO3 thin film recorded along the [100]P zone axis of BiFeO3. Electron energy loss spectroscopic (EELS) line scan analysis is performed in the atomic plane marked by the arrow. The corresponding element distributions are revealed, as shown in Fig. 3(b). As the M 4,5 edges of Bi are out of the acquisition range of the EELS signal in the present study, we use edges of Fe, Pr, and Sc. In Fig. 3(b), intermixing of Fe and Sc indicated by the arrow is resolved, which is within one unit cell.
(a) An atomic-resolved HAADF-STEM image of the BiFeO3/GdScO3 interface along [100]P. EELS line analysis is performed in the atomic plane marked by the arrow. (b) A chemical line profile across the BiFeO3/GdScO3 interface. The vertical arrow denotes the position with element intermixing.

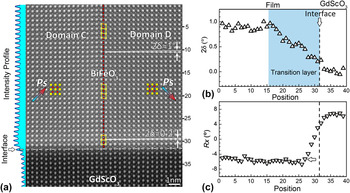
Figure 4(a) is an atomic resolved HAADF-STEM image of a 109° domain near the BiFeO3/GdScO3 interface. The lattice structural features, mismatch angle 2δ, and domain wall lattice rotation R x of the 109° domain reveal noticeable changes near the interface, comparing with the unstrained one in Fig. 2(b). For the mismatch angle 2δ, it gradually reduces from 1.0° to 0.2° when approaching the interface. For the domain wall shear distortion R x , a similar trend is illustrated by yellow frames where the shear feature almost disappears near the interface. Quantitative representations of the evolution of 2δ and R x are shown in Figs. 4(b) and 4(c). In Fig. 4(b), the mismatch angle 2δ gets to a value of approximately 1° far away from the interface which is similar to the value revealed in Fig. 2(d). This angle begins to reduce at position 16 and finally diminishes to nearly zero at the interface. The reduction of 2δ implies a transition layer of about 16 unit cells in thickness near the interface as depicted by the shadow area in Fig. 4(b). For the domain wall shear distortion in Fig. 4(c), R x obtains a value of −5° to −7° far away from the interface and gradually reduces to nearly zero from position 27 to position 30. Comparing with the unstrained 109° domain, the suppression of 2δ and R x near the interface reflects the strong pinning effect of the substrate constraint on the structural features of BiFeO3.
(a) An atomic-resolved HAADF-STEM image of a 109° domain near the BiFeO3/GdScO3 interface along [100]P. The scale bar is 1 nm. Polarization projection Ps is indicated by the colored arrow base on the Fe sublattice displacement illustrated by the superposed structural model. The location of the domain wall is marked with a vertical dotted line. The left inset is the intensity profile of Fig. 4(a) used to determine the location of the film/substrate interface (white dotted line). Note that the mismatch angle 2δ and domain wall shear distortion R x vary with the distance from the interface. (b–c) Variation of 2δ and R x across the BiFeO3/GdScO3 interface. Note that 2δ deviates from the bulk value and forms a transition layer near the interface.

D. Asymmetrical lattice distortions of 109° domains
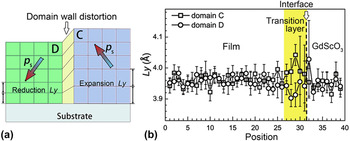
The lattice rotation of the domain wall, in fact, connects to a relative shift of the position of nearby domains, for example, the shift of domain B relative to domain A in Fig. 2(b). For the unstrained 109° domain, the shift can be as large as 0.5 Å. Reference Lubk, Rossell, Seidel, He, Yang, Chu, Ramesh, Hÿtch and Snoeck34 For the 109° domain near the interface in Fig. 4(a) where the lattice rotation of the domain wall is suppressed when approaching the interface, the corresponding shift of the nearby domains (domain C and domain D) must be compromised, as shown in Fig. 5(a). As a result, the asymmetry distortion of the lattice spacing L y would emerge. It is expected that the out-of-plane lattice spacing L y in domain D decreases, while L y in domain C increases. Such a kind of a situation is convinced in Fig. 5(b), the line profiles of L y corresponding to domain C and domain D in Fig. 4(a). The L y far away from the interface maintains a similar value with the unstrained one [Fig. 2(c)]. However, when approaching to the point about 5 unit cells away from the interface, L y increases to ∼4.1 Å in domain C and decreases to ∼3.9 Å in domain D. The abnormal expansion/reduction of L y then generates a transition layer of about 2 nm thick (four unit cells). This transition layer, with its thickness much thinner than that of transition layers for 2δ, is a typical feature of the suppression of the relative shifts in adjacent domains (the domain wall shear distortion) due to the substrate constraints.
(a) A schematic of the 109° domain wall distortion near the interface. (b) The line profile of L y of Fig. 4(a). Note the abnormal expansion/reduction of L y near the interface.

E. Structural features of 109° domains with large strain state
For the BiFeO3/GdScO3 system, the lateral lattice mismatch is rather small, thus the substrate constraints are mainly imposed from the out-of-plane direction. For heterointerfaces with large lateral lattice misfit where in-plane constraints must be taken into account, whether the above transition layers would still exist is needed to be further explored. The BiFeO3/PrScO3 system can provide a lateral mismatch as large as 1.5%. Before going to analyze substrate constraints under such condition, it is worthwhile to check whether the film still maintains the structural features of rhombohedral BiFeO3 since Zhu et al. reported that an orthogonal phase can be stabilized under large tensile strain by carefully controlling the boundary condition. Reference Yang, He, Suresha, Kuo, Peng, Haislmaier, Motyka, Sheng, Adamo, Lin, Hu, Chang, Tjeng, Arenholz, Podraza, Bernhagen, Uecker, Schlom, Gopalan, Chen, Chen, Ramesh and Chu13 For our thin film with about 50 nm in thickness, an apparent 109° stripe domain pattern can be observed, Reference Wang, Zhu, Tang, Xu, Liu, Li, Zhang, Wang and Ma25 which is a character of a rhombohedral-like structure. Similar domain patterns were also observed by Chen et al. Reference Chen, Qi, You, Yang, Huang, Wang, Sritharan and Chen32 Furthermore, the Fe sublattice displacements show out-of-plane components, as shown in Fig. 7(a), demonstrating that the BiFeO3 has an out-of-plane polarization component which reveals the characteristics of rhombohedral-like BiFeO3 rather than orthogonal one. Reference Yang, He, Suresha, Kuo, Peng, Haislmaier, Motyka, Sheng, Adamo, Lin, Hu, Chang, Tjeng, Arenholz, Podraza, Bernhagen, Uecker, Schlom, Gopalan, Chen, Chen, Ramesh and Chu13,Reference Chen, Qi, You, Yang, Huang, Wang, Sritharan and Chen32
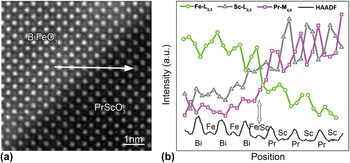
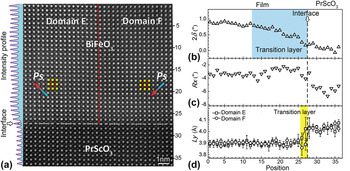
The interfacial element intermixing of the BiFeO3/PrScO3 thin film is determined using the EELS line profile which is obtained from the atomic plane marked by the arrow in Fig. 6(a). The element distribution information is shown in Fig. 6(b) where the vertical arrow marks the position of element intermixing. Obvious intermixing of Sc and Fe are resolved, which is also within one unit cell. Figure 7(a) is an atomic resolved HAADF-STEM image of the BiFeO3/PrScO3 thin film. The mismatch angle 2δ and domain wall shear distortion R x across the interface are then quantitatively analyzed. The variation of 2δ versus the unit cell position is shown in Fig. 7(b). 2δ is about 0.8–0.9° far away from the interface, and gradually reduces to nearly zero at the interface, similar to the tendency of the BiFeO3/GdScO3 system. A transition layer of about 6 nm (15 unit cells) is revealed. For the domain wall shear distortion R x in Fig. 7(c), the average value of R x away from the interface is around −3° to −4° and also shows a relative reduction near the interface. For lattice spacing L y in Fig. 7(d), it has an asymmetry distribution in about 2 unit cells near the interface where L y obtains a local expansion in domain E and a local reduction in domain F. Again, an interfacial layer with abnormal L y is also introduced. Although the BiFeO3/PrScO3 system has a large lateral misfit strain, the rhombohedral-like structural feature is preserved and interfacial transition layers are still kept. For the interfacial layer with abnormal out-of-plane lattice spacing, it is a typical feature of the suppression of the 109° domain wall distortion, and its existence then is expected to be a universal behavior in such 109° patterned rhombohedral-like BiFeO3 thin films resulting from substrate constraints.
(a) An atomic-resolved HAADF-STEM image of the BiFeO3/PrScO3 interface along [100]P. EELS line analysis is carried out in the atomic plane marked by the arrow. (b) A chemical line profile across the BiFeO3/PrScO3 interface. The vertical arrow denotes the position with element intermixing.

(a) An atomic-resolved HAADF-STEM image of a 109° domain near the BiFeO3/PrScO3 interface. The scale bar is 1 nm. Polarization projections Ps of domain E and F are indicated by arrows base on the Fe sublattice displacement illustrated by the superposed structural model. The location of domain wall is marked with a vertical dotted line. The left inset is the intensity profile of Fig. 7(a) used to determine the location of the film/substrate interface (horizontal dotted line). (b–d) Variations of the domain mismatch angle 2δ, domain wall shear feature R x , and vertical lattice spacing L y across the BiFeO3/PrScO3 interface.

IV. DISCUSSIONS
It is worthwhile to note that the rhombohedral distortion (2δ) and domain wall shear distortion (R x ) are all suppressed near interfaces in thin films with different lateral misfit strains (BiFeO3/GdScO3 and BiFeO3/PrScO3). The rhombohedral distortion, which features the interlattice angle of the rhombohedral unit cell (90 − δ), shows an inhomogeneous distribution with a suppression layer of several nanometers (about 6 nm) thick starting from the interface to the film. Beyond this thickness, the rhombohedral distortion keeps the same value as in the bulk form (about 1° for BiFeO3). For the shear feature R x of 109° domain walls, although it reduces at several unit cells thick area near the film/substrate interface, the relatively small suppression area implies that the interface pinning effect on R x decreases rapidly away from the interface. In addition, the tensile strain would reduce the total magnitude of R x (−5° to −7° for BiFeO3/GdScO3, −3° to −4° for BiFeO3/PrScO3). It is believed that the domain wall distortion would be further suppressed under large lateral tensile constraints, and the thickness of the interfacial layer (abnormal L y ) would further reduce (∼5 unit cells for BiFeO3/GdScO3, ∼2 unit cells for BiFeO3/PrScO3).Thus by choosing substrates with suitable lateral constraints, the manipulation on the thickness of the abnormal L y interfacial layer would be highly possible.
The local structural distortions near/at interfaces, i.e., the abnormal layer, are of importance for novel properties dominated by the interface, which are sensitive to the interplay of different order parameters at the interface. For BiFeO3 thin films, it has been demonstrated that many aspects connect to the abnormal L y , such as octahedral rotation, Reference Borisevich, Chang, Huijben, Oxley, Okamoto, Niranjan, Burton, Tsymbal, Chu, Yu, Ramesh, Kalinin and Pennycook36 concentration of oxygen vacancies, Reference Kim, Morozovska, Eliseev, Oxley, Mishra, Selbach, Grande, Pantelides, Kalinin and Borisevich37 and abnormal ferroelectric dipoles Reference Huang, Ding, Liang, Gao, Tang, He, Duan, Zhu, Chu, Fisher, Hirayama, Ikuhara and Chu38 near/at interfaces. Borisevich et al. reported that the accommodation of octahedral rotation the near BiFeO3/La0.7Sr0.3MnO3 interface can introduce an interface phase with novel magnetic properties and abnormal increase of out-of-plane lattice spacing L y . Reference Borisevich, Chang, Huijben, Oxley, Okamoto, Niranjan, Burton, Tsymbal, Chu, Yu, Ramesh, Kalinin and Pennycook36 Kim et al. explained that abnormal lattice expansion near the BiFeO3/La0.7Sr0.3MnO3 interface comes from the vacancy-induced local stabilization of the high c/a phase. Reference Kim, Morozovska, Eliseev, Oxley, Mishra, Selbach, Grande, Pantelides, Kalinin and Borisevich37 Although these structural features are quite complicated for the perovskite oxide system, it is of interest to note that the expanded or reduced out-of-plane lattice parameters near the interface are connected with the domain wall distortion in the present study. In other words, it is the nearby domain relationship that promises certain domain wall distortions and triggers the interfacial structural distortions. Thus, it is expected that by domain engineering, the novel structural feature can be manipulated at the local area near/at heterointerfaces for ferroic thin films, promising another approach seeking for interface dominated properties.
V. CONCLUSIONS
In this paper, we demonstrate at the atomic level the structural distortions in two kinds of 109° domain patterned BiFeO3 thin films with different tensile strain states. Structural features including the mismatch angle (2δ) and domain wall shear distortion (R x ) are quantitatively analyzed which are found to be suppressed near the interfaces due to the substrate constraints. An additional interfacial layer with expanded and reduced out-of-plane lattice spacing is resolved. These interfacial structural distortions are a typical character of the interplay of intrinsic spontaneous structural distortions with external substrate constraints, which implies a potential mediation of interfacial structures by domain engineering in ferroic thin films.
ACKNOWLEDGMENTS
This work is supported by the National Natural Science Foundation of China (Nos. 51231007, 51571197, 51501194, 51671194, and 51521091), National Basic Research Program of China (2014CB921002), and the Key Research Program of Frontier Sciences, CAS (QYZDJ-SSW-JSC010). Y.L.T. acknowledges the IMR SYNL-T.S. Kê Research Fellowship and the Youth Innovation Promotion Association CAS (No. 2016177).