INTRODUCTION
Electronically collected routine care data are increasingly employed to meet growing demands for reliable and timely information on healthcare-associated infection (HAI) rates.Reference Freeman, Moore, Garcia, Charlett and Holmes1–Reference Trick3 For several decades, surveillance of and feedback regarding HAI rates, for example within national networks, have been fundamental components of infection prevention programs.Reference Tokars, Richards and Andrus4–Reference Geubbels, Nagelkerke, Mintjes-De Groot, Vandenbroucke-Grauls, Grobbee and De Boer7 Traditionally, surveillance is performed by infection preventionists who manually review patient charts for the occurrence of targeted HAIs. This approach, however, is known to be labor intensive, effort dependent, and vulnerable to subjective interpretation.Reference Lin, Hota and Khan8–Reference Klompas11 Expansion of surveillance volume requirements and public reporting of HAI rates has stimulated the use of (semi)automated systems that combine various sources of data captured in electronic health records (EHRs) to support or replace manual surveillance.Reference Woeltje12, Reference Klompas and Yokoe13
Most of these automated surveillance systems aim to classify patients by their likelihood of having developed the targeted HAI and thereby restrict manual chart review to high-risk patients.Reference van Mourik, Troelstra, van Solinge, Moons and Bonten2, Reference Woeltje12 Data stored in EHRs can be harnessed in several ways to achieve this stratification. Using drain-related meningitis (DRM) as a prototype infection, a system based on a multivariable regression model was recently developed that demonstrated a favorable balance between sensitivity of DRM detection and workload reduction.Reference van Mourik, Troelstra, van Solinge, Moons and Bonten2, Reference van Mourik, Moons and van Solinge14
Drain-related meningitis, or ventriculitis or ventriculostomy-related infection, is an infection of the meninges and/or ventricles complicating the use of external cerebrospinal fluid (CSF) drains, in particular ventricular (EVD) and lumbar (ELD) drains.Reference Lozier, Sciacca, Romagnoli and Connolly15–Reference Leverstein-Van Hall, Hopmans and Van Der Sprenkel18 These drains are placed to manage increased intracranial pressure, for example, due to intracerebral hemorrhage or trauma, prophylactically during surgery, or as treatment for cerebrospinal fluid leakage. DRM has been described to occur in up to 22% of drainage episodes.Reference Lozier, Sciacca, Romagnoli and Connolly15–Reference Lyke, Obasanjo, Williams, O'Brien, Chotani and Perl17 Surveillance of DRM is complicated by a case definition that is not straightforward and does not require a positive microbiological culture for diagnosisReference Leverstein-Van Hall, Hopmans and Van Der Sprenkel18, Reference Horan, Andrus and Dudeck19; in addition, heterogeneous underlying disease and sometimes extensive comorbidities in this patient population hinder unequivocal application of diagnostic criteria.
The previously developed automated surveillance system based on multivariable regression modeling could accurately detect patients who developed DRM as a consequence of external CSF drainage.Reference van Mourik, Moons and van Solinge14 Prediction models require validation in both time and place to establish their transportability to other settings and in this study, we present a prospective and external validation of the multivariable automated surveillance approach to DRM in comparison to traditional manual methods.Reference Altman, Vergouwe, Royston and Moons20, Reference Justice, Covinsky and Berlin21 In addition, we used this approach to validate the merits of the multivariable approach in relation to an alternative automated surveillance strategy based on a classification algorithm and to evaluate whether differences in performance can be linked to hospital or patient characteristics.
METHODS
Study Design
In this multicenter prospective cohort study, we compared 2 methods of automated surveillance to traditional, manual chart review (reference standard). All methods of surveillance were implemented independently of each other. Importantly, all surveillance approaches aim to identify those patients that have developed DRM at some time during their course of admission, and explicitly do not prospectively predict the onset of DRM. The institutional review boards of the participating hospitals reviewed the study protocol and waived the requirement for informed consent.
Study Population: Hospitals and Participants
All Dutch hospitals performing neurosurgical procedures were invited to participate in this study (n=16). In addition to the University Medical Center Utrecht, a 1042-bed academic medical center where initial development of the model took place, 2 large non-academic teaching hospitals volunteered: St. Elisabeth Hospital in Tilburg (543 beds) and Medisch Centrum Haaglanden in The Hague (673 beds). Data were collected between January 1, 2012, and December 31, 2012, in the first 2 hospitals and between April 15, 2012, and April 30, 2013, in the latter. Hospitals were randomly assigned the letters A, B, and C; the model was initially developed in hospital C.
All patients receiving 1 or more EVDs or ELDs were eligible for inclusion and were identified by either routine infection control practices (hospitals B and C) or by a specifically developed electronic inclusion form filled in by neurosurgery and intensive care staff (hospital A). As in model development, children (ie, below the age of 18), patients with pre-existing meningitis or who died or were discharged within 24 hours of drain placement, and patients transferred from elsewhere with a drain in situ were excluded.
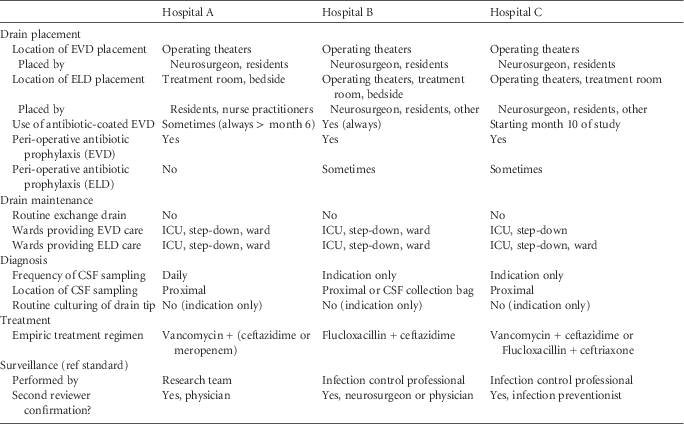
At the beginning of the study, infection control staff and treating physicians from each hospital completed a questionnaire on clinical practices regarding drain placement and maintenance, diagnosis and treatment of (suspected) drain-related meningitis, and methods of DRM surveillance (Table 1).
Characteristics of Drain Placement, Diagnosis, Treatment, and Surveillance of Drain-Related Meningitis (DRM) by Hospital

Note. DRM, drain-related meningitis; CSF, cerebrospinal fluid; ELD, external lumbar drain; EVD, external ventricular drain; ICU, intensive care unit.
Outcome: Drain-Related Meningitis
DRM was diagnosed by manual chart review using the adapted definition for healthcare-associated meningitis from the Centers for Disease Control’s National Healthcare Safety Network.Reference van Mourik, Moons and van Solinge14, Reference Leverstein-Van Hall, Hopmans and Van Der Sprenkel18, Reference Horan, Andrus and Dudeck19 In short, patients must either have microbiological growth from CSF cultures or a combination of clinical signs and anomalities in CSF consistent with meningitis and administration of antibiotic therapy directed at DRM. Importantly, cultures with common skin contaminants in the absence of clinical signs reflective of meningitis are not considered cases of DRM, and infections must occur within 7 days of drain removal to be attributed to the EVD or ELD.
In hospitals B and C, the definition was applied by infection control professionals using traditional manual surveillance with confirmation by a neurosurgeon or a second infection control professional. In hospital A, the initial chart review was applied by an infection control researcher, and possible cases were discussed with a physician for final adjudication (Table 1). To improve the consistency and quality of surveillance, all members of the research team performing manual chart review attended a training session reviewing DRM definitions, data collection methods, and possible pitfalls prior to study initiation.
Electronic Data Collection and Surveillance Systems
Data required by the automated surveillance systems were extracted from electronic microbiology, pharmacy, and clinical chemistry databases, using existing clinical data warehouses wherever possible.Reference ten Berg, Huisman, van den Bemt, Schobben, Egberts and van Solinge22 Device utilization and drain characteristics were derived from traditional surveillance results. As in previous studies, a surveillance window was defined for each patient as the day of first drain placement until 7 days after removal of the last drain or discharge, and the value most reflective of (possible) DRM observed during this window was used in the surveillance systems (eg, highest CSF leukocyte count). If a specified laboratory test was not performed throughout the surveillance window, it was classified as missing. Data were handled and processed exactly as in model development. Importantly, only measurements performed during routine patient care were included, and no changes to existing diagnostic or therapeutic protocols were made for the purpose of this study.
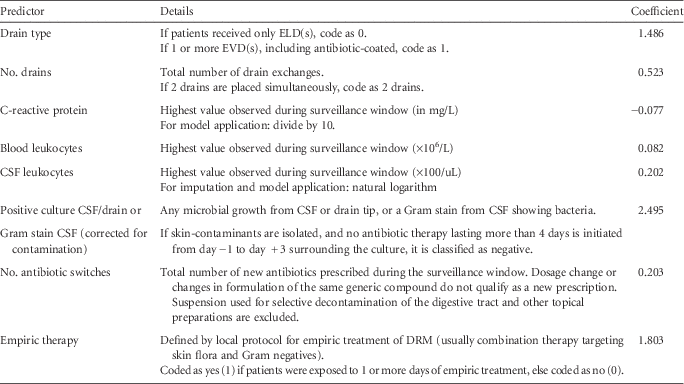
The automated surveillance system based on the multivariable regression model has previously been described and is summarized in the appendix (Appendix Fig. 1, Appendix Table 1).Reference van Mourik, Moons and van Solinge14, Reference van Mourik, Groenwold, Berkelbach van der Sprenkel, van Solinge, Troelstra and Bonten23 In brief, the multivariable logistic regression model uses data on microbiological culture results, antibiotic dispensing, and clinical chemistry results combined with drain characteristics to estimate a predicted probability of DRM for each patient. Missing values are handled by multiple imputation.Reference Donders, van der Heijden, Stijnen and Moons24, Reference Sterne, White and Carlin25 The regression model returns predicted probabilities of DRM (P(DRM)) that can subsequently be used to stratify patients as high or low risk of DRM based on a pre-specified threshold or to estimate the total number of infections without the requirement for manual review.Reference van Mourik, Moons and van Solinge14
An alternative, less complicated, automated surveillance strategy based on a classification algorithm was also implemented. In such a system, patients are flagged as high or low risk simply based on the presence or absence of indicators of infection (positive culture, antibiotic exposure) instead of incorporating them in a weighted, multivariable regression formula.Reference van Mourik, Troelstra, van Solinge, Moons and Bonten2 Missing observations are classified as negative in this approach.
Analyses
After data linkage and verification of integrity, descriptive statistics were generated. Readmissions more than 30 days after discharge were considered independent drainage episodes. As with model development, missing data patterns were assessed (data not shown), and multiple imputation was performed, stratified by hospital. The multivariable regression formula was applied to each imputed dataset and the predicted probabilities were averaged (Table S1).Reference van Mourik, Moons and van Solinge14 The area under the ROC curve was used to assess model discrimination and sensitivity, specificity, predictive values, and workload reduction were calculated for a range of predicted probability thresholds, including a previously specified threshold (P(DRM)=0.15).Reference van Mourik, Troelstra, van Solinge, Moons and Bonten2 Calibration plots were examined, and the overall number of infections within a specific group of patients was estimated without any manual review by summing all the predicted probabilities within that group (calibration-in-the-large).Reference Steyerberg26 In addition, the incremental benefit of the multivariable regression approach compared with the less complicated classification algorithm was investigated for its ability to detect DRM cases identified by traditional manual surveillance by examining sensitivity, positive predictive value, and workload reduction. All analyses were performed using SPSS Statistics 20 (IBM, Armonk, NY) and R version 3.0.1 (www.r-project.org).
RESULTS
During the study period, 419 patient admissions with 1 or more external ventricular and/or lumbar drains were recorded. Of these, 12 patients were children, 19 died within 24 hours of drain placement, 18 had pre-existing meningitis, and 4 were transferred with a drain in situ, leaving 366 drainage episodes in 354 unique patients eligible for analysis.
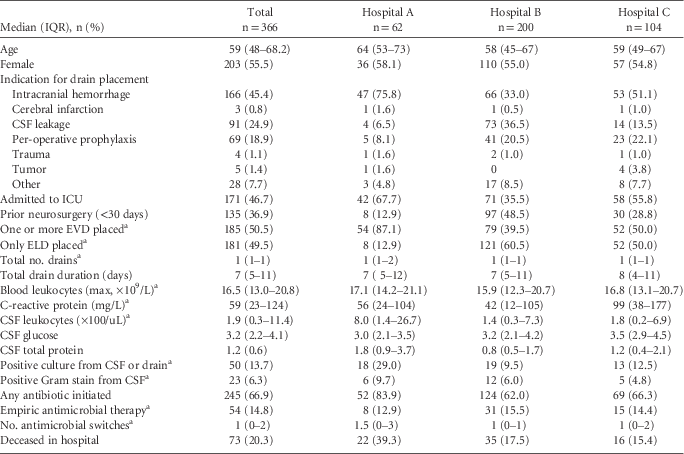
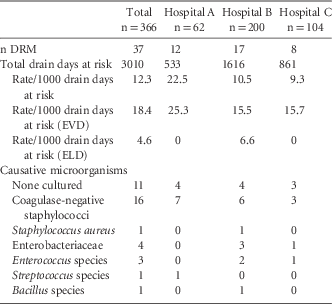
Electronic collection of data from EHRs was feasible for all predictors with the exception of antibiotic use in 1 hospital, where extraction required manual data handling. Clinical data warehouses in hospitals A and C greatly facilitated data extraction. Table 2 shows patient characteristics by hospital as well as the distribution of the predictors included in the model. Indication for drain placement varied between hospitals; three-quarters of drains were placed to treat hydrocephalus after intracranial hemorrhage in hospital A, whereas in hospital B drains were often placed per-operatively or as treatment for CSF leakage. Approximately half of drainage episodes included 1 or more EVDs, and 181 only had ELDs (12.9% in hospital A, 60.5% in hospital B and 50% in hospital C). In just greater than half of drainage episodes, values were missing for 1 or more of the laboratory predictors used by the model, although this varied considerably between hospitals. Hospital A performed daily CSF sampling, hence the lower rates of missing observations. The overall rate of DRM was 12.3/1000 drain days at risk (4.6 for ELD and 18.4 for EVD), varying from 9.3 to 22.5 between hospitals (Table 3). In 11 of 37 DRM cases (29.7%), no causative microorganism was isolated.
Population Characteristics by Hospital
Note. CSF, cerebrospinal fluid; ELD, external lumbar drain; EVD, external ventricular drain; ICU, intensive care unit; IQR, interquartile range.
Antibiotics do not include per-operative prophylaxis. For laboratory values, the value most indicative of meningitis measured throughout the drainage episode is presented. There were no missing data except blood leukocytes (15.6%), C-reactive protein (23.0%), CSF leukocytes glucose and protein (45.3%), CSF or drain culture (43.4%), Gram stain (45.6%). Data are presented prior to multiple imputation. Values were available for all predictors in 46.4% of cases (83.3%, 37.0%, and 43.3% for hospitals A, B, and C, respectively).
a In the regression model.
Rates of Drain-Related Meningitis (DRM), Stratified by Hospital
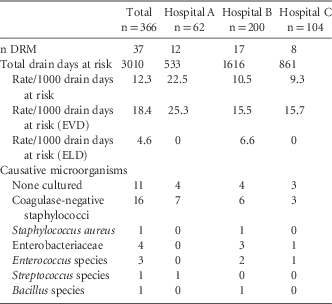
Note. DRM, drain-related meningitis; ELD, external lumbar drain; EVD, external ventricular drain.
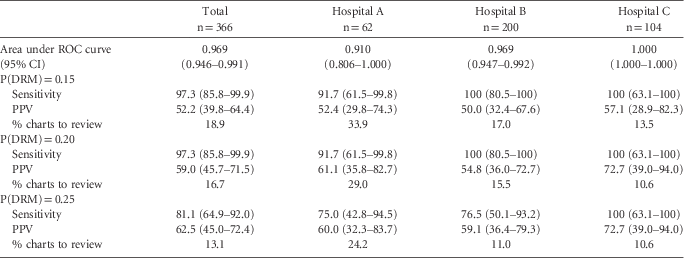
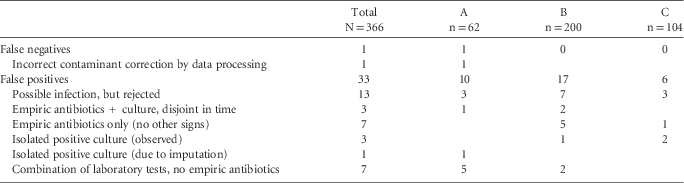
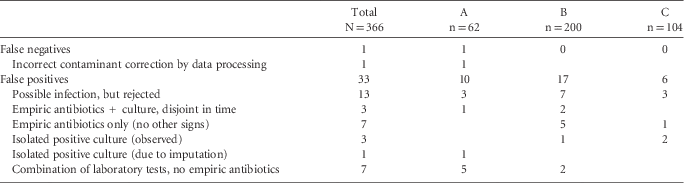
The overall area under the ROC curve after application of the regression model was 0.969 (95% confidence interval 0.946–0.991); ranging from 0.910 to 1.00 by hospital (Table 4). Applying a cutoff of 0.15 to the predicted probabilities resulted in 97.3% sensitivity for DRM, 52.2% positive predictive value, and an 81% reduction in the number of charts that required manual review. Using higher thresholds, for example 0.20 or 0.25, has higher efficiency, albeit at the cost of lower sensitivity for the latter. As an exploratory analysis, reasons for misclassification of DRM were investigated (Appendix Table 2). Interestingly, in hospital A, 5 of 10 false positives were identified based on clinical chemistry results alone. Figure 1 depicts observed and predicted rates of DRM when the model is applied without any manual review of charts. Examination of calibration plots showed adequate overall calibration, although stratification by hospital showed some miscalibration (Appendix Fig. 2).
Observed versus predicted rates of drain-related meningitis (DRM), stratified by hospital and drain type. The predicted number of meningitis cases is derived by summing the predicted probabilities derived from the model within each group, without applying manual chart review. Gray bars represent 95% confidence intervals for the observed rates.
Performance Characteristics of the Multivariable Model, Stratified by Hospital, with 95% Confidence Intervals
Note. CI, confidence interval; P(DRM), predicted probability of drain-related meningitis; PPV, positive predictive value; ROC, receiver operating characteristics. In model development, the P(DRM)=0.15 cutoff resulted in 98.1% sensitivity, 87.6% specificity, and PPV of 52.5% with 26% of charts requiring manual review. Confidence intervals were calculated using the exact binomial method.
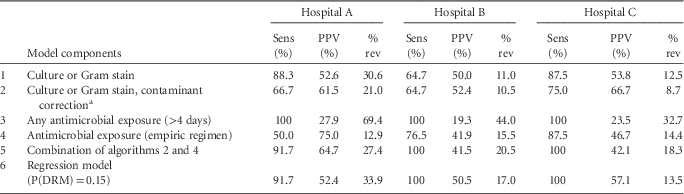
Table 5 compares the performance of the multivariable regression approach to the alternative, less complex, automated classification algorithm with respect to sensitivity and efficiency of surveillance. For example, when all patients with some evidence of microbiological infection of the CSF or drain underwent manual chart review, sensitivity of DRM detection ranged from 64% to 88% by hospital, with 11%–31% of charts requiring manual review (option 1). When data on antibiotic exposure were used to correct for possible contamination with skin flora, sensitivity decreased but efficiency increased (option 2). The most optimal combination of contaminant-corrected culture results with data on empiric antibiotic therapy (option 5) resulted in 97.3% sensitivity, 46.8% positive predictive value, and 21% of charts requiring review for all hospitals combined. In 2 of the 3 hospitals, the multivariable regression model with the pre-specified threshold achieved higher efficiency at similar sensitivity than the classification algorithm (hospitals B and C).
Performance of Classification Algorithms
Note. PPV, positive predictive value; P(DRM), predicted probability of drain-related meningitis; Sens, sensitivity % rev, percentage of charts requiring manual review. Patients are classified as high or low risk based on the simple presence or absence of makers of infection (instead of application of a regression model). Performance of the regression model is also presented for comparison. Missing observations are classified as negative in the classification algorithms.
a Contaminant correction is as in the multivariable regression model (see Table S2).
DISCUSSION
The results of this study demonstrate the external validity, both temporal and geographical, of a previously developed automated surveillance system for DRM based on a multivariable regression model using routine care data extracted from EHRs. In comparison to a more straightforward classification algorithm, the regression model reached a more favorable sensitivity-to-efficiency balance in 2 of 3 hospitals. Despite important differences between hospitals with respect to underlying patient characteristics, diagnostic practices, and treatment protocols, the regression model accurately and efficiently identified those patients requiring manual chart review with near-perfect sensitivity and achieved an average workload reduction greater than 80%. Furthermore, the estimation of overall DRM rates without the need for any manual chart review was fairly accurate. All cases of DRM in which no causative microorganism was isolated were identified.
The (semi)automated multivariable regression approach to surveillance for DRM had very similar performance characteristics to those observed during model development,Reference van Mourik, Moons and van Solinge14 thus providing evidence for its generalizability to other settings and supporting the notion that the use of multivariable regression models may be of incremental value in automated surveillance of HAI.Reference van Mourik, Troelstra, van Solinge, Moons and Bonten2 Additional benefits of regression models compared to classification algorithms are the flexibility of adapting thresholds to specific situations and the possibility to directly estimate group-level infection rates by summing the predicted probabilities. Importantly, application of classification algorithms requires similar data extraction and processing as regression models. Previous research has demonstrated important differences among hospitals in methods of HAI surveillance and application of definitions.Reference Klompas11, Reference Keller, Linkin, Fishman and Lautenbach27, Reference Dixon-Woods, Leslie, Bion and Tarrant28 Implementation of automated surveillance and, hence, consistent identification of high-risk cases may in the future contribute to more standardized HAI surveillance.Reference Lin, Hota and Khan8
Extraction from EHRs was possible for nearly all predictors, although some effort had to be made to standardize data prior to model application and care was taken to ensure the comparability of electronic data sources across hospitals. Further expansion of clinical data warehouses, standardized documentation, and electronic data capture are expected to facilitate model implementation in practice.Reference Trick29 Automated surveillance systems may then be incorporated in the routine process of HAI surveillance by periodically identifying high-risk patients requiring manual chart review. In the present study, the surveillance system was not incorporated within the EHR system itself, but data were extracted to external statistical software for analysis. Importantly, data pertaining to device use were collected by manual surveillance, as none of the hospitals currently have structured documentation of EVD and ELD usage in a format amenable to electronic data extraction. Analogous with other device-associated infections, these concerns will need to be addressed to achieve maximal benefits of automated surveillance.Reference Tejedor, Garrett and Jacob30, Reference Wright, Fisher, John, Reynolds, Peterson and Robicsek31
As in model development, the use of routine care data was associated with missing predictor values; a larger fraction of patients had missing values in hospitals B and C. Multiple imputation was a feasible method of handling these missing observations in this context, and future work will need to identify the optimal method of applying the model in practice.Reference Janssen, Vergouwe and Donders32 Interestingly, as a result of daily CSF sampling in hospital A, 83.3% of patients had no missing predictor information but model efficiency was lower compared to the other hospitals. This may in part be explained by the higher number of true infections and the increased likelihood of outlying measurements, especially because a relatively large fraction of patients incorrectly flagged as high risk were due to (incidental) anomalities in laboratory values.
In this study, both regular and antibiotic-impregnated EVDs were in use, although no distinction was made between these in model application. Sensitivity analyses showed very similar incidences of DRM for these drain types and no difference in performance (data not shown). In this study, we aimed to evaluate absolute rates of DRM, and differences in DRM rates observed between the 3 centers may be explained by (a combination of) variations in underlying risk, indications for drain placement, types of drains placed, and clinical and diagnostic practices.
This study has several inherent limitations. As with many studies on methods of HAI surveillance, ascertainment of infection status is not straightforward.Reference Lin and Bonten33 Not only are many different definitions for DRM currently in use,Reference Lozier, Sciacca, Romagnoli and Connolly15, Reference Horan, Andrus and Dudeck19 the complex nature of the definition makes it vulnerable to error and subjective interpretation. We aimed to minimize this possible source of variability by providing all study personnel with a training session using prepared case vignettes. Notwithstanding these concerns, however, the purpose of the automated surveillance systems presented in this study is to increase efficiency of surveillance beyond what is currently available and, in the absence of a perfect reference standard, we have used the best available option. Furthermore, this study did not include post-discharge surveillance, although patients readmitted within 1 week of previous discharge were linked with the prior episode. In contrast to HAI that require a longer follow-up, the consequences are expected to be minimal for DRM: meningitis should, by definition, occur within 7 days of device removal. In addition, most DRM patients will be readmitted to the original hospital in case of worsening clinical status.
Future work needs to address concerns with electronic data collection for both device use and predictors of DRM, to ensure ongoing validation of performance (as with any method of surveillance) and to assess whether (semi)automated methods are truly more reliable than manual approaches. Moreover, depending on the desired application of the automated surveillance approach, hospital-specific customization may be considered to maximally support within hospital surveillance efforts, though perhaps at the cost of losing comparability across institutions. Recent developments in fuzzy logic and machine learning may also contribute to more detailed automated identification of HAI.Reference De Bruin, Blacky, Koller and Adlassnig34
Automated surveillance systems for DRM could accurately and efficiently identify patients at high risk of having developed DRM. The multivariable regression approach had a higher efficiency than conventional automated classification algorithms in 2 of 3 hospitals, and implementation decreased the burden for manual review by greater than 80% at almost perfect sensitivity. This approach may be of incremental value when developing (semi)automated systems for HAI surveillance. Future work is required to enable electronic data collection on device use and to provide ongoing validation of automated surveillance approaches.
Acknowledgments
We would like to acknowledge the following colleagues for their invaluable contributions in collecting the data: F. Bruna, E. N. Koster-den Dulk, E. Kelleter-Grasma, A. Kleijweg, Y. Groenleer, H.E.M. Blok, S.M. van Dijk, L. Stijvers.
Financial support. This work was supported by an Alexander Suermann stipend provided by the UMC Utrecht [MvM]. Development of electronic data extraction tools in Medisch Centrum Haaglanden was made possible by a grant from the MCH Research Fund.
Conflict of interest. All authors report no conflict of interest relevant to this article.
APPENDIX
Data-processing flow chart for the multivariable regression approach. Note. DRM, drain related meningitis; ELD, external lumbar drain; EVD, external ventricular drain. Variables in multiple imputation model in addition to the predictors in the multivariable model and outcome were the following: age, sex, indication for drainage, ICU admission status, total drain duration, hemoglobin levels, platelet count, neutrophil count (blood), Ln(CSF erythrocytes), glucose (CSF), protein (CSF), total number of antibiotic and corticosteroid prescriptions, antibiotic exposure data (total number, percentage of days exposed, any exposure to regimens >?4?days, average duration of antibiotic regimens, number of days exposed to empiric antimicrobial therapy, any exposure to flucloxacillin, ceftazidime, vancomycine, meropenem, ceftriaxone), any corticosteroid exposure, percentage of days exposed to corticosteroids, and total number of days exposed to corticosteroids.
Predictor Specifications and Model Parameters Applied
Reasons for Discrepancy at the P(DRM) = 0.15 Threshold, Stratified by Hospital
Calibration plots for the multivariable prediction model for all hospitals combined and stratified by hospital.