The consumption of unexplored food components like cereals, pseudo-cereals, and pulses, is gaining attention, particularly among health-conscious customers. It has been observed that people are looking for convenient and innovative ways to improve their diets. New food products that are “ready-to-eat” and particularly beneficial to health are emerging fast to meet this demand. These new food products are relatively more nutritious than traditional foods and provide customers with “ready-to-eat” options that suit their busy schedules and cater to their daily intake of adequate essential nutrients (Chaturvedi et al., Reference Chaturvedi, Khartad and Chakraborty2021).
Millets belonging to the Poaceae family are a type of grass that is grown for its economic production of edible grain. It has emerged as a staple food in many parts of the world and is known for its relatively high nutritional value. In general, millets belong to the group of nutri-cereals commonly referred to as super-foods, particularly rich in protein, fiber, vitamins, and mineral sources (Soumya et al., Reference Soumya, Yadav and Vijay2023). Millets are considered a versatile and nutritious food that can be enjoyed in many ways. Owing to these nutritional qualities, millets have been used to make several food products like beverages, breads, pasta, cookies, and sweets (Tomar et al., Reference Tomar, Bhardwaj, Verma, Singh, Krishnan, Kansal, Yadav, Praveen and Sachdev2022). The present investigation focused on browntop millet, (also known as “Korale”), which is primarily cultivated in India. It has small, round grains with a nutty flavour and a slightly chewy texture. The key nutrients available in 100 gm of browntop Millet are 11.5 gm of protein, 12.5 gm of fibre, and 4.2 gm of minerals. It was reported that browntop millet features the presence of several attributes, e.g., fibre content, starch, and oligosaccharides in the concentrations that are behind their prebiotic properties. As a result, there is a growing interest in the usage of browntop millet in commercial or functional foods primarily due to its excellent dietary attributes (Sunagar and Sreerama, Reference Sunagar and Sreerama2023).
In general, prebiotics are “selectively fermented foods which allow specific changes in composition and/or activity in the GI microflora that confer benefits upon host well-being and health” and impart the benefits for mental health, metabolic and bone health (Roberfroid, Reference Roberfroid2007; Machado et al., Reference Machado, Ferreira, Oliveira and Alves2023).
However, it has also been indicated that millet contains several anti-nutrients e.g., tannins and phytic acid which reduce the bioavailability of minerals. Therefore, there is a need to appropriately address conversion of these anti-nutrients by different processing techniques e.g., soaking, germination & fermentation (Saxena et al., Reference Saxena, Vasudevan, Saini and Sasmal2023). These processing techniques facilitate the contribution towards value-addition by probiotic microorganisms.
Probiotics may be defined as “live microorganisms which, when administered in adequate amounts, confer a health benefit on the host”. The most commonly used probiotics are Bifidobacterium and Lactobacillus species (Gibson et al., Reference Gibson, Hutkins, Sanders, Prescott, Reimer, Salminen, Scott, Stanton, Swanson, Cani and Verbeke2017). Consumption of probiotic drinks is linked to a variety of health benefits. Lactobacillus has been demonstrated to prevent E.coli, Klebsiella pneumoniae, and Pseudomonas aeruginosa adhesion to uroepithelial cells and intestinal epithelial cells. The inhibition by Lactobacillus may create a hindrance and upregulate intestinal mucins, which are high-molecular-weight glycoproteins produced by epithelial cells, resulting in protective barrier formation. Furthermore, Lactobacillius enhance the gut mucosal barrier by maintaining epithelial cell tight junctions and decreasing intestinal permeability (Williams, Reference Williams2010). Immunomodulation is another potential mechanism of action for probiotics. Probiotics, including Lactobacillius, boost immunoglobulin A (IgA) and enhance mononuclear cell cytokine production. It was reported that administering Lactobacillus rhamnosus to children with acute rotaviral diarrhoea led to the boosting of immunoglobulin, including IgA, IgG, and IgM, thereby resulting in a shorter duration of gastroenteritis symptoms (Kaila et al., Reference Kaila, Isolauri, Soppi, Virtanen, Laine and Arvilommi1992).
Synbiotic beverages are a combination of prebiotics and probiotics that work together to have a synergistic effect on the human digestive system (Kumar et al., Reference Kumar, Kaur and Tomer2020). The synbiotic beverage contains live bacteria, which can secrete metabolites such as hydrogen peroxide, bacteriocins, organic acids, and short-chain fatty acids (SCFA); their presence can help to restore the microbiota balance in the human gut and create an inappropriate environment for infections (Wang, Reference Wang2019). Probiotics can help improve the absorption of certain nutrients, such as vitamins and minerals, by enhancing gut health. This may particularly benefit individuals with nutrient deficiencies or compromised gut function. By combining probiotics and prebiotics, synbiotic beverages have the potential to optimize nutrient absorption and support overall nutritional status. Synbiotic beverages offer a convenient and easy way to incorporate probiotics and prebiotics into one's diet. The growing interest in gut health and the increasing demand for functional foods and beverages have contributed to the rapid growth of the synbiotic beverage market. As more consumers become aware of the potential health benefits associated with synbiotics, the market is expected to expand further, leading to increased product innovation and variety.The abovementioned factors and developing new and innovative synbiotic beverage products will drive the market's growth. Different combinations can yield additional benefits, Food items consumed by humans can be viewed as a significant factor that regulates microbial colonisation in the gastrointestinal tract. Food particles assist in buffering the microbes through the stomach and might contain ingredients associated with probiotics to modify their functionality. Synbiotic beverages can be further classified concerning the specific probiotic strains and prebiotic fibers used during manufacturing (Davani-Davari et al., Reference Davani-Davari, Negahdaripour, Karimzadeh, Seifan, Mohkam, Masoumi, Berenjian and Ghasemi2019; Madhu et al., Reference Madhu, Amrutha and Prapulla2012).
This study aimed to prepare a synbiotic beverage and assess the viability of probiotic microorganisms in the produced beverage. The proposed beverage contains browntop millets, skimmed milk and probiotics . This falls under the functional food category because of its main dairy component, skimmed milk, and the addition of L. rhamnosus, a good probiotic. These components act in synergy, improving the nutritional and health benefits of the drink, a functional dairy product.
The present study intends to analyze and optimize the fermentation conditions to improve the nutritious characteristics of browntop millet-based beverages. This study applied response surface methodology to optimize the fermentation process for the production of millet beverages. Multiple variables are simultaneously manipulated in a statistically designed experiment process. Response surface methodology (RSM) can approximate quadratic expressions of the outcomes in a designed reaction condition. The study further extends to characterize the anti-nutrient content, total flavonoid and phenolic compound and ash content, FTIR, etc, of the final product obtained after using optimized conditions.
Material and methods
The unpolished browntop millet (Urochloa ramosa) was procured from the local market in Delhi. The millet grains were cleaned using potable water, dried, and stored in an airtight container for further use. The skimmed milk powder was purchased from ‘Govind’ dairy Maharashtra, India. Probiotic culture L. rhamnosus MTCC 1408 (Lacticaseibacillus rhamnosus) was obtained from the Institute of Microbial Technology, Chandigarh. The chemicals and reagents were purchased from Sigma-Aldrich, Hi-media, and SRL.
Revival of bacterial culture
Freeze-dried bacterial cultures were transferred into 5 ml MRS broth tubes using sterile forceps under a laminar flow hood. The inoculated tubes were incubated at 37°C for 48 h. The activated culture was further used for inoculation.
Analysis of probiotic potential
Determination of haemolytic activity
The haemolytic activity of L. rhamnosus was determined as indicated in (Yu et al., Reference Yu, Jang, Lee and Paik2019) methodology with minor modifications. Streaking of L. rhamnosus was done on blood agar (5% blood in 100 ml medium) plates and incubated at 37°C for 24 h to examine the haemolytic activity.
In-vitro resistance of L. rhamnosus in simulated gastrontestinal conditions
The study of acid tolerance of L. rhamnosus was conducted using the method described by (Huang and Adams, Reference Huang and Adams2004) with minor modifications. The cells of L. rhamnosus were grown overnight in MRS broth. The cell suspension was centrifuged at 5000 rpm for 15 min at 4°C, then washed using pH 6.5–7.4 PBS. The pellets were re-suspended in PBS with 2, 3, and 4 pH. To detect the acid (pH) tolerance, the samples of different pH were transferred on MRS agar using the spread plate method and incubated at 37°C for 24–48 h.
Study of cell-auto aggregation and hydrophobicity
The hydrophobicity of L. rhamnosus strain was determined using (Krausova et al., Reference Krausova, Hyrslova and Hynstova2019) with minor modifications. The L. rhamnosus suspension grows overnight in MRS broth, centrifuged at 5000 rpm for 15 min at 4°C. Chloroform was added to the cell suspension to test hydrophobicity. the entire solution was kept for one hour at 37°C, and the absorbance of the aqueous layer was measured at 600 nm. The cell suspension was incubated at 37°C without disturbance for cell-auto aggregation. The cell-auto aggregation absorbance was measured at 3, 5 h. Cell auto aggregation and cell hydrophobicity were measured using Eq 1.
 \begin{equation}{\text{Cell Hydrophobicity/auto aggregation}} = \frac{{Ab{s_I} - Ab{s_F}}}{{Ab{s_I}}}\ {\textrm \times}\ 100\end{equation}
Where,
AbsI = Initial Absorbance at 600 nm
AbsF = Final Absorbance at 600 nm
Analysis of prebiotic activity
The prebiotic activity of browntop millet was determined as reported by (Chaturvedi and Chakraborty, Reference Chaturvedi and Chakraborty2022a). The probiotic activity was measured by enumerating the probiotic and enteric cell count in the absence and presence of the prebiotic. The bacterial cell count was determined using the spread plate method in MRS agar (de Mann Rogosa and Sharpe) and Luria-Bertani. The total cell count was expressed in log CFU/ml. The prebiotic activity score by L. rhamnosus against E. coli was determined using Eq. 2.
 \begin{equation}\left[ {\frac{A}{{\text{B}}} - \frac{C}{{\text{D}}}} \right]\end{equation}
Where,
 \begin{align*}\quad A &= \left( {{\text{Probiotic}}\left\langle {\log CFUm{l^{ - 1}}} \right\rangle {\text{on the prebiotic at 24 h}}} \right) \\
&\quad - \left( {{\text{Probiotic}}\left\langle {\log CFUm{l^{ - 1}}} \right\rangle {\text{ on the prebiotic at 0 h}}} \right)\end{align*}
 \begin{align*}\quad B &= \left( {{\text{Probiotic}}\left\langle {\log CFUm{l^{ - 1}}} \right\rangle {\text{on the Glucose at 24 h}}} \right)\\
&\quad - \left( {{\text{Probiotic}}\left\langle {\log CFUm{l^{ - 1}}} \right\rangle {\text{ on the Glucose at 0 h}}} \right)\end{align*}
 \begin{align*}C &= \left( {{\text{Enteric}}\left\langle {\log CFUm{l^{ - 1}}} \right\rangle {\text{on the prebiotic at 24 h}}} \right) \\
&\quad - \left( {{\text{Enteric}}\left\langle {\log CFUm{l^{ - 1}}} \right\rangle {\text{ on the prebiotic at 0 h}}} \right)\end{align*}
 \begin{align*}D &= \left( {{\text{Enteric}}\left\langle {\log CFUm{l^{ - 1}}} \right\rangle {\text{on the Glucose at 24 h}}} \right)\\
&\quad - \left( {{\text{Enteric}}\left\langle {\log CFUm{l^{ - 1}}} \right\rangle {\text{ on the Glucose at 0 h}}} \right)\end{align*}
Preparation of fermented synbiotic beverage
Fermentation was conducted in 500 ml flasks to prepare the desired synbiotic beverage. The cleaned millet grains were soaked overnight using distilled water in a ratio of 1:2 at 25°C temperature. Soaked millets (4.5 g) in different ratios were then steam-cooked in an autoclave (15 min at 121°C). After cooling, the sterilized skimmed milk powder (500 mg) distilled water (10 ml) was added to cooked millet, followed by inoculation with 1 ml of L. rhamnosus (1% of L. rhamnosus in skimmed milk medium) and kept for fermentation. The total viable count of 1% of L. rhamnosus in skimmed milk medium was maintained at about log 4.77 CFU ml−1. The skimmed milk medium was prepared according to the protocol described by (Kumar et al., Reference Kumar, Kaur and Tomer2020). Fermented samples were kept at 4°C in sterile, airtight containers for further analysis. The synbiotic beverages production process was optimized using RSM by considering three parameters (time, temperature, and ratio of substrate to water). The software OriginPro 2023b was used for the RSM optimization process.
Experimental design and fermentation process
The fermentation process was carried out in 500 ml Erlenmeyer flasks. The response surface methodology (RSM) was used for the modeling and optimization process (OriginPro 2023b 16, used for RSM) with the following input parameters; temperature (26.6–43.4 °C), substrate loading ratio, i.e., substrate/water (16.6-33.4), time of operation (3.96 h to14.04 h) (Tables 1 and 2). The corresponding range of input parameters has been carefully selected according to previous similar studies conducted by various researchers. The inoculum loading was fixed at 1% (v/v) since it is the standard acceptable quantity usually implemented for fermentation processes. The central composite design (CCD) was generated using ORIGINPRO 2023B 16 software. The design matrix had eight cubic points, six center points in the cube, and six axial points. The α value was calculated as 1.68179. A total of 20 independent runs with different combinations of parameters with their different level were designed. Each experiment (run) was evaluated, and the final product's reducing sugar, FRAP, and protein concentrations were recorded, respectively (Table 1). Experimental data was used to fit the polynomial model equations to explain the effect of the considered parameters on reducing sugar, FRAP, and protein concentration of the final beverage. All these experiments were conducted in triplicate to ensure the reproducibility of each data.
Design matrix and experimental variables and their corresponding experimental and RSM and predicted values

A = Time, B = Temperature (℃), C = Substrate loading ratio.
Design matrix

Analysis of the nutritional composition of synbiotic beverage
Ferric-reducing antioxidant power (FRAP) assay
The FRAP was determined using the method used by (Pushparaj and Urooj, Reference Pushparaj and Urooj2014). FRAP reagent was prepared by mixing FeCl3 solution, TPTZ solution, and acetate buffer in a ratio of 1:1:10. Briefly, 100 µl of the fermented sample was added to the FRAP reagent (3 ml). Distilled water was used as blank. The absorbance was taken at 593 nm against FeSO4 solution. The FRAP was expressed as µmol Fe (II) per ml sample.
Reducing sugar content
The reducing sugars present in the samples were determined using DNS assay (Jain et al., Reference Jain, Jain, Jain, Jain, Jain and Jain2020). Briefly, 2 ml of sample and 1 ml of DNS reagent were incubated at 98°C for 10 min. Distilled water was used as blank. The absorbance was recorded at 540 nm against the standard glucose solution. The amount of reducing sugars was expressed as mg of glucose equivalent per ml of sample.
Protein content
The protein content was determined using the Bradford assay (Saxena et al., Reference Saxena, Vasudevan, Saini and Sasmal2023). Briefly, 100 µl of the fermented sample was mixed with 1.9 ml of Bradford reagent. Distilled water was used as blank. The absorbance was recorded at 595 nm against the standard BSA solution. The amount of protein was expressed as mg of BSA equivalent/ml.
Characterization of synbiotic beverage
DPPH radical scavenging activity assay
The DPPH radical scavenging activity was determined using a DPPH solution described by (Fu et al., Reference Fu, Chen, Dong, Zhang and Zhang2010) with minor modifications. Briefly, 0.6 ml of sample and 2.4 ml of DPPH were incubated at 37°C in the dark for 30 min. Methanol was used as a blank. The absorbance was taken at 520 nm. The DPPH radical scavenging activity was measured using Eq. 3.
 \begin{equation}Scavenging\,Activity\left( {\text{\% }} \right) = \left[ {1 - \frac{{Sample}}{{Blank}}} \right]\times100\end{equation}
Anti-nutrient content
The anti-nutrient content was measured using the Folin-Ciocalteu (FC) reagent, as reported by (Jahan et al., Reference Jahan, Hossain, Ahmed, Sultana, Biswas and Nada2018), with minor modifications. Briefly, 100 µl of the sample was mixed with 0.5 ml of FC reagent, 1.5 ml of 20% sodium carbonate, and 7.5 ml of distilled water. The solution was then incubated at room temperature for 30 min. Distilled water was used as blank. The absorbance was recorded at 725 nm against the tannic acid solution. The amount of tannic acid was expressed as mg of tannic acid equivalent per ml.
Total phenolic compounds
The total phenolic compounds were determined using the Folin-Ciocalteu reagent (Salar et al., Reference Salar, Purewal and Bhatti2016). Concisely, 100ul of the fermented sample, 0.5 ml of FC reagent, and 1.5 ml of sodium carbonate anhydrous (20%) were transferred in a 10 ml volumetric flask, vortexed, and volume made up to 10 ml and incubated for 15 min at room temperature. Distilled water was used as a blank. The absorbance was taken at 765 nm against gallic acid. Total phenolic compounds were expressed as mg of Gallic acid equivalent per ml.
Total flavonoid content
The total flavonoid content was determined using the aluminium chloride colorimetric method reported by (Chang et al., Reference Chang, Yang, Wen and Chern2002) with minor modifications. Concisely, 500 µl of the sample, 1.5 ml of 95% ethanol, 100 µl of 10% aluminium chloride, 100 µl of 1 M sodium acetate, and 2.8 ml of distilled water and incubated for 30 min at room temperature. The absorbance was taken at 415 nm against quercetin. The amount of total flavonoid was expressed as mg of quercetin equivalent per ml of sample.
Ash, moisture, and microbial load analysis
Moisture and ash content were determined using (AOAC 2000).
Titratable acidity
A sample of 10 ml was titrated against 0.05 N of NaOH, according to (Di Stefano et al., Reference Di Stefano, White, Seney, Hekmat, McDowell, Sumarah and Reid2017) with some minor modifications.
Microbial analysis of the final product
The fermented sample was serially diluted, and the microbial load was determined by the spread plate method using MRS agar. The microbial load was expressed as log CFU ml−1. The optimised synbiotic beverage was analysed for yeast, molds, and total coliform microbial count utilising VRBA (violet, red bile agar) and PDA (potato dextrose agar). The samples were serially diluted, and the spread plate method determined the microbial count. The microbial count was recorded in log CFU ml−1 (Chaturvedi and Chakraborty, Reference Chaturvedi and Chakraborty2022b).
Fourier transform infrared spectroscopy (FTIR) analysis
The FTIR spectra of synbiotic (fermented beverage) and unfermented beverages were obtained using an FTIR spectrophotometer (Model- Agilent Cary 630 spectrometer). The vacuum-dried beverages were used to record spectra with peaks between wave numbers from 450-4000 cm−1 at 32 runs per scan and a resolution of 8 cm−1. The spectra of beverages were attainted in terms of transmittance vs. wavenumber.
Principal component analysis
Principal component analysis was performed using OriginPro 2023b to summarize the fermentation patterns.
Sensory analysis
A panel of 41 trained volunteers from Netaji Subhas University of Technology evaluated synbiotic beverages (unflavoured fermented, and flavoured fermented) using sensory analysis. They assessed colour, odour, flavour, mouthfeel, and aftertaste using a 9-point hedonic scale (where “1” indicated “Extremely dislike,” “5” signified “neither like nor dislike,” and “9” denoted “extremely like.”). The samples were stored in disposable bottles in a controlled room with proper ventilation and mineral water for mouth rinsing.
Study of the shelf life of the beverage
The study investigated a synbiotic beverage under various conditions, analysing microbial parameters, pH levels, and antioxidant activity through the DPPH method. The synbiotic beverage underwent three evaluations, with results quantified as the percentage of inhibition, indicating the degree of free radical inhibition, as calculated using Eq. 4.
 \begin{align}Inhibition\,percentage\,\left( \% \right) &= [\left( Abs\,control - Abs\,sample\right)\!/ \nonumber\\
&\quad Abs\,control ] \times 100\end{align}
Where,
Abs (control) = absorbance of the methanol.
Results and discussion
Probiotic potential and characteristics
Determination of haemolytic activity
The lack of haemolytic activity is crucial in probiotic selection, as it prevents virulence (Yasmin et al., Reference Yasmin, Saeed, Khan, Khaliq, Chughtai, Iqbal, Tehseen, Naz, Liaqat, Mehmood and Ahsan2020). The haemolytic activity of L. rhamnosus was assessed based on a clear zone surrounding the streaking colonies (Fig. 1). The absence of clear or greenish zones around the colonies of L. rhamnosus indicates no haemolytic activity, confirming its non-pathogenic nature. This is critical for its safety as a probiotic strain in the synbiotic beverage. The lack of haemolysis by L. rhamnosus demonstrates its safety and suitability as a probiotic in the millet-based synbiotic beverage. This result supports its inclusion in functional dairy beverages without risk of cytotoxic effects.
Haemolytic activity analysis of L. Rhamnosus and E.Coli.

A clear zone around the E. coli colonies suggests β-haemolysis, indicating complete lysis of RBCs. This reflects the virulence potential of E. coli when present. The haemolytic activity observed in E. coli confirms its pathogenic potential. This highlights the importance of maintaining stringent hygiene and fermentation controls during the production of the synbiotic beverage to avoid contamination by harmful microbes. The study highlights the potential of millet-based synbiotic dairy beverages as a sustainable and health-promoting food product. The non-haemolytic behaviour of L. rhamnosus ensures that the beverage meets safety standards for functional foods. The presence of L. rhamnosus enhances gut health and immune modulation. The detection of haemolytic activity in E. coli highlights the need for quality assurance measures. The findings support further development of millet-based synbiotic beverages.
In-vitro resistance of L. rhamnosus in simulated gastro-intestinal conditions
Digestion of food depends on the gut's acidic pH, which is influenced by the variety of gastric juices. Also, the acidic environment inhibits the growth of certain pathogens and shields our bodies against gastrointestinal disorders. Hence, probiotics should be able to withstand and survive acidic conditions. Therefore, good probiotic food should resist pH 3.5 and 1.5–2 (Krausova et al., Reference Krausova, Hyrslova and Hynstova2019). The survival rate of L. rhamnosus from the synbiotic beverage was at pH 2 (67.5%), pH 3 (68.5%), and pH 4 (84.37%). The low pH and excessive gastric acidity also destroyed most probiotics (Gheziel et al., Reference Gheziel, Russo, Arena, Spano, Ouzari, Kheroua, Saidi, Fiocco, Kaddouri and Capozzi2019).
Study of cell-auto aggregation and hydrophobicity
The cell-auto aggregation of probiotics was calculated using Eq. 1 and found to be 12.63% and 17.31% after 3 h and 5 h of onset fermentation, respectively. During this period, microbes physically interact and settle to the base of static liquid, contributing to their persistence in the intestine (Krausova et al., Reference Krausova, Hyrslova and Hynstova2019).
Hydrophobicity is a pre-test for adhesion to the epithelial cell of probiotic strains. The probiotic with higher hydrophobicity is able to bind with epithelial cells (Krausova et al., Reference Krausova, Hyrslova and Hynstova2019). The hydrophobicity of L. rhamnosus in this study was 85.7%.
Analysis of prebiotic activity
The growth of L. rhamnosus and E.coli within 24 h in the presence and absence of prebiotic (cooked browntop millet) and standard sugar (glucose) was tabulated in Table 3. The synbiotic samples showed growth above 9.07 log CFU ml−1. Browntop millet had shown the highest growth 9.50 log CFU ml−1. The higher probiotic cell count can help to restore the gut microbiota and create an inappropriate environment for infections (Wang, Reference Wang2019). It can be concluded that the prebiotics (xylooligosaccharides, XOSs) found in millets promote growth and increase the number of probiotic cells (Kumar et al., Reference Kumar, Kaur and Tomer2020). According to WHO/FAO, a probiotic supplement should offer 108 CFU day−1 for good gut health. Therefore, the results obtained in this study satisfied the WHO/FAO standard.
Comparison of microbial count increased from 0–24 h in media having prebiotic (experiments done in triplicate manner)

E.coli growth was observed less (3.69 – 6.90 log CFU ml−1) in all the samples. The restricted growth of E.coli may be because of the competitive prohibition mechanism shown by the probiotic. Also, bacteriocins, organic acids, hydrogen peroxide, and SCFA create an inappropriate environment for pathogens (Wang, Reference Wang2019).
The prebiotic activity score of browntop millet (0.147 ± 0.01) was calculated using Eq. 2, The positive prebiotic score depicts the potency of prebiotic components in increasing the probiotic growth and prohibiting the pathogens in their presence. However, a negative prebiotic activity score shows that prebiotics permit colonising the pathogens and promote the growth of pathogens rather than probiotics. Similar findings were reported by (Chaturvedi et al., Reference Chaturvedi and Chakraborty2022a), where the prebiotic activity score of legume-based synbiotic beverages ranged between 0.13–0.24.
RSM modelling
Numerous computer software tools are available for the purpose of experimental design, and among them, OriginPro 2023b emerges as a widely favored choice in response surface methodology. Response surface methodology (RSM) has been primarily used in research and development to optimise non-linear bioprocesses. The most pivotal and foundational step in RSM is selecting independent variables. These variables wield substantial influence not only over the bioprocess itself but also over the response variable (Veza et al., Reference Veza, Spraggon, Fattah and Idris2023).
Statistical evaluation was performed to investigate the effects of the three independent variables (time, temperature, and substrate loading ratio) and their interaction on the yields of FRAP, reducing sugar and protein content, which were the response variables of the fermentation process. The second-order polynomial equation for each response was fitted to the measured data, and analysis of variance (ANOVA) was also performed. The quadratic models generated (Eqs. 5–7) after optimisation were as follows
 \begin{align}{Y_1} &= 498.69 + 69.18A - 48.24B - 15.32C + 49.83{A^2} \nonumber\\
&\quad + 15.06{B^2} - 9.11{C^2} + 19.72AB + 73.33AC - 46.11BC\end{align}
 \begin{align}{Y_2} &= 65.43 + 1.57A - 3.77B - 3.69C + 1.67{A^2} + 2.19{B^2} \nonumber\\
&\quad - 2.62{C^2} + 2AB + 1.54AC + 0.30BC\end{align}
 \begin{align}{Y_3} &= 0.41 + 0.06A - 0.18B - 0.02C + 0.11{A^2} \nonumber\\
&\quad + 0.14{B^2} - 0.06{C^2} + 0.01AB + 0.05AC - 0.05BC\end{align}
Where, Y1, Y2, and Y3 represent responses for FRAP, reducing sugar, and protein, respectively.
The mathematical model generated by the RSM approach was validated by ANOVA. It was prudent to set the maximum value for the process variables, the time needed for the reaction, and the cost. After determining the most significant level of parameters with the help of the optimization tool, various numerical permutations were tested to find those that would maximize the mode.
The experimental findings obtained from the design runs carried out with the configured CCD were used to inform the alterations to the response surface designs. This led to an equation in coded forms, with A, B, and C denoting time, temperature, and substrate (millet and skim milk powder)-to-water ratio, respectively. Considering this, the responses, namely FRAP, sugar reduction, and beverage samples’ protein content were estimated using Equations 4, 5, and 6, respectively. The findings of an analysis of variance (ANOVA) were shown in the supplementary information (Table S1-S3) for all three models. All these models are statistically significant, as demonstrated by the fact that the generated model's “F-value” was 5.11 (for FRAP), 1.23 (for RS), and 3 (for Protein), respectively, with “Prob > F” consistently lower than 0.0500. The impact of three independent variables, time, temperature, and ratio, on antioxidant FRAP activity, reducing sugar and protein were determined using response surface methodology.
Analysis of the nutritional composition of synbiotic beverage
Effect of independent variables on FRAP activity
The FRAP activity assay is based on the principle of reducing the ferric tripyridyl triazine (TPTZ) complex to Fe2 +. This reduction process results in the formation of a deep blue color, the intensity of which is directly proportional to the quantity of antioxidant reductants within the sample. The antioxidants present in the sample serve as oxidants (Yilmaz-Ersan et al., Reference Yilmaz-Ersan, Ozcan, Akpinar-Bayizit and Sahin2018).The outcome of the FRAP assay concerning time, temperature, and ratio, have been visually represented through surface graphs in Fig. 2A–C. Among the 20 samples, the FRAP values exhibited a range from 327.77 to 805.54 µmol Fe (II)/ml. Significantly, as the time variable increased, a corresponding increase in antioxidant FRAP activity was observed. These findings align with the research conducted by (Ahmed et al., Reference Ahmed, Hikal and Abou-Taleb2020), who also reported a substantial enhancement in the antioxidant properties of kombucha over time. Similarly, an increase in antioxidant activity was observed when kombucha was fermented using the lactobacillus strain, as documented by (Parrella et al., Reference Parrella, Caterino, Cangiano, Criscuolo, Russo, Lavorgna and Isidori2012). Under conditions of low temperature and reduced substrate loading ratio, the FRAP antioxidant activity reached its peak value. Under particular conditions characterized by low temperature and reduced substrate loading ratio, more effectiveness was observed in relation to higher FRAP values. These findings align with the research conducted by (Usta-Gorgun et al., Reference Usta-Gorgun, Yilmaz-Ersan and Sahin2022). The increase in FRAP values may be because the optimal moisture content is essential for the growth and activity of the bacterial strain. As the moisture content ratio increases, there is a corresponding rise in FRAP activity, primarily because of the increased availability of moisture required for the growth and activity of the microbial strain.
Three-dimensional response surface plot, for FRAP (A–C), reducing sugar (D–F) and protein (G–I) present after fermentation of browntop millet based synbiotic beverage.

Effect of independent variables on reducing sugar
The reducing sugar of the beverage was estimated by 3, 5-dinitrosalicylic acid method (DNSA), which detects the presence of free carbonyl groups within the reducing sugar. Fermentation and other food processing methods like germination, have the potential to significantly enhance the content of reducing sugars (Jaybhaye et al., Reference Jaybhaye, Pardeshi, Vengaiah and Srivastav2014). The outcome of the reducing sugar concerning time, temperature, and ratio have been visually represented through surface graphs in Fig. 2.
Among the 20 samples, the reducing sugar content exhibited a range from 54.3 to 87.03 mg Glucose Eq ml. Notably, there was a corresponding increase in reducing sugar as the duration of the time variable increased. This increase can be attributed to the fermentation process, wherein bacteria break down complex sugars into simpler sugar byproducts and various other metabolic products, ultimately resulting in the production of glucose and similar compounds. The breakdown of carbohydrates into simple sugars, such as glucose, occurs in the presence of bacteria during fermentation. Under specific conditions characterized by low temperature and a reduced substrate loading ratio, the reducing sugar content of the beverage reached its highest point. These conditions appeared to be particularly effective in promoting higher reducing sugar values.
Effect of independent variables on protein
The protein content of beverage was determined using the Bradford assay, based on the principle that when Coomassie Brillant BlueG-250 binds to protein, absorbance shifts from 465 nm to 595 nm (Kielkopf et al., Reference Kielkopf, Bauer and Urbatsch2020). The results relating to the protein, concerning time, temperature, and ratio, have been visually depicted through surface graphs in Fig. 2G, 2H–I. Among the 20 samples analysed, the protein content ranged from 0.204 to 1.35 mg BSA Eq/ml. Significantly, there was a corresponding increase in protein content with an extended duration of the time variable. This increase in protein content may be attributed to a reduction in anti-nutrients, such as polyphenols, during fermentation. Polyphenols, due to their hydroxyl (OH) groups, have the ability to directly bind to proteins. Consequently, protein release occurs, leading to an accumulation of protein and the generation of various additional amino acids during the fermentation period (Tomar et al., Reference Tomar, Bhardwaj, Verma, Singh, Krishnan, Kansal, Yadav, Praveen and Sachdev2022). The protein content peaked under low temperature and reduced substrate loading ratio.
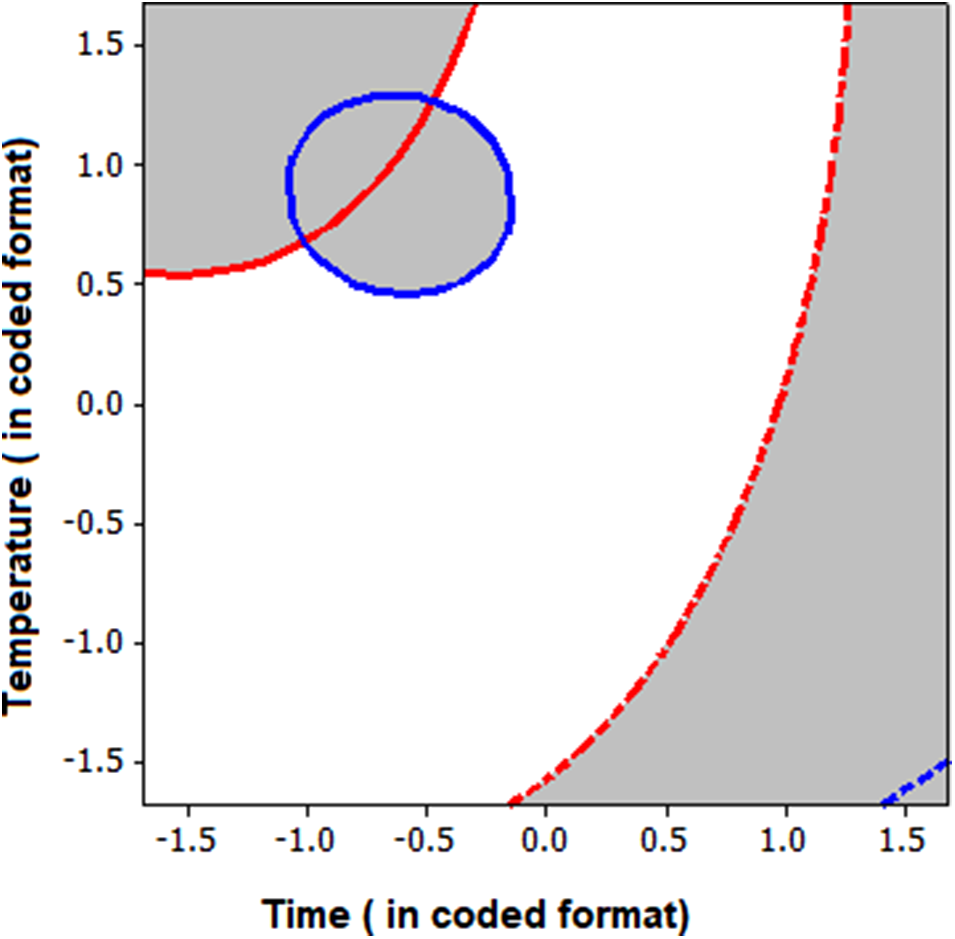
The present study conducted a multi-response optimisation method to determine the optimum condition. The predicted response for FRAP, reducing sugar and protein was 751.639 µ mol Fe (II)/ml (desirability 1), 89.880 mg/ml (desirability 0.98), and, 1.262 mg/ml (desirability 0.90), respectively (Fig. 3). A contour plot was drawn (Fig. 4) to understand the desired region of maximum yield of FRAP, reducing sugar and protein. The white zone in the contour plot is the most feasible area where all these three responses, i.e., FRAP, reducing sugar and protein concentration, will be high. This desired zone lies within temperature 26.6℃, duration of operation 3.96 h and keeping SLR at 16.6. The predicted optimal conditions were validated by conducting a separate experiment in triplicate, and experimental validation produced a FRAP concentration of 757.42 µ mol Fe (II)/ml, reducing sugar to 90.38 mg/ml and protein concentration was found to 1.31 mg/ml. Therefore, negligible deviations were observed between the experimental and model-predicted values.
Optimization plot for multiple response i.e., FRAP, reducing sugar, protein concentration in browntop millet based synbiotic beverage.

Contour plot of FRAP, RS and protein concentration present in browntop millet based synbiotic beverage.

Characterization of the final product
After optimization of the process conditions, the present study used those conditions and manufactured the product per the new design conditions. The different characterization parameters and their experimental value are mentioned in Table 4. The experiments were duplicated, and results are expressed as mean ± standard deviation. The final product's protein content was higher than raw millet (0.943 mg/gm). The reduced sugar concentration was less than raw millet (128 mg/gm) because of the fermentation process. The other parameters, such as FRAP for DPPH (2,2-diphenyl-1-picrylhydrazyl) assay, were also conducted. In the DPPH technique, antioxidants can contribute electrons or hydrogen radicals to the DPPH free radical to stabilize the radical. The FRAP approach evaluates antioxidants according to their capacity to donate an electron and convert ferric (Fe3+) ions to ferrous (Fe2+) ions. The microbial analysis of the final product was done by determining the yeast, moulds, coliform, and probiotic growth. It was observed that the total viable count of the probiotic was 7.77 log CFU ml−1 and no growth of coliform, yeast, and mold was seen, indicating that the beverage was prepared hygienically.
Characterization of the final product (experiments done in triplicate manner)

Fourier transform infrared spectroscopy (FTIR) analysis
FTIR spectroscopy is a technique used for studying to confirm the presence of different functional groups their bending, vibrational, and stretching. FTIR results of unfermented and fermented beverages (synbiotic beverage) were depicted in Fig. 5. In fermented (synbiotic beverage), the peaks were found in a range of 3265-3268 cm−1 confirming the inter-molecular and intra-molecular H-bond or hydroxyl group (OH) presence. Furthermore, the increase in the width of fermented beverages having OH peak can be ascribed the presence of alcohol formation during fermentation. In the region of 3000-2800 cm−1, aliphatic C-H stretching was observed and vibrational peaks at (1446-1438 cm−1) can be attributed to the presence of bounded water (moisture) (Adebiyi et al., Reference Adebiyi, Obadina, Mulaba-Bafubiandi, Adebo and Kayitesi2016). The peak observed in the region of 1700-1600 cm−1 (unfermented beverage (1639 cm−1), fermented beverage (1627 cm−1), can be attributed to the presence of amide stretch C = O (Kumar et al., Reference Kumar, Kaur and Tomer2020). In the region of 1650-1430 cm−1, C-C stretching within the aromatic ring (unfermented beverage (1540 cm−1), fermented beverage (1446 cm−1), and vibrational peaks in the region of 1250-1000 cm−1 can be attributed to the presence of C-O stretching of lactose and its fractions (Chen et al., Reference Chen, Shi, Yang, Nan, Liu and Wang2015).
FTIR spectra of unfermented and fermented beverages.

Principal component analysis
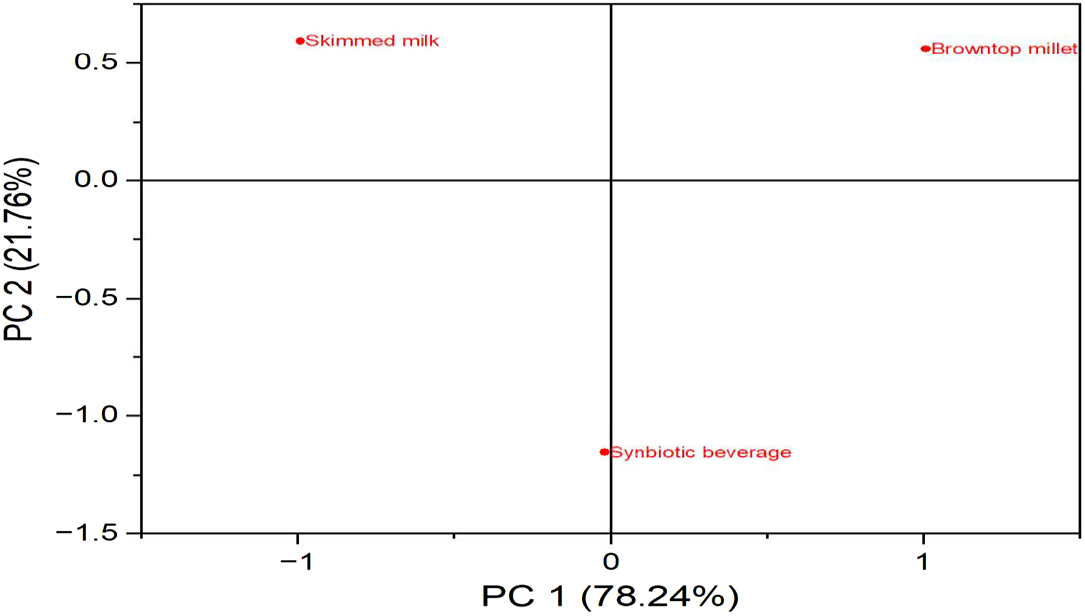
PCA was employed to identify the essential characteristics of browntop millet, Skimmed milk, and Synbiotic beverage, utilizing parameters such as Protein content, reducing sugar, FRAP activity, DPPH, Anti-nutrient content, Total flavonoid content, and Total phenolic compounds. For visualisation, the samples were projected in two or three-dimensional space, with Principal Components (PCAs) serving as axes. Each PCA is orthogonal to the others, allowing for a comprehensive representation of the data (Granato et al., Reference Granato, Santos, Escher, Ferreira and Maggio2018). PCA 1 and PCA 2 were 78.24% and 21.76% means all the variations in the original data are captured and explained by PCA. The first two principal components (PCs) collectively account for approximately 100% of the variance in the data.
A score plot is a pictographic depiction that helps to understand the relationship between the principal components and samples with each other. Based on the score plot values of each attribute, browntop millet, Skimmed milk, and Synbiotic beverage were categorized into three distinct groups, as shown in Fig. 6. The first group, i.e. browntop millet, was positioned on the positive side on both PCA 1 (1.0094) and PCA 2 (0.5606), the second group skimmed milk was located on the negative side of PCA 1(−0.9902) and the positive side of PCA 2 (0.5939) and the third group synbiotic beverage was positioned on the negative side on both PCA 1 (−0.0192) and PCA 2 (−1.1545).
Principal component analysis score plot for of browntop millet, skimmed milk, and synbiotic beverage.

A loading plot Fig. 7 is a pictographic depiction between the principal components and the original data set as shown in Table 5 where its positive association identified PC 1 with anti-nutrient content, total flavonoid content, FRAP activity, DPPH, and total phenolic compounds. Conversely, PC 2 was identified by its positive association with protein and reducing sugar, Anti-nutrient content, Total flavonoid content, and FRAP activity.
Principal component analysis loading plot for of browntop millet, skimmed milk, and synbiotic beverage in terms of their physicochemical characterization.

Factor loadings

Browntop millet was identified by its high association with anti-nutrient content, total flavonoids, and FRAP. Conversely, skimmed milk was characterized by high correlations with protein and reducing sugar. The synbiotic beverage, made from browntop millet and skimmed milk, transforms fermentation, resulting in distinct characteristics separate from its original components. The fermentation process significantly alters the physicochemical properties of the synbiotic beverage.
Pearson's correlation coefficient, as mentioned in Fig. 8, of different characteristics was computed using OriginPro 2023b, where a P value below 0.05 is considered statistically significant. The color code interpretation of a matrix shows positive correlations between protein and anti-nutrients (0.91), reducing sugar (0.51) and anti-nutrients vs reducing sugar (0.94), and total flavonoid content vs anti nutrient (0.64). High protein content is associated with increased anti-nutrient levels, which is common in millet-based products. Reducing sugar content is closely linked to anti-nutrient levels, possibly due to fermentation processes. A moderate positive correlation suggests that as protein levels increase, reducing sugar levels tend to rise. Anti-nutrient levels are related to flavonoid content, as both compounds are secondary metabolites that influence the nutritional profile. Weak or negligible correlations are found between protein and antioxidant capacity measured by FRAP (0.22), DPPH activity (0.3), and total phenolic compounds (0.27). No significant negative correlations are evident in the matrix.
Pearson's correlation coefficient of different characteristics.

Millet-based synbiotic beverages can improve nutritional quality by enhancing protein content, reducing anti-nutrients, and improving antioxidant activity. Understanding these correlations helps balance nutritional and functional attributes while minimizing anti-nutrient impact. Fermentation plays a role in influencing traits like reducing sugars, proteins, and antioxidant properties, and optimizing fermentation conditions can enhance the overall profile of the beverage. Techniques like fermentation or enzymatic treatment could mitigate these issues.
The correlation coefficients obtained from PCA data can be compared (Apaliya et al., Reference Apaliya, Kwaw, Tchabo, Sackey and Boateng2017). The analysis of variance revealed noteworthy differences among the characteristics of browntop millet, skimmed milk, and synbiotic beverage. Specifically, protein and reducing sugar exhibited a significant positive correlation with each other. However, they displayed a significant negative correlation with FRAP, followed by DPPH, anti-nutrient content, total flavonoids, and total phenolic compounds. Conversely, FRAP, DPPH, anti-nutrient content, total flavonoids, and total phenolic compounds demonstrated a significant positive correlation. Meanwhile, they exhibited a significant negative correlation between protein and reducing sugar.
Sensory analysis
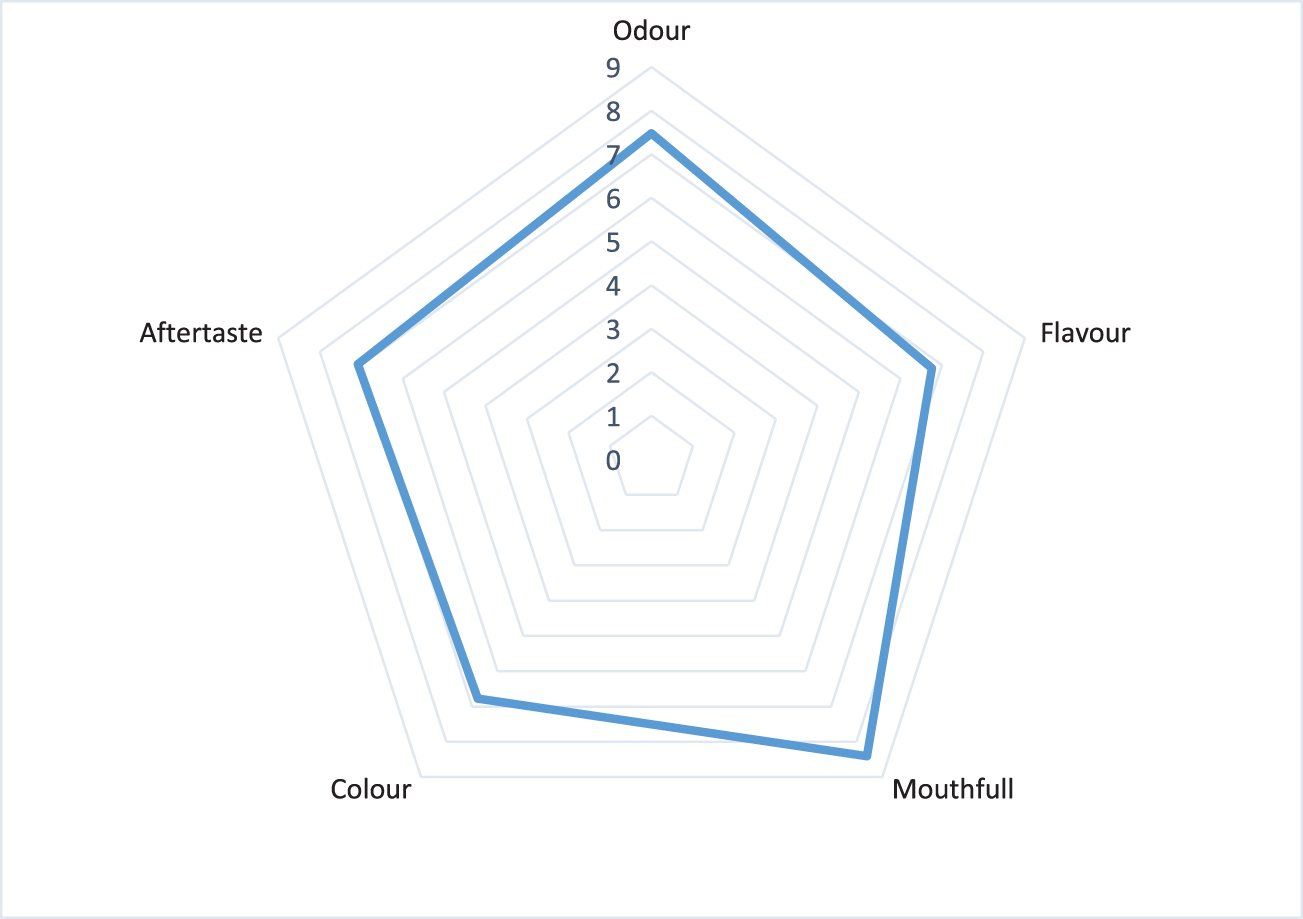
Sensory assessment is crucial for developing millet-based beverages, as it helps visualize the impact of individual beverages on sensory qualities. Therefore, sensory analysis is essential for evaluating food acceptance and rejection. Attributes like colour, odor, flavor, taste, and mouth-fulness are used in sensory evaluation (Arya and Shakya, Reference Arya and Shakya2021). The outcome of this analysis was depicted in Table 6 and Fig. 9. The radar chart (Fig. 9) represents the sensory evaluation of a millet-based synbiotic beverage, showcasing scores for five sensory attributes: Odour, Flavour, Mouthfeel, Colour, and Aftertaste. The scores range on a scale of 0–9, with higher values indicating greater sensory satisfaction.
Sensory analysis of synbiotic beverage.

Sensory analysis of synbiotic beverage

The beverage's odour and flavour scores (8/9 and 7/9 respectively) were high, indicating a well-accepted aroma and a balanced taste. The presence of probiotics and millet prebiotics may appeal to health-conscious consumers. The mouthfeel score (6/9) was satisfactory, with a creamy texture due to millet's protein and fiber content. The color score was average (5/9), suggesting room for improvement in visual appeal. The aftertaste score (6/9) was similar, suggesting the lingering taste post-consumption is generally acceptable but could be refined further. The beverage's high odour and flavor scores indicate its potential for market success among health-conscious consumers. Optimizing fermentation for aroma development could enhance sensory appeal. The beverage's sensory attributes align well with health-conscious consumers seeking functional beverages with acceptable sensory profiles.
Shelf life
Shelf life and sensory analysis are crucial in product development, as nutrients in food products naturally deteriorate over time, regardless of food type. The physicochemical properties of the selected synbiotic beverage samples were tabulated (Table 7). Notably, the pH values exhibited a decreasing trend with increased storage time. The pH range of the beverage was observed in symbiotic beverage sample exhibited a pH range of (4.43-6.21). The quantification of antioxidant compounds or bioactive chemicals in the DPPH assay is based on their capacity to neutralise the DPPH radical. At the beginning (0th day), the antioxidant (DPPH inhibition) activity was observed as follows Synbiotic beverage (54%). Interestingly, the DPPH values initially decreased from the 0th to the 1st day, followed by an increasing trend up to the 11th day, with a slight decline observed on the 15th day of storage. This pattern was consistent across Synbiotic beverage. The increase in DPPH activity can be correlated with increased lactic acid content in synbiotic beverage. The microbial load (log CFU/ml) increased as storage time progressed, with the highest microbial load recorded on the 15th day of storage. The increase in microbial load may be attributed to the utilisation of the substrate, namely brown-top millet biomass, during the fermentation and development of synbiotic beverages. The browntop millet biomass is rich in protein, sugars, and micronutrients, providing optimum conditions to grow even under refrigeration conditions (Mancuskova et al., Reference Mancuskova, Medvedova and Valik2015).
The shelf life of selected synbiotic beverage

Conclusion
Browntop millet and a probiotic culture were fermented to create the new synbiotic drink. To our knowledge, this is the first synbiotic beverage made with browntop millet. Beneficial microbes and prebiotics were used during fermentation. The work optimized the fermentation conditions of synbiotic beverages based on browntop and predicted optimum process conditions at 26.6℃, duration of operation at 3.96 h, and SLR at 16.6 within the design conditions. The study also showed that the beverages fermented with probiotic bacteria L. rhamnosus maintained good cell hydrophobicity and cell aggregation property. The haemolytic activity test confirmed that L. rhamnosus isolated from the millet-based synbiotic dairy beverage is non-haemolytic and thus safe for inclusion as a probiotic strain. In contrast, the β-haemolytic activity of E. coli highlights the importance of strict production controls to ensure the microbial safety of functional food products. The characterization of the final product revealed that the product has significantly less amount of ash and a slightly acidic in nature. These findings demonstrated the prospect of synbiotic beverage production in a large-scale process and development. The correlation analysis provides valuable insights into the interrelationships among key characteristics of the millet-based synbiotic beverage. Strong correlations (e.g., between protein and anti-nutrients) highlight areas to optimize during beverage development, while moderate correlations (e.g., flavonoids and antioxidants) indicate functional synergies. These findings can guide future product refinement to balance nutritional benefits and functional properties effectively. It is important to note that while synbiotic beverages have promising prospects, individual responses may vary, and further research is needed to understand their specific health benefits and optimal formulations. The sensory analysis indicates that the millet-based synbiotic beverage is well-received for odour, flavour, and mouthfeel, making it a promising product for health-oriented markets. Targeted improvements in colour and aftertaste could further enhance its consumer acceptance and marketability. By refining these aspects, the beverage can achieve a more balanced and appealing sensory profile.
Acknowledgement
The authors would like to thank Prof. Ashok Kumar Dubey and Prof. Ashok Kumar Srivastava, Department of Biological Sciences and Engineering, Netaji Subhas University of Technology, New Delhi 110078, India, for their valuable guidance, insightful feedback in enhancing the quality, and continuous support throughout the research work.
Supplementary material
The supplementary material for this article can be found at https://doi.org/10.1017/S002202992510099X.
Funding statements
The authors have no relevant financial or non-financial interests to disclose.
Author contributions
The conception and design of the study, or acquisition of data, or analysis and interpretation of data is done by Sonia Saini and Soumya Sasmal. Drafting the article and revising it critically for important intellectual content is done Sonia Saini, Soumya Sasmal and Sangita Ganguli. All the authors have approved the final version of the manuscript.