



1. Introduction
Explosive dispersal of granular media, whereby the detonation of central explosive or sudden release of pressurized gases disperses the densely packed particles to form dilute particle clouds, occurs in a wide range of natural phenomena and engineering processes (Formenti, Druitt & Kelfoun Reference Formenti, Druitt and Kelfoun2003; Eckhoff Reference Eckhoff2009; Aglitskiy et al. Reference Aglitskiy2010; Frost Reference Frost2018; Kuranz et al. Reference Kuranz2018; Marr et al. Reference Marr, Pontalier, Loiseau, Goroshin and Frost2018; Pontalier et al. Reference Pontalier, Lhoumeau, Milne, Longbottom and Frost2018; Rigby et al. Reference Rigby, Fay, Tyas, Clarke, Reay, Warren, Gant and Elgy2018). In volcanic eruptions, the explosive expansion of pressurized gases through an initially concentrated dispersion of particles expels mixtures of pressurized gases and fragments of magma within volcanic conduits (Marjanovic et al. Reference Marjanovic, Hackl, Shringarpure, Annamalai, Jackson and Balachandar2018). For various commercial and military explosive systems, such as fire extinguishing devices using explosive dispersed dry powders (Klemens, Gieras & Kaluzny Reference Klemens, Gieras and Kaluzny2007), thermobaric and fuel-air bombs (Frost et al. Reference Frost, Goroshin, Ripley and Zhang2010, Reference Frost, Grégoire, Petel, Goroshin and Zhang2012), the explosive dispersal of granular media and the ensuing mixing of particulate matter with air are of particular importance to their reliable applications (Zhang et al. Reference Zhang, Ripley, Yoshinaka, Findlay, Anderson and von Rosen2015; Bai et al. Reference Bai, Wang, Xue and Wang2018; Posey et al. Reference Posey, Roque, Guhathakurta and Houim2021). To harness the explosive dispersal of granular media and attain the optimal dispersal outcome in terms of the size and the concentration of the resulting aerosol cloud, it is of utmost importance to establish the correlation between the dispersal process and the structure of the dispersal system.
A widely accepted archetype of the explosive dispersal system consists of a densely packed particle shell surrounding a central explosive source which may take the form of either a high explosive or the pressurized gas pocket (Frost et al. Reference Frost, Grégoire, Petel, Goroshin and Zhang2012, Reference Frost2018; Ling & Balachandar Reference Ling and Balachandar2018; Osnes, Vartdal & Pettersson Reif Reference Osnes, Vartdal and Pettersson Reif2018; Fernández-Godino et al. Reference Fernández-Godino, Ouellet, Haftka and Balachandar2019; Hughes et al. Reference Hughes, Balachandar, Diggs, Haftka, Kim and Littrell2020; Koneru et al. Reference Koneru, Rollin, Durant, Ouellet and Balachandar2020). Even such a simplistic configuration has a multitude of structural parameters on both macro- and micro-scales. The macroscale set of parameters includes the geometries and masses of the particle shell and the central explosive, the porosity of the particle packings, the total energy of the explosive source, etc. While the particle size (size distribution), density, morphology and material properties constitute the microscale set of parameters. Among the variety of parameters, the mass ratio, M/C, namely the mass ratio between the particle shell and the explosive, is found to play a pivotal role in determining the initial expanding velocity of the dispersed particulate matter, Vring (Milne Reference Milne2016). Since the inverse of the M/C scales with the energy available for the particles per unit mass, it underpins the macroscale coupling between the central explosive source and the particle shell as an entirety. As previous study reveals, an increased M/C leads to a more enduring macroscale coupling, which is characterized by the cyclical fluctuation of the central pressure and the synchronized expansion–implosion pulsation of the enclosing shell (Kun et al. Reference Kun, Lvlan, Jiarui, Chunhua and Baolin2023). Conversely a short-lived macroscale coupling is expected for a very small M/C, where the initial energy imparted upon the particle shell is so high that the shell prematurely expands out of the reach of the central pressurized region.
The aforementioned macroscale gas–particle coupling that is equivalent to the coupling between the central gases and the continuum encasing shell occurs on the inner surface of shell, although the solid stresses inside the particle shell arises from the inter-grain contacts (Saurel et al. Reference Saurel, Favrie, Petitpas, Lallemand and Gavrilyuk2010; Black, Denissen & McFarland Reference Black, Denissen and McFarland2018; Marayikkottu & Levin Reference Marayikkottu and Levin2021). The explosive dispersal of the continuum shell is predominantly governed by the macroscale coupling. In contrast, the explosive dispersal of the granular media is influenced collectively by the meso- and microscale couplings, whereby a variety of the macro- and micro-scale parameters become relevant. Specifically, the detonation products or the pressurized gases induce an intense gas filtration through the thickness of the particle shell (Lv et al. Reference Lv, Wang, Zhang and Li2018; Li et al. Reference Li, Xue, Zeng, Tian and Guo2021). The resulting inter-pore gas flows and the diffusional pressure field also mediate the momentum/energy transfer from the explosive source to the particles via drag forces (Mehta et al. Reference Mehta, Neal, Salari, Jackson, Balachandar and Thakur2018; Gai et al. Reference Gai, Thomine, Hadjadj and Kudriakov2020; Hughes et al. Reference Hughes, Charonko, Prestridge, Kim, Haftka and Balachandar2021) and pressure gradient forces. Meanwhile the gas flow out removes the energy from the dispersal system, reducing the energy available for the particles. Since the intensity of the gas filtration varies with the mesoscale-averaged porosity and gas–particle relative velocity, the gas filtration mediated coupling is referred to as the mesoscale gas–particle coupling.
Both macro- and mesoscale coupling require that the particle shell remains coherent, namely enduring inter-particle contacts dominate the inter-particle interactions. The integrity of the particle shell will be significantly compromised by massive particle shedding that is inevitable for dry particle packings without inter-grain cohesion (Frost et al. Reference Frost, Grégoire, Petel, Goroshin and Zhang2012; Milne et al. Reference Milne, Floyd, Longbottom and Taylor2014). Accordingly, the confinement provided by the particle shell to the central gases is weakened, leading to an enhanced gas escape. Less energy is retained in the central gas pocket. Meanwhile the gas filtration begins to cease since no significant pressure gradient is built across the thickness of a very diluted particle shell. In this scenario both macro- and mesoscale couplings become insignificant. If the particle shell is prone to shedding particles, the gas–particle coupling soon evolves into the coupling between gases and individual particles, thereafter the microscale coupling prevails. Because either the meso- or microscale gas–particle coupling depends on both the macro- and micro-scale parameters, it is necessary to properly account for the effects from those multiscale parameters for establishing the structure-dispersal behaviour correlation.
Resolving the multiscale gas–particle coupling that underlies the explosive dispersal of the particle shell can be aided by laboratory-scale simulation with the particle-scale information (Ling, Balachandar & Parmar Reference Ling, Balachandar and Parmar2016; Mo et al. Reference Mo, Lien, Zhang and Cronin2018, Reference Mo, Lien, Zhang and Cronin2019). Thus, adopting a coarse-grained computational fluid dynamics–discrete parcel method, we carried out four-way coupled Euler–Lagrange simulations wherein the denotation of a cylindrical burster was simulated by the sudden release of pressurized gases in the central gas pocket. More than one hundred simulations were performed wherein the macro- and/or micro-scale structural parameters of the dispersal system vary from system to system, which allows us access to a wide variety of multiscale couplings and the resulting dispersal behaviours. Informed by the governing mechanisms of multiscale gas–particle couplings, a modified mass ratio is proposed which explicitly correlates with the dispersal mode. We proceeded to establish a continuum-based theoretical model which accounts for the macro- and meso-scale gas–particle couplings. Despite a lack of microscale coupling, this model successfully predicts whether a given dispersal system produces an ideal or validated failed dispersal mode, paving the way to establishing a fully resolved structure-dispersal behaviour correlation.
The paper is organized as follows: in § 2 we present the numerical method, the prototypal configuration of the explosive dispersal system and the numerical set-up. The characteristic events associated with the macro-, meso- and microscale gas–particle couplings and their respective influences on the dispersal behaviours are elaborated in § 3. At the end of which, a complex non-dimensional descriptor known as the modified mass ratio is devised, to correlate the dispersal mode of the dispersal systems with multiscale parameters. An elaborate theoretical model that incorporates the macro- and mesoscale couplings is established in § 4 to predict the dispersal mode. The microscale coupling effects are further discussed in § 5. Finally, the results are summarized in § 6.
2. Numerical method
2.1. Governing equations and numerical algorithm
Numerical simulations were performed based on the coarse-grained compressible computational fluid dynamics-discrete parcel method (CCFD-DPM), a coarse-grained Euler–Lagrange numerical approach suitable for gas–particle flows in laboratory-scale systems (Sundaresan, Ozel & Kolehmainen Reference Sundaresan, Ozel and Kolehmainen2018; Tian et al. Reference Tian, Zeng, Meng, Chen, Guo and Xue2020). The CCFD-DPM approach tracks and accounts for parcel–parcel contact interactions. Each parcel consists of multiple physical particles with the same physical and kinetic properties. The number of physical particles that a computational parcel represents is quantified using a scaling factor, namely the super particle loading, χ, whose value is set based on the volume/mass fraction of the particles and computational memory available. For particle–gas systems, the reported χ in previous literature ranges from O(101) to O(103) (Osnes et al. Reference Osnes, Vartdal and Pettersson Reif2018; Koneru et al. Reference Koneru, Rollin, Durant, Ouellet and Balachandar2020). In the present work, χ is of the order of O(101).
For the gas phase, the volume-averaged governing equations [(2.1)–(2.3)] constructed in the Eulerian frame are based on a five-equation transport model, i.e. a simplified form of the Baer–Nunziato model, which has been modified to account for compressible multiphase flows ranging from dilute to dense gas–particle flows (Baer & Nunziato Reference Baer and Nunziato1986)
 \begin{gather}
\dfrac{\partial(\phi_{f}\langle {\rho_f}\rangle)}{{\partial t}} + \boldsymbol{\nabla }\boldsymbol{\cdot
}({\phi _f}\langle {\rho_f}\rangle
{{\tilde{\boldsymbol{u}}}_f}) = 0,
\end{gather}
 \begin{gather}
\dfrac{{\partial ({\phi
_f}{{\tilde{\boldsymbol{u}}}_f}\langle {\rho_f}\rangle
)}}{{\partial t}} + \boldsymbol{\nabla }\boldsymbol{\cdot
}{\bf (}{\phi _f}\langle {\rho_f}\rangle
{{\tilde{\boldsymbol{u}}}_f}{{\tilde{\boldsymbol{u}}}_f} +
{\phi _f}\langle {P_f}\rangle ) = \langle {P_f}\rangle
\boldsymbol{\nabla }{\phi _f}\notag\\ \quad + \sum\limits_i {\{
{\phi _{p,i}}{\rho
_{p,i}}{D_{p,i}}({{\tilde{\boldsymbol{u}}}_{p,i}} -
{{({{\tilde{\boldsymbol{u}}}_f})}_i})\} } ,
\end{gather}
 \begin{gather}
\dfrac{{\partial ({\phi _f}\langle {\rho _f}\rangle
{{\tilde{E}}_f})}}{{\partial t}} + \boldsymbol{\nabla
}\boldsymbol{\cdot }({\phi _f}\langle {\rho _f}\rangle
{{\tilde{E}}_f}{{\tilde{\boldsymbol{u}}}_f} + {\phi
_f}\langle {P _f}\rangle {{\tilde{\boldsymbol{u}}}_f})\notag\\
\quad = \langle {P _f}\rangle \boldsymbol{\nabla
}{\phi _f}\boldsymbol{\cdot }{{\tilde{\boldsymbol{u}}}_p} +
\sum\limits_i {\{ {\phi _{p,i}}{\rho
_{p,i}}{D_{p,i}}({\boldsymbol{u}_{p,i}} -
{{({{\tilde{\boldsymbol{u}}}_f})}_i})\boldsymbol{\cdot
}{{\tilde{\boldsymbol{u}}}_{p,i}}\} } .
\end{gather}
The gas volume fraction, velocity, density, pressure and the total energy of the gas are represented by ϕf, uf, ρf, Pf and Ef, Ef = ρf ef + 0.5 ρf uf uf, respectively. In (2.1)–(2.3),  $\langle \;\rangle $ and
 $\,\,\widetilde {}\,\,$ denote phase-averaged and mass-averaged variables, respectively, ρp.i and up ,i are the density and velocity of parcel i, Dp,i is the drag force coefficient of parcel i and ϕp.i = wi,f Vp,i/Vf is the contribution of parcel i to the weighted particle volume fraction (wi,f is the distributed weight that parcel i contributes to the particle volume fraction in fluid cell, Vp,i and Vf are the volumes of parcel i and the fluid cell).
We employ the Di Felice model combined with Ergun's equation ((2.4)–(2.7)) to calculate Dp (Di Felice Reference Di Felice1994), which considers the effects of both the particle Reynold number, Rep, and the particle phase volume fraction, ϕp. The model has been widely used in particle-laden multiphase flows
 \begin{gather}{D_{p,i}} = \frac{3}{{8sg}}{C_d}\frac{{|{{\boldsymbol{u}_f} - {\boldsymbol{u}_{p,i}}} |}}{{{r_p}}},\end{gather}
 \begin{gather}{C_d} = \frac{{24}}{{R{e_p}}}\left\{ {\begin{array}{*{20}{@{}ll}} {8.33\dfrac{{{\phi_p}}}{{{\phi_f}}} + 0.0972R{e_p}}&{\textrm{if}\;{\phi_f} < 0.8}\\ {{f_{base}} \cdot \phi_f^{ - \zeta }}&{\textrm{if}\;{\phi_f} \ge 0.8} \end{array}} \right., \end{gather}
 \begin{gather}{f_{base}} = \left\{ {\begin{array}{*{20}{@{}cl}} {1 + 0.167Re_p^{0.687}}&{\textrm{if}\;R{e_p} < 1000}\\ {0.0183R{e_p}}&{\textrm{if}\;R{e_p} \ge 1000} \end{array}} \right.,\end{gather}
 \begin{gather}\zeta = 3.7 - 0.65\ \textrm{exp}\left[ - {\textstyle{1 \over 2}}{(1.5 - {\log _{10}}R{e_p})^2}\right].\end{gather}
In (2.4)–(2.5), Cd is the dimensionless coefficient of the drag force, sg is the specific weight of individual particles and rp is the particle radius. For dense particle flows (ϕf < 0.8), (2.4) reduces to the original Ergun equation. Otherwise, Cd takes the form of Stokes's law multiplied by a factor of fbase, which varies with Rep, as indicated by (2.6) and (2.7).
The particle phase is represented by discrete parcels whose motion is governed by Newton's second law ((2.8) and (2.9))
 \begin{gather}\frac{{\textrm{d}{\boldsymbol{u}_{p,i}}}}{{\textrm{d}t}} = {D_{p,i}}({\boldsymbol{u}_f} - {\boldsymbol{u}_{p,i}}) - \frac{1}{{{\rho _p}}}\boldsymbol{\nabla }\langle {P_f}\rangle + \frac{1}{{{m_p}}}\sum\limits_j {{F_{C,ij}}} ,\end{gather}
 \begin{gather}\frac{{\textrm{d}\kern 0.06em {x_{p,i}}}}{{\textrm{d}t}} = {\boldsymbol{u}_{p,i}},\end{gather}
where up,i and xp,i denote the velocity and displacement of parcel i, respectively, and FC,ij represents the collision force between parcels i and j.
A four-way coupling strategy was adopted to account for the momentum and energy transfer between gases and particles. Specifically, the particle drag force and the associated work were incorporated into the momentum and energy equations of the gas phase as the source terms. The particle parcels are driven by the pressure gradient force, drag force and collision force between parcels (2.8). A soft sphere model, represented by a linear-spring dashpot model, was employed to model the collision force between parcels. Hence FC,ij consists of a repulsive force and a damping force
 \begin{equation}{\boldsymbol{F}_{C,ij}} = {k_{n,p}}{\boldsymbol{\delta }_n} - {\gamma _{n,p}}{\boldsymbol{u}_{n,ij}},\end{equation}
where kn,p and γn,p are the stiffness and damping coefficients of parcels, δn and un,ij are the overlap and normal velocity difference between parcels in contact; γn,p is a function of the parcel restitution coefficient εp
 \begin{equation}{\gamma _{n,p}} =- \frac{{2\,\textrm{ln}\,{\varepsilon _p}}}{{\sqrt {{{\rm \pi} ^2} + \textrm{ln}\,{\varepsilon _p}} }}\sqrt {{m_p}{k_{n,p}}} .\end{equation}
To solve the equations governing the gases, the weighted essentially non-oscillatory scheme was used to reconstruct the primary flow variables. A Riemann solver proposed by Harten, Lax and van Leer was used to obtain the intercell fluxes. The third-order Runge–Kutta method was applied to the time integration. The equations describing the parcel velocity and position were discretized by the velocity-Verlet algorithm. Bilinear/trilinear interpolation functions were adopted to calculate the particle volume fraction and source terms on the Eulerian grids, as well as the fluid variables on Lagrangian parcels (Liu, Osher & Chan Reference Liu, Osher and Chan1994). Numerical details with regard to CCFD-DPM can be found in our previous works (Tian et al. Reference Tian, Zeng, Meng, Chen, Guo and Xue2020).
The CCFD-DPM framework has been validated against several benchmark experiments involving shock driven particle laden flows (Tian et al. Reference Tian, Zeng, Meng, Chen, Guo and Xue2020), such as Rogue's experiments (Rogue et al. Reference Rogue, Rodriguez, Haas and Saurel1998) which investigate the shock dissipation through particle curtains, the experiments carried by Britan & Ben-Dor (Reference Britan and Ben-Dor2006), which access both the gaseous and solid pressures inside particle columns impinged head on by shocks and the experiments of shock induced interfacial instability of granular media (Xue et al. Reference Xue, Du, Shi, Gan and Bai2018). Specifically the CCFD-DPM-based simulations reproduce the characteristic expanding velocity and the signature finger-like jetting structure of the explosive dispersal, further validating the applicability of the CCFD-DPM method in investigating the explosive dispersal phenomena (Tian et al. Reference Tian, Zeng, Meng, Chen, Guo and Xue2020).
2.2. Numerical set-up
The two-dimensional numerical configuration is shown in figure 1(a) which has a high pressure gas pocket with the initial pressure P 0 and the radius of Rgas. The gas pocket is enclosed by a densely packed particle ring with inner and outer radii of Rin ,0 and Rout ,0, respectively. The volume fraction of particle ring ϕ 0 ranges from random loose packing ϕ 0,min = 0.5 to the random dense packing ϕ 0,max = 0.65. The annular particle ring domain is filled by computational parcels generated by the radius expansion algorithm (Yan, Hai-Sui & Glenn Reference Yan, Hai-Sui and Glenn2009). A population of parcels with artificially small radii that ensure no particle overlap is randomly created within the specified domain. Then, all parcels are expanded until the specified parcel size distribution and desired volume fraction are both satisfied. The real particle has a diameter of dp while the diameter of the parcel uniformly ranges from 0.75dp to 1.25dp to avoid potential crystallization during shock compaction. A random but homogenous arrangement of parcels is achieved as shown in the zoomed-in inset of figure 1(a) wherein the parcels are coloured by the local Voronoi volume fraction ϕp,voro. The parcel has a density of ρp same as the real particles.
(a) Two-dimensional numerical configuration of the explosive dispersal system (only one quarter of the configuration is shown). Distribution of the simulated dispersal systems in the parameter space (M/C, Egas) (b) and (dp, ρp) (c). The symbol size in (b) and (c) scales with the recurrence frequency of the corresponding parameter combination in all numerical cases.

For the simplified configuration shown in figure 1(a), the macroscale set of structural parameters includes the geometries of the central gas pocket and the particle ring, Rgas, Rin ,0 and Rout ,0, the gas pressure and temperature, P 0 and T 0, the total mass of particle ring,  ${m_{ring}} = {\rm \pi}{\rho _p}{\phi _0}(R_{out,0}^2 - R_{in,0}^2)$, etc. Both Rgas and P 0 contribute to the explosion energy of the gas pocket which can be approximated by the Brode equation (Crowl Reference Crowl2003)
 \begin{equation}{E_{gas}} = \frac{{({P_0} - {P_{amb}}){V_{gas}}}}{{\gamma - 1}} = \frac{{{\rm \pi} ({P_0} - {P_{amb}})R_{gas}^2}}{{\gamma - 1}},\end{equation}
where Vgas is the volume of the gas pocket, Pamb is the ambient pressure and γ is the ratio of specific heat. The mass ratio based on the masses of pressurized gases and the particle ring is given by
 \begin{equation}\textrm{M/C} = \frac{{{{\rm \pi} }(R_{out,0}^2 - R_{in,0}^2){\phi _0}{\rho _p}}}{{{{\rm \pi} }R_{gas}^2{\rho _{gas}}}} = \frac{{(R_{out,0}^2 - R_{in,0}^2){\phi _0}{\rho _p}R{T_0}}}{{R_{gas}^2{P_0}}}.\end{equation}
Since the particles in the CCFD-DPM method are modelled as smooth spheres, the surface roughness, the angularity and the material properties are difficult to account for. The microscale structure of the dispersal system is mainly embodied by the particle diameter and density, dp and ρp, both contributing to the inertia of the particle. Figure 1(b,c) shows the distributions of more than 140 numerical cases in the macro- and micro-scale parametric spaces, namely (Egas, M/C) and (dp, ρp) spaces, respectively. The symbol size in figure 1(b,c) scales with the recurrence frequency of the corresponding parameter combination in all numerical cases. Via varying the macroscale structural parameters, the M/C of numerical cases ranges from O(100) to O(104), spanning over five orders of magnitude. On the other hand, dp ranges from O(101) to O(102) μm while ρp ranges from O(101) to O(103). The vast variations in the macro- and microscale structural parameters fully expose the variability of the resulting dispersal behaviours which are normally prohibited by the experimental means. Exact values of the structural parameters in each numerical case are presented in table 1 in Appendix A. For clarity, the system is labelled by three symbols, M/C, −dp (in units of μm), − ρp (in units of kg m−3).
3. Numerical results
3.1. Macroscale disposal behaviour
In order to gain knowledge of the overall explosive dispersal behaviour of the particle ring, a space–time (r–t) diagram manifesting the spatio-temporal variations in particle volume fraction ϕp(r, t) was constructed using the circumferentially averaged ϕp. Figure 2(a–f) displays six typical r–t diagrams for systems with different combinations of macro- and microscale parameters. The inner and outer boundaries of the dispersed particle cloud denoted by the dotted lines are defined in such way that 90 % of particles are enclosed by the boundaries. The corresponding snapshots showing the positions of the dispersed particles at very late times are presented in figure 3(a–f).
The r–t diagrams of ϕp(r, t) for systems 9.7-100-2500 (a), 104-100-1503 (b), 159-100-2500 (c), 288-60-1503 (d), 1035-100-2500 (e), 2043-100-2500 (f). The inner and outer boundaries of particle clouds are denoted by dotted lines.

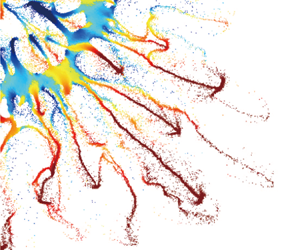
Positions of the dispersed particles at very late times for systems 9.7-100-2500 (a), 104-100-1503 (b), 159-100-2500 (c), 288-60-1503 (d), 1035-100-2500 (e), 2043-100-2500 (f). Particles are rendered according to the instantaneous velocities. Note that the colour ranging between yellow and dark red represents outbound velocities while the colour ranging between cyan and navy blue represents inbound velocities.

Figure 2(a) shows the most ideal dispersal which occurs at the lower limit of the M/C range. The particle ring undergoes a persistent expansion accompanied by substantial particle shedding from the inner surface, forming an annular particle cloud laden with uniformly distributed particles (figure 3a). The particle cloud becomes increasingly dilute as the volume swells until the momentum of particles is depleted by the drag forces. If the ring expansion is not fast enough, the innermost layers are susceptible to the negative central pressure due to the overexpansion of the central gases and eventually sucked into the centre, as seen in figure 2(b,c) (also see figure 3b,c). Hereafter, a negative pressure refers to a pressure below the ambient one, otherwise the pressure is positive.
As seen in figure 2(d–f), with increasing M/C, the persistent expansion of the ring is gradually taken over by the expansion–implosion pulsation which is compromised or even terminated by the intense particle shedding from both inner and outer surfaces of the ring. A variety of dispersal behaviours contrasting with the ideal dispersal emerge. For the system 288-60-1503, as shown in figure 2(d), the particle ring disintegrates during the first implosion, hurling a majority of particles towards the centre. These particles collide with each other and lose their momentum due to the frequent inelastic collisions. Eventually, most particles reside in the central region instead of being propelled out, resulting in an incomplete dispersal (figure 3d). Another unwanted dispersal outcome occurs when the ring disintegrates at the very moment the ring is about to implode (figure 2e) or the pulsating ring comes to rest in an equilibrium location (figure 2f). In these scenarios, a significant proportion of particles end up in an annular region near the initial location of the ring (see figure 3e,f) with finger-like jets bursting from the inner and outer surfaces, carrying away a fraction of particles. Hence, figure 2(e,f) demonstrates a highly incomplete and non-uniform dispersal.
Most engineering applications desire a uniformly distributed particle cloud via a complete explosive dispersal. The completeness of the explosive dispersal can be quantified by the proportion of particles which are eventually dispersed out, χ. The value of χ is derived by running the numerical experiments until the ring disintegrates or ceases to pulsate and finally tallying the outbound particles. The uniformity of the dispersed particle cloud is assessed by measuring the deviation of the mass centre radius of the actual particle cloud, Rmass, from that of the hypothetically homodispersed particle cloud, Rmass ,homo,  $\kappa = |{{R_{mass}} - {R_{mass,homo}}} |/{R_{mass,homo}}$. The values of Rmass and Rmass ,homo are calculated when the average particle volume fraction inside the region delimited by the inner and outer boundaries falls to 0.1. The mathematical definitions of χ, Rmass, Rmass ,homo and corresponding numerical procedures of equations are elaborated in Appendix B.
Figure 4(a,b) shows the variations in χ and κ with increasing M/C, respectively. The size of symbols scales with 1/dp, while the colour of the symbols is rendered according to ρp. The detectable dependences of χ and κ on M/C emerge from figure 4(a,b). As M/C increases from O(102) to O(104), χ decreases significantly while κ undergoes a substantial and non-convergent increase, indicating that the dispersal becomes increasingly incomplete and non-uniform beyond a M/C threshold of around O(102). It is worth noting that there exist significant variabilities in χ and κ among dispersal systems in the M/C range of O(102) to O(103) which have identical M/C but different ρp and dp. Specifically, the system 55-100-3506 yields an ideal dispersal with a close-to-unity χ and a minimum κ, χ = 0.99 and κ = 0.003. By contrast, the systems with larger but much lighter particles, systems 55-450-417 and 55-250-210, result in the incomplete and non-uniform dispersals with χ = 0.8 (system 55-450-417) and 0.3 (system 55-250-210), and κ = 0.06 (system 55-450-417) and 0.16 (system 55-250-210). The non-trivial influences on the dispersal behaviour brought by the microscale parameters will be accounted for in §§ 3.3 and 3.4.
Variations in χ and  $\kappa$ with increasing M/C. The symbol size scales with 1/dp. The colour of symbols is rendered according to ρp. The master curves with 80 % confidence intervals are superimposed in the plots. Symbols denoted as 1, 2, 3 correspond to systems 55-100-3506, 55-450-417, 55-250-210, respectively.

3.2. Macroscale gas–particle shell coupling
The overall explosive dispersal behaviour characterized by χ and κ is predominately dictated by the macroscale gas–particle coupling, as revealed in the previous study (Kun et al. Reference Kun, Lvlan, Jiarui, Chunhua and Baolin2023). Figure 5(a–f) presents the space–time (r–t) diagrams of the gaseous pressure fields, Pgas(r, t), for the systems shown in figure 2(a–f), wherein the circumferentially averaged Pgas is used to plot the r–t diagrams. We superimpose the inner and outer boundaries of the particle cloud (denoted by white dotted lines) as well as those of the dense core band (denoted by light yellow dashed lines) in figure 5. The dense core band remains densely packed, ϕdense ≥ 0.3, so that it suffices to effectively confine the central gases and maintain the pressure differential between the inner and outer boundaries. The disappearance of the dense core band signifies the complete disintegration of the particle ring.
The r–t diagrams of Pgas(r, t) for systems 9.7-100-2500 (a), 104-100-1503 (b), 159-100-2500 (c), 288-60-1503 (d), 1035-100-2500 (e), 2043-100-2500 (f). The inner and outer boundaries of particle clouds and dense core band are denoted by while dotted lines and light yellow dashed lines.

There are two characteristic events defining the evolution of the central pressure field enclosed by the inner surface of ring. The first is the multiple reflections of the shock waves and rarefaction fans between the centre and the inner surface, which is most prominent in early times, as shown in figure 5(a). All waves quickly attenuate as the ring rapidly expands. The overexpansion of the central gases takes over to dominate the gas dynamics, causing a drastic decline of the central pressure which eventually becomes negative. The resulting adverse pressure gradient, which is directed outwards, exerts inward pressure gradient forces on the particles. Thereby, the expanding ring decelerates. If the expanding ring completely disintegrates, particles in the inner layers may well reverse their motion and be sucked into the centre. The central gases gush out and quickly mix with the outside gases. In this scenario, a uniform pressure field is established (figure 5b,c). Otherwise, the dense core band eventually begins to implode, which in turn gives rise to the recovery of the central pressure and the rebuilding of a favourable pressure gradient field. In due time, the imploding dense core band will again reverse its motion and commence a second expansion. The synchronization between the central pressure fluctuation and the ring pulsation is termed macroscale gas–particle coupling which comes to an end when either the ring disintegrates (figure 5d,e) or the kinetic energy of the ring is damped away (figure 5f).
The sustainability of the macroscale gas–particle coupling in terms of the duration of the synchronization between the central gases and the enclosing ring, depends on three pivotal processes that occur on the macro-, meso- and microscale, as elaborated below. The first involves the initial momentum/energy transfer from the explosive source (central gases) to the enclosing ring. If the ring expansion is excessively fast, which occurs with small M/C, the central negative pressure field barely influences the dynamics of the ring, as shown in figure 5(a). The macroscale gas–particle coupling is short lived, only serving to provide the initial impetus to the particle ring. In this scenario, the time scale of the ring dynamics, which is defined as the time the ring takes to expand to twice the initial diameter, tring, is one order smaller than that of the pressure field, which is characterized by the time the central pressure takes to decrease to the ambient pressure, tgas, namely τmacro = tring/tgas ~ O(10−1). From figure 5(a–d), τmacro = 0.6, 1.2, 4.9, 12.5, indicating an improved compatibility between the ring dynamics and the gas evolution with increasing M/C. Note that τmacro does not exist for the systems 1034-100-2500 and 2043-100-2500 since the ring cannot expand to twice its initial diameter prior to the implosion.
3.3. Mesoscale gas–particle shell coupling
The initial momentum/energy transfer from the central gases to the particle ring occurs during the shock compaction phase which begins when the incident shock impinges on the inner surface of the ring and ends when the outer surface gains velocity. Two fundamental processes dominate the shock compaction, as schematized in figure 6(a,b). One is the transmission of blast loading exerted on the inner surface of the ring via the solid stresses arising from inter-particle contacts. The other is the inter-pore gas filtration driven by the pressure differential between the inner and outer surfaces of the ring. Alongside the inter-pore gas flows, a diffusional pressure field develops. Particles hence experience the pressure gradient forces and drag forces besides the solid stresses. All these forces together accelerate the particles and compact them to a compacted packing. Since the momentum/energy transportation is caused by the collective particle movements and inter-pore gas flows, the shock compaction is governed by the mesoscale gas–particle coupling.
Schematics of compaction wave propagation via inter-particle stresses (a) and gas filtration through pores in the granular packing (b) induced by the impingement of the incident shock.

While the particle ring gains the momentum, the interstitial gas flows cause substantial mass and energy losses of the central gases, thereby reducing the energy transferred to the ring. The resulting mass/energy reduction varies from system to system due to the distinctively different gas filtration. Figure 7 shows the early-time space–time (r–t) diagrams of ϕp (figure 7a,b), Pgas (figure 7c,d) and ugas (figure 7e,f) for systems 1035-50-1828 and 1035-800-1828. The trajectories of the compaction front (CF) and the diffusional pressure front (DPF) are superimposed on each panel in figure 7. The CF delineates the compacted particle packing. As the CF reaches the outer surface of the ring, the shock compaction phase is completed with the compacted ring acquiring an initial expansion velocity Vring. The distance of the DPF from the inner surface of the ring, LDPF = RDPF − Rin, characterizes the propagation depth of the transient diffusional pressure field whose determination is presented in Appendix C. For the system 1035-50-1828, the DPF propagates far slower than the CF, thereby there is no interstitial gas flowing out of the outer surface of the ring during the shock compaction phase (figure 7e). By contrast, the DPF distinctly precedes the CF in the system 1035-800-1828, inducing the intensified and persistent gas flows (figure 7f). Accordingly, the mass and energy losses mediated by the gas flowing out vary significantly. The mass ratios of gases retained in the central gas pocket after the shock compaction phase, χgas, are 96 % and 73 % for the systems 1035-50-1828 and 1035-800-1828, respectively. As expected, the ring in the system 1035-800-1828 gains a faster initial expanding velocity than that in the system 1035-50-1828, Vring, 1035-50-1828 = 8 m s−1, Vring, 1035-800-1828 = 5 m s−1.
Early-time space–time (r–t) diagrams of ϕp (a,b), Pgas (c,d) and ugas (e,f) for systems 1035-50-1828 (a,c,e) and 1035-800-1828 (b,d,f). The trajectories of the CF and the DPF are superimposed on each panel.

Since the mass and energy losses of the central gases are associated with the propagation velocity ratio between the DPF and the CF, τmeso = VDPF/VCF, if τmeso can be expressed as a function of structural parameters, the energy diminishing effect arising from the mesoscale gas–particle coupling can be estimated for a given dispersal system. The advance of the DPF depends on the velocity of the local interstitial gas flows relative to the solid skeleton, VDPF = ugas(RDPF) − usolid(RDPF). Ignoring the nonlinear terms, the interstitial gas flows can be accounted for by the Darcy equation, whose expression in polar coordinates is given by (3.1)
 \begin{equation}\varepsilon ({u_{gas}} - {u_{solid}}) =- \frac{k}{\mu }\frac{{\textrm{d}{P_{gas}}}}{{\textrm{d}r}},\end{equation}
where ε is the local porosity, μ is the dynamic viscosity of the interstitial gases and the permeability k is a function of the volume fraction ϕp described by the Ergun expression
 \begin{equation}k = \frac{1}{{150}}\frac{{{\varepsilon ^3}}}{{{{(1 - \varepsilon )}^2}}}d_p^2.\end{equation}
Thus, VDPF is proportionate to the local gradient of the transient diffusional pressure field at the DPF,  $(\textrm{d}{P_{gas}}/\textrm{d}r){|_{{R_{DPF}}}}$, which varies as the DPF advances. As a first order of approximation, we assume a linearly declining pressure field across the thickness of the ring, leading to an unvaried pressure gradient
 \begin{equation}\frac{{\textrm{d}{P_{gas}}}}{{\textrm{d}r}} =- \frac{{{P_5} - {P_{amb}}}}{{{h_{ring}}}},\end{equation}
where the initial pressure exerted on the inner surfaces of the ring is represented by the reflected pressure P 5 which is estimated by the normal shock wave relation with the initial pressure P 0. The ambient pressure Pamb represents the pressure exerted on the inner and outer surfaces of the ring. As a matter of fact, the central pressure decreases due to the expansion of the inner surface and the filtration induced mass flow out. Thus, the constant pressure assumption overestimates  $\textrm{d}{P_{gas}}/\textrm{d}r$, which is somewhat offset by replacing the actual propagation depth of the diffusional pressure field with the thickness of the ring. Substituting (3.2)–(3.3) into (3.1) and replacing ϕp with ϕ 0 to have
 \begin{equation}{V_{DPF}} = \frac{{d_p^2}}{{150}}\frac{{{{(1 - {\phi _0})}^2}}}{{\mu \phi _0^2}}\frac{{{P_5} - {P_{amb}}}}{{{h_{ring}}}}.\end{equation}
Equation (3.4) specifies the structural parameters affecting VDFP, including the macroscale parameters such as P 0, ϕ 0 and hring, as well as the microscale parameter dp. The time derivative of RDPF yields an absolute propagation velocity of the DPF in contrast with the relative velocity implied by the VDPF given in (3.4). Thus, we subtract the average particle velocity upon the DPF from the average RDPF to derive VDPF for numerical cases (details can be found in Appendix C). For the systems 1035-50-1828 and 1035-800-1828, the numerically derived VDPF are 2.3 and 606 m s−1, respectively, which agree well with the respective theoretical predictions given in (3.4), 2.6 and 658.2 m s−1.
As to the VCF, our previous work (Kun et al. Reference Kun, Lvlan, Jiarui, Chunhua and Baolin2023) proposed a shock compaction model accounting for the propagation of the CF in the particle packings driven by the diffusional pressure field. This model yields an adequate prediction of the VCF given in (3.5) for the densely packed granular column with the upstream and downstream pressure kept constant
 \begin{equation}{V_{CF}} = \sqrt {\frac{{{P_5} - {P_{amb}}}}{{{\rho _p}}}\frac{{{\phi _{comp}}}}{{({\phi _{comp}} - {\phi _0}){\phi _0}}}} ,\end{equation}
where ϕcomp is the maximum volume fraction reached by an assembly of particles with a certain size distribution, here ϕcomp = 0.7. Although the studied configuration has a divergent geometry and the pressure on the inner surface of the ring is unsteady, (3.5) still provides a reasonable estimation for the VCF. With (3.5), the systems 1035-50-1828 and 1035-800-1828 share the same VCF of 63.4 m s−1, compared with the respective numerical results, 64.8 and 54.2 m s−1.
Combining (3.4) and (3.5) we obtain the expression of τmeso as a function of a variety of structural parameters
 \begin{equation}\begin{array}{l} {\tau _{meso}} = \dfrac{{{V_{DPF}}}}{{{V_{CF}}}} = \dfrac{1}{{150}}\dfrac{{{{(1 - {\phi _0})}^2}}}{{\phi _0^2}} \cdot \sqrt {\dfrac{{({\phi _{comp}} - {\phi _0}){\phi _0}}}{{{\phi _{comp}}}}} \cdot \dfrac{{d_p^2\sqrt {({P_5} - {P_{amb}}){\rho _p}} }}{{\mu {h_{ring}}}}.\\ \end{array}\end{equation}
Figure 8 plots χgas for all systems with varying τmeso. The symbols are rendered according to the corresponding M/C. An explicit τmeso dependence of χgas is discernible as τmeso ranges from O(10−2) to O(101). At the lower limit of the τmeso range, τmeso ~ O(10−2), the filtration is far slower than the compaction. The value of χgas is close to unity, indicating a minimum gaseous mass flow out. A slightly downward slope of χgas emerges when the τmeso approaches O(100), the gas filtration beginning to drain the central gases. In the mid- and upper range, τmeso ~ O(100) − O(101), χgas rapidly decreases with increasing τmeso. The correlation between χgas and τmeso can be described by a fitting function
 \begin{align}
{\chi _{gas}} & = f(\textrm{lg}\,{\tau _{meso}}) =
0.0227{(\textrm{lg}\,{\tau _{meso}})^3} -
0.172{(\textrm{lg}\,{\tau _{meso}})^2}\notag\\
& \quad - 0.111\,\textrm{lg}\,{\tau _{meso}} + 0.933,{\tau
_{meso}}\sim O({10^{ - 2}}) - O({10^1}).
\end{align}
Variation in χgas with τmeso. symbols are rendered according to the corresponding M/C. A master curve fitted by a polynomial function with an 80 % confidence interval is superimposed in the plot.

Notably, χgas for systems at the lower limit of the investigated M/C range, M/C ~ O(101), exhibits non-trivial deviations from the fitting master curve. As revealed in the last section, the expansion of the ring in this M/C range is exceedingly fast so that the central pressure undergoes a drastic drop. The constant surface pressure assumption underpinning (3.4) and (3.5) does not hold. Thus, the correlation between χgas and τmeso can no longer be adequately described in (3.7). Since χgas is negligible (χgas > 92 %) in these cases, mainly thanks to the quite short duration of the shock compaction phase, we assume χgas = 1, ignoring the gas filtration altogether.
The gas filtration associated with the mesoscale gas–particle coupling reduces the effective mass in the central gas pocket, equivalent to an increased mass ratio,  $\textrm{M}/(\textrm{C} \cdot {\chi _{gas}}) = \textrm{M}/(\textrm{C} \cdot f(\textrm{lg}\,{\tau _{meso}}))$ whereby the influence of the mesoscale coupling on the dispersal is properly accounted for. Although the derivation of (3.7) is based on the simulation data, the τmeso dependence of the χgas can also be constructed via a theoretical model introduced in § 4.
3.4. Microscale gas–particle shell coupling
In contrast with the solid or liquid shells/rings, the particle shedding and the variations of volume fraction are inevitable throughout the dispersal of the particle shell/ring. Since the shed-off particles and particles in regions with very low ϕp (ϕp < 0.3) neither sustain persistent inter-particle contacts nor effectively confine the central gases, they cannot be regarded as part of the densely packed particle shell/ring. The actual particle ring whose pulsation synchronizes with the central pressure fluctuation hence has smaller mass than the initial one, equivalent to having a reduced M/C. Therefore, the particle shedding and localized pack loosening may well fundamentally change the dispersal behaviour. Since these events involve the individual particle dynamics, the resulting thinning of the effective particle ring embodies the microscale gas–particle coupling. In this section, we first explore the mechanism governing the particle shedding and pack loosening, then proceed to quantify the influence of these microscale processes on the overall dispersal and finally shed light on the outliers in figure 4(a).
The integrity of particle ring is maintained during the shock compaction phase and the incipient expansion phase when a favourable pressure gradient is imposed on the particles. The direction of the pressure gradient is soon reversed as the central pressure drops to a negative value. Figure 9(a,b) shows the radial profiles of the pressure and pressure gradient, Pgas(r) and  ${\nabla _r}{P_{gas}}(r)$, during the overexpansion phase of the central gases for the system 288-60-1503 whose r–t diagram of ϕp is shown in figure 2(d). The corresponding radial profiles of the particle velocity and volume fraction, up(r) and ϕp(r), are presented in figure 9(c,d), respectively. The substantial central pressure decline emanates expansion waves into the particle ring, unloading the compacted particles in the wake. The particles adjacent to the inner surface of the ring become so loosely packed (figure 9d) that no appreciable pressure gradient is built therein (figure 9b), inducing a dilute inner band. Meanwhile an outermost layer of the ring pells off when the CF reflects off the outer surface and transitions to an inward travelling rarefaction wave. Particles swept by the rarefaction wave are prone to breaking away from the outer surface, forming a shedding outer band. In between the dilute inner band and the shedding outer band there exists a densely packed core band whose ϕp(r) peaks at the band centre and this is denoted as
 $\textrm{B}{\textrm{C}_{{\phi _{max}}}}$ in figure 9(d) with the red dotted line. Meanwhile, an adverse pressure gradient field with the radial profile resembling that of ϕp(r) is established across the thickness of the dense core band. The amplitude of the inward pointing pressure gradient forces,
 $|{{F_{{\nabla_P}}}} |$, increases on approaching
 $\textrm{B}{\textrm{C}_{{\phi _{max}}}}$ and decreases on moving away from
 $\textrm{B}{\textrm{C}_{{\phi _{max}}}}$ as expressed in (3.8)
 \begin{equation}\left. {\begin{array}{*{20}{c@{}}} {|{{F_{\nabla P}}} |\sim 0,\quad r < {R_{dense,in}}\ \textrm{or}\ r > {R_{dense,out}},}\\ {\dfrac{{\partial |{{F_{\boldsymbol{\nabla }P}}} |}}{{\partial r}} > 0,\quad {R_{dense,in}} \le r < {R_{{\phi_{max}}}},}\\ {\dfrac{{\partial |{{F_{\boldsymbol{\nabla }P}}} |}}{{\partial r}} < 0,\quad {R_{{\phi_{max}}}} \le r \le {R_{dense,out}}.} \end{array}} \right\}\end{equation}
Where Rdense,in,  ${R_{{\phi _{max}}}}$ and Rdense,out represent the radii of the inner boundary, the centre (
 $\textrm{B}{\textrm{C}_{{\phi _{max}}}}$) and the outer boundary of the densely packed core band. The drag forces, Fdrag, which are proportionate to the pressure gradient forces in the dense packings, have identical radial profiles (Kun et al. Reference Kun, Lvlan, Jiarui, Chunhua and Baolin2023).
Variations in radial profiles of Pgas(r) (a),  ${\nabla _r}{P_{gas}}(r)$ (b), up(r) (c) and ϕp(r) (d) for the system 288-60-1503 during the overexpansion phase of central gases, 5.3 ms < t < 8.9 ms. The dotted lines in each plot from left to right represent the inner boundary of the particle cloud, the inner boundary of the dense core band, the band centre
 $\textrm{B}{\textrm{C}_{{\phi _{max}}}}$, the outer boundary of the dense core band and the outer boundary of the particle cloud, respectively. Typical radial profiles of
 ${\nabla _r}{P_{gas}}(r)$, up(r) and ϕp(r) are shown in (e).

Such distinctive profiles of  ${F_{{\nabla _P}}}$ and Fdrag result in a non-monotonic radial variation in up(r) (figure 9c,e). During the ring implosion phase, in the inner half of the dense core band (
 ${R_{dense,in}} \le r < {R_{{\phi _{max}}}}$), the absolute value of the up(r) increases with r. Particles in the outer layers tightly compress against those in the inner layers. Thereby, the inner half of the dense core band remains densely packed. By contrast, the absolute value of up(r) decreases with r in the outer half of the dense core band (
 ${R_{{\phi _{max}}}} \le r \le {R_{dense,out}}$), leading to a persistent pack loosening and eventually particle shedding. Notably, the imploding dense core band arrests the drifting particles in the dilute inner band, countering the particle shedding from the outer surface.
Figure 10 shows the temporal mass percentage of particles collected by the inner boundary of the dense core band, χadd(t), and those breaking loose from the outer boundary, χshed(t), during the ring implosion. The variation in the thickness of the dense core band, hdense(t), is also superimposed in figure 10. For the system 288-60-1503, the particle shedding effect always prevails over the particle collecting effect. The ring completely disintegrates when the former depletes the entire dense core band at  ${R_{{\phi _{max}}}} = 0.134$. In this scenario, a disastrous dispersal, where a majority of particles collapse into the centre, is observed.
Temporal variations in χadd(t), χshed(t) and hdense(t) during the ring implosion phase for the system 288-60-1503.

The ring thinning effect originating from the particle shedding depends on the dynamics of the ring as well as the individual particle. Specifically, particles of small inertia are more prone to reverse their motion and less likely to break loose compared with those of large inertia. On the other hand, a short-lived implosion of ring does not allow particles enough time to complete the motion reversal so that the ring sheds more severely than the long-lasting one. Thus, it is necessary to quantify the time scales of the ring implosion as well as the particle motion reversal.
Assuming an outbound particle with density of ρp and diameter of dp is about to reverse its motion driven by an inward directing pressure gradient force, the pressure gradient can be estimated by assuming a linear decline of pressure across the thickness of the ring, namely  $\boldsymbol{\nabla }P = {P_{amb}}/{h_{ring}}$. The characteristic time such a particle takes to reverse its motion is
 \begin{equation}{t_p} = \sqrt {\frac{{2{d_p}{h_{ring}}{\rho _p}}}{{{P_{amb}}}}} .\end{equation}
The derivation of tp is presented in Appendix D. Smaller tp is, the faster the outbound particle reverses to inbound and the less likely it is to break loose.
As seen from figure 2(e,f), the expansion–implosion cycle of the ring is semi-symmetric in terms of the duration and the amplitude as well. Hence, the time scale of the ring implosion can be approximated by that of the ring expansion introduced in § 3.2, namely the tring which is expressed in (3.10) under the assumption of a constant expansion velocity
 \begin{equation}{t_{ring}} = \frac{{{R_{out,0}}}}{{{V_{ring,Gurney}}}}.\end{equation}
The denominator in (3.10), Vring ,Gurney, is the estimation of Vring by a modified Gurney equation (Mo et al. Reference Mo, Lien, Zhang and Cronin2019) which accounts for the effect of the volume fraction ϕ 0 in addition to the structural parameters normally considered in a conventional Gurney equation
 \begin{gather}{V_{ring,Gurney}} = \sqrt {\frac{{2{e_{gas}}}}{{\dfrac{{\textrm{M/C}}}{{0.2\rho _p^{0.18}}} + 0.5}}} \cdot F({\phi _0},\textrm{M/C}),\end{gather}
 \begin{gather}F({\phi _0},\textrm{M/C}) = 1 + [0.162\,\textrm{exp}(1.127{\phi _0}) - 0.5] \cdot \textrm{lg}(\textrm{M/C}).\end{gather}
The egas in (3.11) is the explosion energy per unit mass of the central gases
 \begin{equation}{e_{gas}} = \frac{{{E_{gas}}}}{{{m_{gas}}}} = \frac{{({P_0} - {P_{amb}})R{T_0}}}{{(\gamma - 1){P_0}}} \simeq \frac{{R{T_0}}}{{(\gamma - 1)}}.\end{equation}
The ratio between tring and tp, τmicro = tring/tp, measures the importance of the microscale particle shedding relative to the macroscale ring implosion. Combining (3.9)–(3.13) leads to the expression of τmicro which is a function of both macroscale and microscale parameters
 \begin{gather}{\tau _{micro}} = {I_p}({d_p},{\rho _p}) \cdot {F_{macro}}(\textrm{M/C},{\rho _{gas}},{R_{out,0}},{h_{ring}},{\phi _0}),\end{gather}
 \begin{gather}{I_p} = \frac{1}{{d_p^{0.5}\rho _p^{0.5}}},\end{gather}
 \begin{gather}{F_{macro}} = \frac{{{R_{out,0}}}}{{2F({\phi _0},\textrm{M/C})}}\sqrt {\left( {\frac{{\textrm{M/C}}}{{0.2\rho_p^{0.18}}} + 0.5} \right)\frac{{{P_{amb}}}}{{{e_{gas}}{h_{ring}}}}} .\end{gather}
A smaller τmicro, or equivalently a larger 1/τmicro, indicates a longer particle motion reversal time relative to the entire implosion duration. Particles are more likely to remain outbound, breaking loose from the imploding ring. This argument is corroborated by the τmicro dependence of the cumulative volume fraction of shed particles at the end of the first ring implosion, χshed, shown in figure 11. Indeed, χshed significantly increases as τmicro decreases from O(102) to O(101). Once τmicro falls below 20, χshed converges to unity, indicating a complete falling apart of the ring during the first implosion. Notably, the symbols in figure 11 are rendered according to the respective M/C. A M/C dependence of τmicro is discernible in the mid- and upper range of the M/C, M/C ~ O(103) − O(104). Specifically, a larger M/C results in a higher τmicro, suggesting the ring thinning effect caused by the particle shedding becomes increasingly insignificant with increasing M/C.
The τmicro dependence of χshed. Symbols are rendered according to M/C. The master curve with an 80 % confidence interval is superimposed in the plot.

As seen in (3.14), τmicro is the product of a particle inertia related factor Ip (3.15) and a macroscale complex Fmacro (3.16) which is a function of the M/C and the ring geometry. Decreasing dp and/or ρp leads to an elevated Ip whereby τmicro increases. The particle mass loss caused by the particle shedding will be suppressed. Equivalently, the effective ring in motion is thicker than its counterpart with a smaller τmicro. The resulting dispersal behaviour resembles that with an amplified M/C. Figure 12 exhibits the r–t diagrams of ϕp for systems 55-100-3506 (figure 12a), 55-450-417 (figure 12b), 55-250-210 (figure 12c) which show worsening completeness and uniformity of dispersal, as first alluded to in § 3.1. These three systems have the same M/C, similar ring geometry but different dp and ρp, and thereby different Ip. As Ip decreases from 1.7 (dp = 100 μm, ρp = 3506 kg m−3) to 2.3 (dp = 450 μm, ρp = 417 kg m−3), then to 4.4 (dp = 250 μm, ρp = 210 kg m−3), the disintegration of the ring is significantly retarded and leads to a lower proportion of particles, χ = 0.99, 0.8, 0.3 for these three systems, respectively. This complete-to-incomplete dispersal transition caused by different microscale couplings is responsible for the bulk of the outliers in figure 4(a).
The r–t diagrams of ϕp for systems 55-100-3506 (a), 55-450-417 (b), 55-250-210 (c). The inner and outer boundaries of the particle clouds are denoted by white dashed lines.

3.5. Structure-dispersal correlation
The previous sections shed light on the multiscale gas–particle coupling relations underlying the varying explosive dispersal behaviours. The influences of the macro-, meso- and microscale coupling on the dispersal behaviour can be characterized via the parameter complex, M/C (2.13), τmeso (3.6) and τmicro (3.14), respectively. These non-dimensional complexes incorporate a range of macro- and microscale structural variables. The M/C plays a primary role in determining the overall dispersal performance in terms of χ and κ. The parameters τmeso and τmicro bring about the complementary but indispensable influences related to the mass reduction of gases and particles, respectively. In this section, we aim to construct a defining non-dimensional complex which adequately manifests the correlative effects arising from the M/C, τmeso and τmicro, thereby bridging the dispersal systems to the resulting dispersal performances.
An explicit τmeso dependence of χgas, χgas(τmeso) is established in § 3.3, as presented by (3.7), which is validated throughout the investigated M/C range except at the lower limit of the range, M/C ~ O(100 − 101). Beyond that range, the original M/C ought to be replaced by M/(C⋅χgas(τmeso)) to account for the influence of τmeso. As to τmicro, although it is clear that the diminishing mass of the particle ring in motion becomes stronger with a smaller τmicro, equivalent to having a reduced M/C, the exact correlation between them is beyond the scope of the present study. Thus, to incorporate the microscale coupling effect we tentatively modify the M/C by multiplying it by lg(τmicro). Finally, we construct a modified mass ratio, (M/C)*, which is formulized as
 \begin{equation}{(\textrm{M/C})^\ast } = \left\{ {\begin{array}{*{20}{@{}ll@{}}} {(\textrm{M/C}) \cdot \textrm{lg}({\tau_{micro}})}&{\textrm{(M/C)}\sim O({{10}^0} - {{10}^1})}\\ {\textrm{(M/C}) \cdot \dfrac{1}{{{\chi_{gas}}({\tau_{meso}})}} \cdot \textrm{lg}({\tau_{micro}})}&{\textrm{(M/C}) \ge O({{10}^1})} \end{array}} \right..\end{equation}
The correspondence between the M/C and (M/C)* for all systems is presented in figure 13. The size of the symbols scales with τmeso, while the colour of the symbols is rendered according to τmicro. Where the M/C is of the order of O(103), the (M/C)* is proportionate to the M/C as the effects of τmicro and τmeso are minimum. Otherwise in the lower- and mid-range of M/C, M/C ~ O(101) − O(102), the (M/C)* of systems with the upper limit of τmeso and/or the lower limit of τmicro significantly deviate from the scaling law.
Correlation between M/C and (M/C)*. The size of symbols scales with τmeso, while the colour of symbols is rendered according to τmicro.

Replacing the M/C with the (M/C)*, we replot figure 4(a,b) in figure 14(a,b). In contrast with the wide data variabilities shown in figure 4(a,b), the data converging into the master curves of χ((M/C)*) and κ((M/C)*) is substantially improved without apparent outliers, which corroborates the decisive role of (M/C)* in determining the dispersal characteristics. As seen in figure 14(a,b), the dispersal remains complete (χ ~ 1) and uniform (κ remains minimum), namely an ideal dispersal, until the (M/C)* is of the order of O(102). Thereafter, dispersal incompleteness quickly exacerbates as χ begins a sudden and substantial decline, where χ drops to below 0.5 over one decade of (M/C)*. Meanwhile, κ increases moderately. Accordingly, the explosive dispersal transitions from a complete and uniform one into an incomplete one with a non-trivial proportion of particles failing to disperse out. Regardless, particles in the dispersed particle cloud remain mostly uniformly distributed as suggested by the low value of κ (κ < 0.1). Thus, this dispersal mode is referred to as a partial dispersal. When the (M/C)* reaches the order of O(103) and beyond, the decreasing rate of χ significantly slows down, gradually approaching zero as (M/C)* approaches O(104). By contrast the growth rate of κ expedites, indicating a quickly worsening uniformity of dispersal. In this scenario the majority of particles dwell in a highly concentrated region, giving rise to a failed dispersal.
Variations in χ (a) and κ (b) with increasing (M/C)*. The size of symbols scales with the 1/dp, while the colour of symbols is rendered according to ρp.

4. Theoretical modelling
4.1. Criteria for the dispersal mode transition
As revealed in § 3.5, the dispersal mode transitions from ideal to partial then to failed as the (M/C)* increases from O(10−1) to O(104). The (M/C)* thresholds signifying the ideal-to-partial and partial-to-failed mode transitions are denoted as  $(\textrm{M/C})_{th,I}^\ast $ and
 $(\textrm{M/C})_{th,II}^\ast $, as marked in figure 14(a,b),
 $(\textrm{M/C})_{th,I}^\ast{\sim} 1 \times {10^2}$,
 $(\textrm{M/C})_{th,II}^\ast{\sim} 1 \times {10^3}$, respectively. Since the exact values of the
 $(\textrm{M/C})_{th,X}^\ast $ (X = I or II) are sensitive to the numerical models and parameter set-ups, the
 $(\textrm{M/C})_{th,X}^\ast $ (X = I or II) marked in figure 14(a,b) only serves as the reference rather than a guaranteed guide to predicting the dispersal mode. Instead of resorting to a single defining parameter, in this section we attempt to establish a theoretical model accounting for the entire ring dynamics resulting from a specific dispersal system. Combed with reasonable criteria for the dispersal mode transitions, the model allows for the prediction of the dispersal mode.
Firstly, the criterion for the ideal-to-partial dispersal mode transition is introduced. As discussed in § 3.2, in the ideal dispersal the time scale of the ring expansion is far smaller than that of the gas evolution, τmacro ~ O(10−1). Figure 15(a) shows the variation in τmacro with the (M/C)*. Indeed all systems with (M/C)* falling below  $(\textrm{M/C})_{th,I}^\ast $ satisfy this requirement. Thereafter τmacro increases to O(100), the time scale of the ring dynamics becoming comparable to that of the pressure evolution, leading to a vast number of particles being sucked into the centre by the negative central pressure. Therefore τmacro ~ O(10−1) serves as a requirement for an ideal dispersal.
Variations in τmacro (a) and ξimp (b) with the (M/C)*. Dark red symbols in (b) represent the semi-failed dispersal while light red symbols represent validated failed dispersal.

At the other end of the dispersal mode spectrum, a failed dispersal featuring sustained macroscale coupling requires a complete ring to implode at least once. The likelihood of the particle ring surviving a complete implosion depends on the thickness of the ring as well as the implosion distance. A thinner ring with a larger radius is less likely to survive a complete implosion (see figure 2c–f). Figure 15(b) plots the ratio between the thickness and the outer radius of the ring at the very moment of motion reversal (see the inset of figure 15b), ξimp = hdense,imp/Rdense,imp, for systems of the failed dispersal mode. The ring here refers to the dense core band introduced in § 3.4. The systems wherein the rings do not survive the first implosion are denoted by the dark red circles. Otherwise, the systems are denoted by the light red circles. Thereafter, these two groups of systems are referred to as the semi- and validated failed dispersal. The former clusters just below the  $(\textrm{M/C})_{th,II}^\ast $ while the latter is above the
 $(\textrm{M/C})_{th,II}^\ast $. Clearly, the ξimp of all the light red circles exceeds 0.1, thereby systems with ξimp > 0.1 suffice to predict a validated failed dispersal.
4.2. Continuum-based explosive dispersal model
The last section sets the criteria for the ideal and validated failed modes, namely τmacro ~ O(10−1) and ξimp > 0.1, respectively. To derive τmacro and ξimp, it is necessary to adequately reproduce two primary ring dynamics phases, namely the shock compaction and the ring pulsation phases, which are the focus of two sub-models. The shock compaction sub-model aims to account for CF which propagates through the thickness of the ring and couples with the transient interstitial gas flows, thereby estimating the kinetic energy imparted to the particle rings and the mass/energy loss of the central gases at the end of shock compaction. The final state of the shock compaction sub-model serves as the initial state of the following ring pulsation sub-model. The ring pulsation sub-model intends to yield the key dynamic parameters pertinent to the ring and central gases, such as tring, tgas, hdense,imp and Rdense,imp, whereby τmacro and ξimp are determined. A value of τmacro of the order of O(10−1) results in the ideal dispersal mode. Otherwise, ξimp is assessed sequentially. If ξimp > 0.1 holds, a validated failed dispersal is expected. Otherwise the resulting dispersal is either partial or semi-failed.
4.2.1. Evolution of central gases and gas filtration
Considering the configuration of the archetype shown in figure 1(a), wherein a circular central gas pocket with the initial radius Rin ,0 is filled with homogenous static gases with an initial pressure P 0 and density ρcentre ,0
 \begin{equation}{\rho _{center,0}} = \frac{{{P_0}}}{{\bar{R}{T_0}}},\end{equation}
where  $\bar{R}$ is the specific gas constant,
 $\bar{R} = 288.7\ \textrm{J}\ \textrm{k}{\textrm{g}^{ - 1}}\ {\textrm{k}^{ - 1}}$. The enclosing ring with the initial inner and outer radii of Rin ,0 and Rout ,0 comprises the compressible porous medium with the initial porosity ε 0 and the solid phase density ρsolid.
Throughout the shock compaction and the following ring pulsation phases, gases in the central gas pocket are allowed to flow out (the central pressure is positive) or flow in (the central pressure is negative) due to the inter-pore gas filtration which is governed by Darcy's law (3.1). The mass loss or gain rate of the central gases depends on the gas velocity on the inner surface of the ring relative to the moving inner surface
 \begin{equation}{\dot{m}_{gas}}(t) = 2{\rm \pi} {R_{in}} \cdot {\rho _{gas}}({R_{in}}) \cdot [{u_{gas}}({R_{in}}) - {V_{in}}] \cdot \varepsilon ({R_{in}}),\end{equation}
where ρgas(Rin), ugas(Rin) and ε(Rin) are the instantaneous interstitial gas density, gas velocity and the porosity on the inner surface of the ring, respectively, and Vin is the expanding velocity of the inner surface. Since the positive ugas directs outward, a positive the mass loss rate induces a negative mass gain rate. The instantaneous mass retained inside the central gas pocket is
 \begin{equation}{m_{gas}}(t) = {m_{gas,0}} - \int_0^t {2{\rm \pi} {R_{in}} \cdot {\rho _{gas}}({R_{in}}) \cdot [{u_{gas}}({R_{in}}) - {V_{in}}] \cdot \varepsilon ({R_{in}})\,\textrm{d}t} ,\end{equation}
where mgas ,0 =  ${\rm \pi}$R2in ,0⋅ρcentre ,0 is the initial mass of the central gases. The cumulative mass flux combined with the volumetric variation of the central gas pocket caused by the expansion or implosion of the ring collectively leads to the density evolution of the central gases
 \begin{equation}\begin{array}{ccccc} {\rho _{center}} & = \dfrac{{R_{in,0}^2}}{{R_{in}^2}}{\rho _{center,0}} - \int_0^t {\dfrac{{2{\rho _{gas}}({R_{in}})}}{{{R_{in}}}} \cdot [{u_{gas}}({R_{in}}) - {V_{in}}] \cdot \varepsilon ({R_{in}})\,\textrm{d}t} \\ & = \dfrac{{R_{in,0}^2}}{{R_{in}^2}}{\rho _{center,0}} + \int_0^t {\dfrac{{2{\rho _{gas}}({R_{in}})}}{{{R_{in}}}} \cdot \dfrac{k}{\mu }\boldsymbol{\nabla }{P_{{R_{in}}}}\,\textrm{d}t} . \end{array}\end{equation}
Assuming an isentropic expansion for the central gases gives
 \begin{equation}\frac{{{P_{center}}}}{{\rho _{center}^\gamma }} = \frac{{{P_0}}}{{\rho _{center,0}^\gamma }},\end{equation}
where γ is the specific heat ratio, γ = 1.4. Substituting (4.1) and (4.4) into (4.5) to derive the instantaneous central pressure, which is also the pressure exerted on the inner surface of the ring, Pgas(Rin) = Pcentre
 \begin{equation}{P_{gas}}({R_{in}}) = {P_{center}} = \frac{{{{\bar{R}}^\gamma }T_0^\gamma }}{{P_0^{\gamma - 1}}} \cdot {\left[ {\frac{{R_{in,0}^2}}{{R_{in}^2}}\frac{{{P_0}}}{{\bar{R}{T_0}}} + \int_0^t {\frac{{2{\rho_{gas}}({R_{in}})}}{{{R_{in}}}} \cdot \frac{k}{\mu }\boldsymbol{\nabla }{P_{{R_{in}}}}\,\textrm{d}t} } \right]^\gamma }.\end{equation}
As seen in (4.6), Pcenter depends on the ring dynamics and the gas filtration as well. The former dictates the volumetric variation of the central gas pocket via the variable Rin. The latter involves the dynamic flow parameters, ugas(Rin) and ρgas(Rin), which are incorporated into the Morrison equation in polar coordinates
 \begin{equation}\frac{{\partial (\varepsilon {P_{gas}})}}{{\partial t}} = \frac{{\partial \left( {\dfrac{k}{\mu }\dfrac{{\partial {P_{gas}}}}{{\partial r}}{P_{gas}}r - \varepsilon {u_{solid}}{P_{gas}}r} \right)}}{{r\partial r}},\end{equation}
where usolid is the velocity of the solid phase, Vin = usolid(Rin). The boundary conditions of (4.7) are set by the pressure on the inner and outer surfaces of the ring, Pgas(Rin) = Pcenter and Pgas(Rout) = Pamb. Since the evolution of the central gases (4.6), the gas filtration (4.7) and the ring dynamics are coupled together, their governing equations ought to be solved together.
4.2.2. Shock compaction sub-model
Upon the release of the pressurized central gases, a diffusional pressure field develops across the thickness of the ring and progresses outwards, as demonstrated in figure 16(a). Meanwhile, the interstitial gases start to flow, driven by the diffusional pressure field. The solid phase of the ring immersed in the advancing diffusional pressure field is subjected to the outward pressure gradient force  ${F_{{\nabla _P}}}$ and the associated drag force Fdrag, both of which scale with the local pressure gradient
 \begin{gather}{F_{\boldsymbol{\nabla }P}} =- \frac{{\textrm{d}{P_{gas}}/\textrm{d}r}}{{{\rho _{solid}}}},\end{gather}
 \begin{gather}{F_{drag}} = \frac{\varepsilon }{{1 - \varepsilon }}{F_{\boldsymbol{\nabla }P}} =- \frac{\varepsilon }{{1 - \varepsilon }}\frac{{\textrm{d}{P_{gas}}/\textrm{d}r}}{{{\rho _{solid}}}}.\end{gather}
Schematics of configuration considered in the theoretical model. (a) A CF has a finite thickness of wCF across which the porosity ε and solid velocity usolid gradually decrease. (b) Propagation of the CF with a velocity of VCF driven by  ${F_{{\nabla _P}}}$ and Fdrag. The radial profiles of ε(r), usolid(r),
 ${F_{{\nabla _P}}}(r)$ and Fdrag(r) are superimposed in the plots.

These forces compact the solid skeleton to a compacted band with a minimum porosity εmin, εmin = 1 − ϕcomp = 0.3 in the present study. The compacted band extends from the inner surface of the ring to a CF, as shown in figure 16(a). Ahead of the CF there exists a transitional zone with a finite thickness of wCF (wCF ~ 10dp) across which ε and usolid gradually decrease from εmin and usolid(RCF) to ε 0 and zero, respectively. To approximate the variations in ε and usolid inside the transitional zone, a Gauss error function is employed
 \begin{gather}\varepsilon (r) = 1 - \frac{{{\varepsilon _{min}} + {\varepsilon _0}}}{2} + \frac{{{\varepsilon _{min}} - {\varepsilon _0}}}{2} \cdot \textrm{erf}\left( {4\frac{{r - {R_{CF}}}}{{{w_{CF}}}}} \right),\quad {R_{CF}} \le r \le \textrm{ }{R_{CF}} + {w_{CF}},\end{gather}
 \begin{gather}{u_{solid}}(r) = \frac{{{u_{solid,CF}}}}{2} - \frac{{{u_{solid,CF}}}}{2} \cdot \textrm{erf}\left( {4\frac{{r - {R_{CF}}}}{{{w_{CF}}}}} \right),\quad {R_{CF}} \le r \le \textrm{ }{R_{CF}} + {w_{CF}},\end{gather}
 \begin{gather}\textrm{erf}(x) = \frac{2}{{\sqrt {\rm \pi}}}\int_0^x {{\textrm{e}^{ - {\eta ^2}}}\,\textrm{d}\eta } ,\end{gather}
where usolid,CF = usolid(RCF). The values of ε(r) and usolid(r) described in (4.10) and (4.11) agree well with the numerically derived profiles of ε and usolid as seen in figure 16(a). Thanks to the significant variation of the porosity, the flow dynamics of the interstitial gases undergoes fundamental changes when flowing through the transitional zone ahead of the CF. Thus, prior to resolving (4.7) it is necessary to determine the location of the CF, namely RCF(t), which is to be addressed below.
The momentum balance of the annular compacted band demonstrated in figure 16(b) is given by (4.13)
 \begin{align}
{\rho _{solid}}(1 - {\varepsilon
_{min}})\int_{{R_{in}}}^{{R_{CF}}}
{{{\dot{u}}_{solid}}(r)r\,\textrm{d}r} & =- {\rho
_{solid}}(1 - {\varepsilon
_0}){u_{solid,CF}}{V_{CF}}{R_{CF}}\notag\\ & \quad + {\rho
_{solid}}(1 - {\varepsilon
_{min}})\int_{{R_{in}}}^{{R_{CF}}} {{F_{\boldsymbol{\nabla
}P}}r\,\textrm{d}r} \notag\\ & \quad + {\rho _{solid}}(1 -
{\varepsilon _{min}})\int_{{R_{in}}}^{{R_{CF}}}
{{F_{drag}}r\,\textrm{d}r} ,
\end{align}
where  ${\dot{u}_{solid}}$ is the acceleration of the solid phase. The first term on the right-hand side of (4.13) accounts for the growing mass of the compacted band. The second and third terms on the right-hand side of (4.13) represent the total pressure gradient force and the total drag force exerted on the compacted band with a cross-section of unit area. The mass conservation of the incompressible compacted band requires that usolid is proportional to 1/r
 \begin{equation}{u_{solid}}(r) = \frac{{{V_{in}}{R_{in}}}}{r},\quad {R_{in}} \le r \le {R_{CF}},\end{equation}
where Vin is equal to the particle velocity herein, Vin = usolid(Rin). Differentiating (4.14) leads to the expression of  ${\dot{u}_{solid}}$
 \begin{equation}{\dot{u}_{solid}}(r) = \frac{{{{\dot{V}}_{in}}{R_{in}}}}{r} + \frac{{V_{in}^2}}{r} - \frac{{{{({V_{in}}{R_{in}})}^2}}}{{{r^3}}},\quad {R_{in}} \le r \le {R_{CF}}.\end{equation}
At the CF
 \begin{gather}{u_{solid,CF}} = \frac{{{V_{in}}{R_{in}}}}{{{R_{CF}}}},\end{gather}
 \begin{gather}{\dot{u}_{solid,CF}} = \frac{{{{\dot{V}}_{in}}{R_{in}}}}{{{R_{CF}}}} + \frac{{V_{in}^2}}{{{R_{CF}}}} - \frac{{{{({V_{in}}{R_{in}})}^2}}}{{R_{CF}^3}}.\end{gather}
The VCF and Vin ought to meet the Rankine–Huguenot condition
 \begin{equation}{V_{in}} = \frac{{{V_{CF}}{R_{CF}}}}{{{R_{in}}}}\left( {\frac{{{\varepsilon_0} - {\varepsilon_{min}}}}{{1 - {\varepsilon_{min}}}}} \right).\end{equation}
Equations (4.13)–(4.18) constitute the complete set of equations governing the shock compaction of the solid phase which is coupled with the evolution of the interstitial gas flows. Appendix E elaborates on the algorithm adopted to numerically solve those equations with the reference frame fixed on the inner surface of the ring.
4.2.3. Ring pulsation sub-model
Once the CF reaches the outer surface of the ring, the ring dynamics transitions to the ring pulsation synchronizing with the fluctuation of the central pressure. To predict tring, tgas, hdense,imp and Rdense,imp, we only need to reproduce the first expansion-to-implosion transition (EIT) of the ring. Since significant particle shedding occurs during the implosion, the ring before the first EIT is regarded as incompressible with an unvaried porosity, ε = εmin. The momentum balance of the ring as an entirety is expressed as
 \begin{align}
{\rho _{solid}}(1 - {\varepsilon
_{min}})\int_{{R_{in}}}^{{R_{out}}}
{r{{\dot{u}}_{solid}}\,\textrm{d}r} & = {\rho _{solid}}(1 -
{\varepsilon _{min}})\int_{{R_{in}}}^{{R_{out}}}
{{F_{\boldsymbol{\nabla }P}} \cdot r\,\textrm{d}r} \notag\\ &
\quad + {\rho _{solid}}(1 - {\varepsilon
_{min}})\int_{{R_{in}}}^{{R_{out}}} {{F_{drag}} \cdot
r\,\textrm{d}r} .
\end{align}
As in (4.13), the first and second terms on the right-hand side of (4.19) represent the total pressure gradient force and the total drag force exerted on the ring with a cross-section of unit area. The values of  ${F_{{\nabla _P}}}$ and Fdrag are described by (4.8) and (4.9), respectively.
Since the ring is incompressible, we have
 \begin{gather}\textrm{ }{u_{solid}}(r) = \frac{{{V_{in}}{R_{in}}}}{r},\quad {R_{in}} \le r \le {R_{out}},\end{gather}
 \begin{gather}{\dot{u}_{solid}}(r) = \frac{{{{\dot{V}}_{in}}{R_{in}}}}{r} + \frac{{V_{in}^2}}{r} - \frac{{{{({V_{in}}{R_{in}})}^2}}}{{{r^3}}},\quad {R_{in}} \le r \le {R_{out}}.\end{gather}
Integrating  ${\dot{u}_{solid}}$ from the inner to the outer surface of the ring leads to
 \begin{align}\int_{{R_{in}}}^{{R_{out}}}
{{{\dot{u}}_{solid}}r\,\textrm{d}r} &=
\int_{{R_{in}}}^{{R_{out}}} {\left(
{{{\dot{V}}_{in}}{R_{in}} + V_{in}^2 -
V_{in}^2\frac{{R_{in}^2}}{{{r^2}}}} \right)\textrm{d}r}\notag\\ &=
{\dot{V}_{in}}{R_{in}}({R_{out}} - {R_{in}}) +
V_{in}^2\frac{{{{({R_{out}} -
{R_{in}})}^2}}}{{{R_{out}}}}.\end{align}
Substituting (4.8), (4.9) and (4.22) into (4.19) reduces to
 \begin{align}({R_{out}} - {R_{in}}){\rho _{solid}}\left[ {{{\dot{V}}_{in}}{R_{in}} + V_{in}^2\left( {1 - \frac{{{R_{in}}}}{{{R_{out}}}}} \right)} \right] =- \frac{1}{{1 - {\varepsilon _{min}}}}\int_{{R_{in}}}^{{R_{out}}} {\textrm{d}{P_{gas}}/\textrm{d}r \cdot r\,\textrm{d}r} .\end{align}
Equations (4.20), (4.21) and (4.23) constitute the key governing equations of the ring dynamics in the ring pulsation sub-model. The evolution of the central gases and the gas filtration through the ring take place concurrently. The corresponding numerical algorithm is also presented in Appendix E.
4.3. Validation and applicability of the explosive dispersal model
Figure 17(a) compares the simulation derived and theoretically predicted trajectories of the inner and outer surfaces of the ring as well as the CF for the system 1035-50-1828. The consistencies between the numerical results and the theoretical predictions validate the capacity of the explosive dispersal model in terms of accounting for the ring dynamics. From figure 17(a) the theoretically predicted Vring, hdense,imp and Rdense,imp are identified,  $V_{ring}^{theo} = 9.2\ \textrm{m}\ {\textrm{s}^{ - 1}}$,
 $h_{dense,imp}^{theo} = 0.045\ \textrm{m}$ and
 $R_{dense,imp}^{theo} = 0.22\ \textrm{m}$, which agree well with their numerically derived counterparts since the derivation rates are 15 %, 24 %, 14 %, respectively. As to the gaseous evolution, the theoretical model also provides validated predictions of the central pressure evolution,
 $P_{center}^{num}(t)$, as well as the cumulative gaseous mass loss ratio,
 $\chi _{gas}^{num}(t)$, as shown in figure 17(b,c). The predicted time scale of central gases,
 $t_{gas}^{theo} = 5.68\ \textrm{ms}$, has a deviation rate of 0.14 %. Since the ring cannot expand to twice its initial diameter,
 $\tau _{macro}^{theo}$ approaches infinity, while
 $\xi _{imp}^{theo} = 0.2$, indicating a failed dispersal, which is consistent with the simulation results where the system 1035-50-1828 indeed produces a failed dispersal.
Simulation derived and theoretically predicted results for the system 1035-50-1828. (a) Trajectories of the inner and outer surfaces of the ring as well as the CF. (b) Central pressure evolution. (c) Cumulative gaseous mass loss ratio.

Besides the macroscale parameters, the model properly accounts for the mesoscale momentum/energy transportation, especially during the shock compaction phase. As shown in figure 18(a,b), the model reproduced well the diffusional pressure field Pgas(r, t) and the transient velocity field of solid phase usolid(r, t) that is observed in the simulation.
Comparisons of the simulation derived and theoretically predicted radial profiles of Pgas(r, t) (a) and usolid(r, t) (b) during the shock compaction phase for the system 1035-50-1828.

Figure 19 plots the numerically derived and theoretically predicted time scales of the ring (figure 19a),  $t_{ring}^{theo}$ and
 $t_{ring}^{num}$, as well as the time scales of the central gases (figure 19b),
 $t_{gas}^{theo}$ and
 $t_{gas}^{num}$, for all investigated systems. An overall consistency between
 $t_{ring}^{theo}$ and
 $t_{ring}^{num}$ is discernible, as is the case for
 $t_{gas}^{theo}$ and
 $t_{gas}^{num}$. Notably, the estimations of the time scale of the ring via the Gurney equation (3.10),
 $t_{ring}^{Gurney}$, are also supplemented in figure 19(a). Clearly, the consistency between
 $t_{ring}^{theo}$ and
 $t_{ring}^{num}$ is substantially improved compared with
 $t_{ring}^{Gurney}$, especially in the mid- and upper range of the (M/C)* wherein
 $t_{ring}^{theo}$ and
 $t_{ring}^{num}$ do not exist since the ring cannot expand to twice its initial radius prior to the EIT. The resulting
 $\tau _{macro}^{theo}$ for all systems are show in figure 19(c) in comparison with
 $\tau _{macro}^{num}$. All systems with
 $\tau _{macro}^{theo}\sim O({10^{ - 1}})$ indeed result in ideal dispersal since their actual
 $\tau _{macro}^{num}$ are of the order of O(10−1). Thereby the theoretical model can successfully identify the ideal dispersal.
Comparisons of the simulation derived and theoretically predicted tring (a), tgas (b), τmacro (c) and ξimp (d). Inset in (d) shows the results from the validated failed dispersal.

For systems with the order of  $\tau _{macro}^{theo}$ larger than O(10−1), ξimp is used to decide whether they are the validated failed mode. The theoretically predicted
 $\xi _{imp}^{theo}$ for all systems are plotted in figure 19(d) in comparison with
 $\xi _{imp}^{num}$. For the ideal and partial dispersal modes,
 $\xi _{imp}^{num}$ does not exist since the rings disintegrate prior to the first implosion. By contrast, the ring implosion always occurs in the theoretical model since the ring disintegration is not accounted for, yielding a finite
 $\xi _{imp}^{theo}$ for all systems. The overall (M/C)* dependence of
 $\xi _{imp}^{theo}$ is similar to that of
 $\xi _{imp}^{num}$. It is most noteworthy that the systems denoted by the light red circular symbols, which are guaranteed to result in a validated failed dispersal, all dwell in the domain of
 $\xi _{imp}^{theo}\; > 0.1$ (see the inset of figure 19d), indicating the theoretical model suffices to identify the validated failed mode.
5. Discussion
Although the explosive dispersal model can successfully identify the ideal and the validated failed dispersal, it becomes deficient in terms of discerning the partial and semi-failed dispersal. On the other hand, the (M/C)* dependences of χ and κ seem much less explicit in the semi-failed dispersal mode as seen in figure 20(a,b). The relatively wide variability of data indicates the deficiency of the (M/C)* in correlating the dispersal characteristics of the semi-failed dispersal. The origin of these two problems lies in the inadequacy of incorporating the microscale gas–particle coupling effect into neither the theoretical model nor the (M/C)*.
The (M/C)* dependences of χ (a) and κ (b) for systems resulting in the semi-failed dispersal.

As revealed in § 3.4, the microscale gas–particle coupling, which is manifested by the particle shedding and pack loosening, significantly influences the ring dynamics, especially the post-shock compaction phase. Accounting for these particle-scale events in a continuum-based theoretical model is quite challenging since the underlying physics is far from being well understood, let alone properly modelling these events. From the previous and present studies, several primary mechanisms contributing to these events are identified, such as the spalling of the outmost layer upon compaction wave reflection off the outer surface of the ring, the packing dilation caused by the inward and outward expansion waves, particle erosion due to the vortices deposited on the outer surface as well as the circumferential pressure variation due to the disturbed ring surface. Developing physics informed models for these processes and integrating them into the explosive dispersal model will be the focus of the follow-up study. Meanwhile, the various microscale gas–particle couplings should be characterized by respective non-dimensional parameters which embody the underlying physics. Potentially, it can help us to devise more comprehensive complex(es) which better bridge the dispersal systems and dispersal characteristics.
Another event requiring more attention is the multiple shock and expansion wave reflections between the centre and the inner surface of the ring at the incipient evolution of central gases. Figure 21(a,b,d) shows the r–t diagram of Pgas, up and the volumetric strain rate  ${\dot{\varepsilon }_{vol}}$ for the system104-100-2500 during the shock compaction phase, respectively. As each incident shock reflected from the centre impinges on the inner surface of the ring, a new CF begins to traverse the ring, as seen in figure 21(b,d). If the trailing CF does not catch up with the preceding one during the shock compaction phase, up(r) discontinues across each CF, as shown in figure 21(b). As a result, the ring becomes laminated when the inward expansion wave sweeps through the thickness of the ring. The separated outer layer quickly disintegrates, exposing the inner layer, as shown in the r–t diagram of ϕp during the entire dispersal (figure 21c). The ring lamination surely affects the subsequent ring dynamics, which needs to be properly addressed in the future study.
The r–t diagram of Pgas (a), up (b), ϕp (c) and  ${\dot{\varepsilon }_{vol}}$ (d) for the system104-100-2500. (a,b,d) Show the shock compaction phase while (c) shows a complete dispersal.

6. Conclusion
The present work sheds light on the multiscale mechanism governing a variety of explosive dispersal behaviours of particles which display distinctively different completeness and uniformity of dispersal. The macroscale gas–particle coupling depends on the initial impetus imparted on the particles by the explosive source, which underpins the characteristic of the resulting dispersal. The gas filtration arising from the mesoscale coupling drains the explosion energy available for the particles. The microscale coupling is manifested by the particle-scale events, specifically, the particle shedding and the pack loosening, which diminish the mass of the coherent ring in motion. The macro-, meso- and microscale gas–particle coupling combined plays a collective and decisive role in determining the dispersal modes. A non-dimensional modified mass ratio is proposed to incorporate multiscale coupling effects, whereby the dispersal modes are correlated with the dispersal systems consisting of macro- and microscale parameters. We proceed to develop a continuum-based explosive dispersal model which accounts for the macro- and mesoscale coupling. By properly reproducing the ring dynamics at the early stage, this model can successfully distinguish the dispersal systems which generate the ideal or validated failed dispersal.
Declaration of interests
The authors report no conflict of interest.
Appendix A. Details of parameters in each numerical case
Parameters in numerical cases.

Appendix B. Derivation of the completeness and uniformity of the explosive dispersal
In this appendix, the derivation of the completeness and uniformity of the explosive dispersal is illustrated. The completeness of the explosive dispersal is characterized by the parameter χ, which is derived by tallying the mass of particles with an outward radial velocity mu + and the total particle mass mring when the ring disintegrates or ceases to pulsate, χ = mu +/mring . For system 1014-100-2500 whose r–t diagram of ϕp is presented in figure 1(e), the ring ceases to pulsate after 30 ms. The distribution of dispersed particles at 50 ms is presented in figure 3(e). The mass of particles finally dispersed out (coloured in red) adds up to mu + = 11.33 kg, the total mass of all particles mring equals 30.63 kg. Combining mu + and mring brings us to χ = 0.37.
The uniformity of the dispersed particle cloud is characterized by the parameter  $\kappa = |{{R_{mass}} - {R_{mass,homo}}} |/{R_{mass,homo}}$ which assesses the deviation of the mass centre's radius of the actual particle cloud, Rmass, from that of the hypothetically homodispersed particle cloud, Rmass ,homo when the average ϕp inside particle cloud falls to 0.1. Considering the particle cloud with the inner and outer boundaries of Rin and Rout, the space within Rin and Rout is discretized into n concentric rings of same radial width ΔR, n = (Rout − Rin)/ΔR. The circumferentially averaged ϕp and radius of concentric rings i are denoted as ϕp ,i and R i respectively, obeying R i = Rin + (i − 1)ΔR. The values of Rmass and Rmass ,homo are calculated by (B1) and (B2) respectively,
 \begin{gather}{R_{mass}} = \frac{{\sum\limits_{i = 1}^n {[(R_i^2 - R_{i - 1}^2) \cdot {\phi _{R,i}} \cdot {R_i}]} }}{{\sum\limits_{i = 1}^n {[(R_i^2 - R_{i - 1}^2) \cdot {\phi _{R,i}}]} }},\end{gather}
 \begin{gather}{R_{mass,homo}} = \frac{{\sum\limits_{i = 1}^n {[(R_i^2 - R_{i - 1}^2) \cdot {R_i}]} }}{{R_{out}^2 - R_{in}^2}}.\end{gather}
For system 1014-100-2500, the particle distribution when the particle cloud obtains an average ϕp of 0.1 is shown in figure 22, where Rin = 0.065 m and Rout = 0.201 m are denoted by the blue solid lines. Adopting ΔR = 0.001 m, Rmass = 0.119 m and Rmass ,homo = 0.144 m are obtained from (B1) and (B2), respectively, and denoted by the red and blue dotted lines in figure 22. Finally  $\kappa = |{{R_{mass}} - {R_{mass,homo}}} |/{R_{mass,homo}} = 0.174$.
The particle distribution when the particle cloud obtains an average ϕp of 0.1 for system 1014-100-2500. The four circles from the inner corners outwards denote Rin, Rmass, Rmass,homo, Rout, respectively.

Appendix C. The determination of propagation depth of the transient diffusional pressure field
This appendix presents the determination of the propagation depth of DPF, including two methods working in different scenarios. For systems where the gaseous velocity exceeds zero before the arrival of the CF, the DPF precedes the CF. The DPF induces the perturbation of the gas pressure field, which can be traced by the flow field overpressure. Generally, where the overpressure is equal to 0.1 % of the reflection overpressure (θ = P 5 − Pamb) is considered to be the position of the DPF. So, the DPF could be tracked with the contour of 0.1% θ. For system 1014-800-1828, as shown in figure 7(f), the gaseous velocity exceeds zero before the arrival of the CF, suggesting a faster DPF than CF. In this case, the DPF can be traced with the contour of 0.1 %θ. The space–time (r–t) diagram of dimensionless flow field overpressure θ* for system 1014-800-1828 is showed in figure 22, which is converted from the space–time (r–t) diagrams of gaseous pressure Pgas of system 1014-800-1828, namely figure 7(d), with (C1)
 \begin{equation}{\theta ^\ast } = \frac{{P - {P_{amb}}}}{{{P_5} - {P_{amb}}}}.\end{equation}
In figure 23, the contour line of θ* is superimposed as the white line, with the contour line of 0.1 %θ* donated as the DPF.
The space–time (r–t) diagrams of dimensionless flow field overpressure θ* for system 1014-800-1828, superimposed on the contour lines of θ.

For systems where the gaseous velocity exceeds zero until the arrival of the CF, the DPF propagates slower than the CF. The CF brings disturbance to the gas pressure field, invalidating the method taken to determine the DPF for systems with a faster DPF than CF. Under this circumstance, the trajectory of the DPF corresponds to the trajectory of the fluid particle at the initial inner surface of the ring and can be traced with the space–time (r–t) diagrams of gaseous velocity, as illustrated in figure 24. The radial position of the fluid particle at time t can be expressed as
 \begin{equation}x = \int_0^t {{u_{gas}}\,\textrm{d}t} .\end{equation}
Where ugas denotes the velocity of the fluid particle that varies with time. Figure 7(e) shows the space–time (r–t) diagrams of gaseous velocity for system 1014-50-1828, where gaseous velocity exceeds zero until the arrival of CF, implying a slower DPF than CF. In this circumstance, the trajectory of DPF, which is denoted by the white dotted line in figure 7(e), is obtained from the gaseous velocity field combining (C2).
Schematic diagram of the fluid particle trace entering the particle ring from the inner surface when t = 0.

With the trajectory of DPF, the time when DPF arrives at outer edge of the ring tDPF is obtained, which serves to compute the average absolute velocity of interstitial gas flows, Vgas = (RDPF − Rin ,0)/tDPF. To gain VDFP, namely the velocity of the local interstitial gas flows relative to the solid skeleton, we continue to subtract the averaged particle velocity at DPF, Vsolid. Finally, VDFP = Vgas − Vsolid. The numerical results of Vgas(Vsolid) for the systems 1035-50-1828 and 1035-800-1828 are 9.8 m s−1 (7.5 m s−1) and 606 m s−1 (0 m s−1), respectively. So, the numerical results of VDPF for systems 1035-50-1828 and 1035-800-1828 are 2.3 and 606 m s−1, respectively.
Appendix D. Derivation of the characteristic time scale of an individual particle
The ring thinning effect is determined by the competition between the macroscale ring implosion and the microscale particle shedding, while the latter could be quantified with the time an individual particle takes to move its characteristic length scale, namely tp. In this appendix, we present a detailed account of the derivation of tp .
Considering an initially static particle with a volume of Vp. As the particle is inside the ring, it shares the same pressure gradient field with the ring. Assuming the pressure falls by 1 atm linearly across the thickness of the ring, the pressure gradient force applied to the individual particle could be estimated by (D1)
 \begin{equation}{F_{\boldsymbol{\nabla }P}} = \frac{{{P_{amb}}{V_p}}}{{{h_{ring}}}}.\end{equation}
Subjected to the pressure gradient force, the particle starts to move from static with the acceleration  ${a_p}$
 \begin{equation}{a_p} = \frac{{{F_{\boldsymbol{\nabla }P}}}}{{{V_p}{\rho _{solid}}}} = \frac{{{P_{amb}}{V_p}}}{{{h_{ring}}{V_p}{\rho _{solid}}}} = \frac{{{P_{amb}}}}{{{h_{ring}}{\rho _{solid}}}}.\end{equation}
Suppose the particle keeps a constant acceleration  ${a_p}$, so the movement distance x acts as a function of time t
 \begin{equation}\tfrac{1}{2}{a_p} \cdot {t_{}}^2 = {x_{}}. \end{equation}
Considering the particle diameter, dp, as the characteristic length scale of an individual particle, substituting x with dp, we obtain the time the particle takes to move its characteristic length scale
 \begin{equation}{t_p} = \sqrt {\frac{{2{d_p}{h_{ring}}{\rho _p}}}{{{P_{amb}}}}} .\end{equation}
Appendix E. Numerical solutions of the theoretical model
This appendix presents the numerical iterative algorithm of the shock compaction and ring pulsation models introduced in § 4.2. To distinguish the same variables in different models, subscripts c and p are applied to denote variables in the shock compaction and ring pulsation models, respectively. The superscript j represents the jth time step. Both of the models are constructed in the coordinate system fixed to the inner surface of the ring, with space discretized into nodes equally along the radial direction. The relative and absolute coordinate of node i at the jth time step is denoted as  $r_i^j$ and
 $R_i^j$, respectively, obeying
 $r_i^j = R_i^j - R_{in}^j$. Specially, for convenience, we adopt
 $r_{CF}^j(R_{CF}^j)$,
 $r_{out}^j(R_{out}^j)$ to denote the relative (absolute) coordinates of CF and outer radii, respectively. The value of
 $R_i^j$ ranges from 0 to
 $R_{out}^j$ to solve the evolution of the thermodynamic state of the central gases and the state of the particle ring.
For the shock compaction model, the initial condition (j = 0) corresponds to the impingement of the incident shock on the internal surface of the ring, leading to the following equations:
 \begin{equation}R_{CF,c}^0 = R_{in,c}^0.\end{equation}
The initial pressure distribution is described with (E2)
 \begin{equation}P_{gas,c}^0(r_{_{i,c}}^0) = \left\{ {\begin{array}{*{20}{l}} {P,}&{r_{i,c}^0 \le 0}\\ {{P_{amb}},}&{0 < r_{i,c}^0 \le r_{out,c}^j} \end{array}} \right..\end{equation}
Substituting (4.8–4.9), (4.15–4.16) and (4.18) into (4.13) leads to
 \begin{equation}\begin{array}{ccccc} & \left[ {\dot{V}_{in,c}^{j + 1}R_{in,c}^j + {{(V_{in,c}^j)}^2} - \dfrac{{{{(V_{in,c}^j)}^2}R_{in,c}^j}}{{R_{CF,c}^j}}} \right](R_{CF,c}^j - R_{in,c}^j)\\ & \quad =- \dfrac{{(1 - {\varepsilon _0})}}{{(1 - {\varepsilon _{min}})}}V_{in,c}^jR_{in,c}^jV_{CF,c}^j + \int_{R_{in,c}^j}^{R_{_{CF,c}}^j} { - \dfrac{{P_{gas,c}^j(R_{i + 1,c}^j) - P_{gas,c}^j(R_{i,c}^j)}}{{(1 - {\varepsilon _{min}}){\rho _{solid}}\mathrm{\Delta }r}}R_{i,c}^j\,\textrm{d}r} . \end{array}\end{equation}
Combining (E1) and (E3) to gain the initial absolute velocity of the internal surface
 \begin{equation}V_{in,c}^0 = \sqrt {\frac{{{P_0} - {P_{amb}}}}{{{\rho _{solid}}}}\frac{{({\varepsilon _0} - {\varepsilon _{min}})}}{{(1 - {\varepsilon _{min}})(1 - {\varepsilon _0})}}} ,\end{equation}
substituting  $V_{in,c}^0$ into (4.18) results to the initial absolute velocity of the CF
 \begin{equation}V_{CF,c}^0\textrm{ } = \sqrt {\frac{{({P_0} - {P_{amb}})}}{{{\rho _{solid}}}}\frac{{(1 - {\varepsilon _{min}})}}{{(1 - {\varepsilon _0})({\varepsilon _0} - {\varepsilon _{min}})}}} .\end{equation}
The initial absolute velocity of particle at CF is expressed by
 \begin{equation}u_{solid,CF}^0 = \frac{{V_{in,c}^0R_{in,c}^0}}{{R_{CF,c}^0}}.\end{equation}
In the compaction phase, generally, the ring is divided into three parts, namely the compacted band ( $0 < {r_{i,c}} < r_{CF,c}^0$), the transitional zone (
 $r_{CF,c}^0 < {r_{i,c}} < r_{CF,c}^0 + {w_{CF}}$) and the uncompacted band (
 $r_{CF,c}^0 + {w_{CF}} < {r_{i,c}} < r_{out,c}^0$). Particles within the compacted band hold εmin, while particles within the uncompacted region keep ε 0, between which, namely the transitional zone, the porosity there is approximated with the Gauss error function (4.10). As for the central gas region (
 ${r_{i,c}} < 0$), there exists no particle, so porosity there is set to 0.999 instead of unity to avoid a zero denominator when compute the permeability with (E8). To sum up, the initial porosity distribution is described as (E7)
 \begin{gather}\varepsilon _c^0(r_{i,c}^0) = \left\{ \begin{array}{l} 0.999,\quad r_{i,c}^0 < 0,\\ {\varepsilon_{min}},\quad 0 \le r_{i,c}^0 \le r_{CF,c}^0,\\ \dfrac{{{\varepsilon_{min}} + {\varepsilon_0}}}{2} - \dfrac{{{\varepsilon_0} - {\varepsilon_{min}}}}{2} \cdot \textrm{erf}\left( {4\dfrac{{r_{i,c}^0 - r_{CF,c}^0}}{{{w_{CF}}}}} \right),\quad r_{{i_{\textrm{CF},c}}}^0 \le r_{_{i,c}}^0 \le r_{CF,c}^0 + {w_{CF}},\\ {\varepsilon_0},\quad r_{CF,c}^0 + {w_{CF}} < r_{i,c}^0 \le r_{out,c}^0, \end{array} \right.\end{gather}
 \begin{gather}k_c^0(r_{i,c}^0) = \frac{1}{{150}}\frac{{{{[\varepsilon _c^0(r_{i,c}^0)]}^3}}}{{{{[1 - \varepsilon _c^0(r_{i,c}^0)]}^2}}}d_p^2,\quad r_{i,c}^0 \le r_{out,c}^0.\end{gather}
Similarly, the distribution of particle velocity is depicted with four piecewise functions as shown in (E9). The absolute velocity of particles within the compacted band ( $0 < {r_{i,c}} < r_{CF,c}^0$) is proportional to 1/R to ensure mass conservation (4.16); the velocity of particles inside the transitional zone (
 $r_{CF,c}^0 < {r_{i,c}} < r_{CF,c}^0 + {w_{CF}}$) are approximated with the Gauss error function (4.11); while particles within the uncompacted band (
 $r_{CF,c}^0 + {w_{CF}} < {r_{i,c}} < r_{out,c}^0$) remain static. Where there exists no particle (
 ${r_{i,c}} < 0$), the absolute particle velocity is set to zero, resulting in a negative relative particle velocity. In summary, the initial relative particle velocity distribution is described as (E9)
 \begin{align}U_{solid,c}^0(r_{i,c}^0) = \left\{ \begin{array}{l} - V_{in,c}^0,\quad r_{i,c}^0 < 0,\\ \dfrac{{V_{in,c}^0R_{in,c}^0}}{{R_{i,c}^0}} - V_{in,c}^0,\quad 0 \le r_{i,c}^0 \le r_{CF,c}^0,\\ \dfrac{{u_{solid,CF}^0}}{2} - \dfrac{{u_{solid,CF}^0}}{2} \cdot \textrm{erf}\left( {4\dfrac{{r_{i,c}^0 - r_{CF,c}^0}}{{{w_{CF}}}}} \right) - V_{in,c}^0,\quad r_{CF,c}^0 \le r_{_{i,c}}^0 \le r_{CF,c}^0 + {w_{CF}},\\ - V_{in,c}^0,\quad r_{CF,c}^0 + {w_{CF}} < r_{i,c}^0 \le r_{out,c}^0. \end{array} \right.\end{align}
Below, the time marching scheme for the shock compaction model is presented. Here,  $R_{in,c}^{\; j + 1}(R_{CF,c}^{\; j + 1})$ is updated using
 $R_{in,c}^{\; j}(R_{CF,c}^{\; j})$ and
 $V_{in,c}^{\; j}(V_{CF,c}^{\; j})$, as described in (E10) and (E11)
 \begin{gather}R_{in,c}^{j + 1} = R_{in,c}^j + V_{in,c}^j \cdot \mathrm{\Delta }t,\end{gather}
 \begin{gather}R_{CF,c}^{j + 1} = R_{CF,c}^j + V_{CF,c}^j \cdot \mathrm{\Delta }t.\end{gather}
The absolute coordinate is transformed into relative coordinate with (E12)
 \begin{equation}r_i^{j + 1} = R_i^{j + 1} - R_{in}^{j + 1}.\end{equation}
Specially, the relative coordinates of the inner surface and CF are expressed by
 \begin{gather}r_{in,c}^{j + 1} = 0,\end{gather}
 \begin{gather}r_{CF,c}^{j + 1} = r_{CF,c}^j + (V_{CF,c}^j - V_{in,c}^j) \cdot \mathrm{\Delta }t,\end{gather}
where Δt is a sufficiently small interval of time estimated by the time required for the CF to reach the external surface in the simulation. With updated  $R_{in,c}^{\; j + 1}$ and
 $R_{CF,c}^{\; j + 1}$, similar to the derivation of (E7), the porosity distribution is updated with (E15)
 \begin{equation}\varepsilon _c^{j + 1}(r_{i,c}^{j + 1}) = \left\{ \begin{array}{l} 0.999,\quad r_{i,c}^{j + 1} < 0,\\ {\varepsilon_{min}},\quad 0 \le r_{i,c}^{j + 1} \le r_{CF,c}^{j + 1},\\ \dfrac{{{\varepsilon_{min}} + {\varepsilon_0}}}{2} - \dfrac{{{\varepsilon_0} - {\varepsilon_{min}}}}{2} \cdot \textrm{erf}\left( {4\dfrac{{r_{i,c}^{j + 1} - r_{CF,c}^{j + 1}}}{{{w_{CF}}}}} \right),\quad r_{CF,c}^{j + 1} < r_{i,c}^{j + 1} \le r_{CF,c}^{j + 1} + {w_{CF}},\\ {\varepsilon_0},\quad r_{CF,c}^{j + 1} + {w_{CF}} < r_{i,c}^{j + 1} \le r_{out,c}^{j + 1}. \end{array} \right.\end{equation}
The permeability is correspondingly updated with (E16)
 \begin{equation}k_c^{j + 1}\left(r_{i,c}^{j + 1}\right) = \frac{1}{{150}}\frac{{{{\left[\varepsilon _c^j\left(r_{i,c}^{j + 1}\right)\right]}^3}}}{{{{\left[1 - \varepsilon _c^j\left(r_{i,c}^{j + 1}\right)\right]}^2}}}d_p^2,\quad r_{i,c}^{j + 1} \le r_{out,c}^{j + 1}.\end{equation}
The discrete scheme of the (4.5) is shown in (E17), where the first-order backward difference is applied to the time term and the central difference at half-nodes (i − 1/2 and i + 1/2) is used for the space term
 \begin{gather}P_{gas,c}^{j + 1}\left(r_{i,c}^{j + 1}\right) = \frac{{[\left(A - B\right) \cdot \textrm{d}t + C]}}{{\varepsilon _c^{j + 1}\left(r_{i,c}^{j + 1}\right)}},\quad 0 < r_{i,c}^{j + 1} < r_{out,c}^{j + 1},\end{gather}
 \begin{gather}\begin{aligned} A & =
\dfrac{{k_c^j\left(r_{i + 1/2,c}^{j +
1}\right)P_{gas,c}^j\left(r_{i + 1/2,c}^{j + 1}\right)r_{i
+ 1/2,c}^{j + 1}\dfrac{{P_{gas,c}^j\left(r_{i + 1,c}^{j +
1}\right) - P_{gas,c}^j\left(r_{i,c}^{j +
1}\right)}}{{\mathrm{\Delta }r}}}}{{\mu r_{i,c}^{j +
1}\mathrm{\Delta }r}}\\ & \quad - \dfrac{{k_c^j\left(r_{i -
1/2,c}^{j + 1}\right)P_{gas,c}^j\left(r_{i - 1/2,c}^{j +
1}\right)r_{i - 1/2,c}^{j +
1}\dfrac{{P_{gas,c}^j\left(r_{i,c}^{j + 1}\right) -
P_{gas}^j\left(r_{i - 1,c}^{j + 1}\right)}}{{\mathrm{\Delta
}r}}}}{{\mu r_{i,c}^j\mathrm{\Delta }r}},
\end{aligned}\end{gather}
 \begin{gather}B = \frac{{\begin{array}{@{}c@{}}\varepsilon
_c^j\left(r_{i + 1/2,c}^{j + 1}\right)P_{gas,c}^j\left(r_{i + 1/2,c}^{j +
1}\right)U_{solid,c}^j\left(r_{i + 1/2,c}^{j + 1}\right)r_{i + 1/2,c}^{j +
1}\\ - \varepsilon _c^j\left(r_{i - 1/2,c}^{j +
1}\right)P_{gas,c}^j\left(r_{i - 1/2,c}^{j + 1}\right)U_{solid,c}^j\left(r_{i -
1/2,c}^{j + 1}\right)r_{i - 1/2,c}^{j +
1}\end{array}}}{{r_{i,c}^j\mathrm{\Delta }r}},\end{gather}
 \begin{gather}C = \varepsilon _c^j\left(r_{i,c}^{j + 1}\right)P_{gas,c}^j\left(r_{i,c}^{j + 1}\right).\end{gather}
The variables at half-nodes (i − 1/2, i + 1/2) are calculated with the values of side nodes as shown in (E18)–(E21)
 \begin{gather}k_c^j\left(r_{i - 1/2}^j\right) = \frac{{2k_c^j\left(r_{i - 1,c}^j\right) \cdot k_c^j\left(r_{i,c}^j\right)}}{{k_c^j\left(r_{i - 1,c}^j\right) + k_c^j\left(r_{i,c}^j\right)}},\quad k_c^j\left(r_{i + 1/2}^j\right) = \frac{{2k_c^j\left(r_{i + 1,c}^j\right) \cdot k_c^j\left(r_{i,c}^j\right)}}{{k_c^j\left(r_{i + 1,c}^j\right) + k_c^j\left(r_{i,c}^j\right)}}, \end{gather}
 \begin{gather}\varepsilon _c^j\left(r_{i - 1/2,c}^j\right) = \frac{{2\varepsilon _c^j\left(r_{i - 1,c}^j\right) \cdot \varepsilon _c^j\left(r_{i,c}^j\right)}}{{\varepsilon _c^j\left(r_{i - 1,c}^j\right) + \varepsilon _c^j\left(r_{i,c}^j\right)}},\quad \varepsilon _c^j\left(r_{i + 1/2,c}^j\right) = \frac{{2\varepsilon _c^j\left(r_{i + 1,c}^j\right) \cdot \varepsilon _c^j\left(r_{i,c}^j\right)}}{{\varepsilon _c^j\left(r_{i + 1,c}^j\right) + \varepsilon _c^j\left(r_{i,c}^j\right)}},\end{gather}
 \begin{gather}P_{gas,c}^j\left(r_{i -
1/2,c}^j\right) = \frac{{P_{gas,c}^j\left(r_{-1,c}^j\right) +
P_{gas,c}^j\left(r_{i,c}^j\right)}}{2},\notag\\
P_{gas,c}^j\left(r_{i + 1/2,c}^j\right) =
\frac{{P_{gas,c}^j\left(r_{i,c}^j\right) +
P_{gas,c}^j\left(r_{i + 1,c}^j\right)}}{2},\end{gather}
 \begin{gather}U_{solid,c}^j\left(r_{i -
1/2,c}^j\right) = \frac{{U_{solid,c}^j\left(r_{i -
1,c}^j\right) + U_{solid,c}^j\left(r_{i +
,c}^j\right)}}{2},\notag\\ U_{solid,c}^j\left(r_{i +
1/2,c}^j\right) =
\frac{{U_{solid,c}^j\left(r_{i,c}^j\right) +
U_{solid,c}^j\left(r_{i + 1,c}^j\right)}}{2}.\end{gather}
The pressure on the outer surfaces of the ring satisfies the boundary condition
 \begin{equation}P_{gas,c}^{j + 1}\left(r_{out,c}^{j + 1}\right) = {P_{amb}}.\end{equation}
Considering the volumetric increase in the gas pocket and the mass outflow due to the infiltration effect, we update  $\rho _{center,c}^{\; j}$ with (E23)
 \begin{align}\rho _{center,c}^{j + 1} = \rho _{center,c}^j\frac{{{{\left(R_{in,c}^j\right)}^2}}}{{{{\left(R_{in,c}^{j + 1}\right)}^2}}} + 2\frac{{\rho _{center,c}^jk_c^j\left(r_{0,c}^j\right)}}{{\mu R_{in,c}^j}}\left( {\frac{{P_{gas,c}^j\left(r_{1,c}^j\right) - P_{gas,c}^j\left(r_{0,c}^j\right)}}{{\Delta r}}} \right)\Delta t.\end{align}
Assuming an isentropic expansion for the central gases, we update the inner pressure with  $\rho _{center,c}^{\; j + 1}$
 \begin{equation}P_{gas,c}^{j + 1}\left(r_{i,c}^{j + 1}\right) = \frac{{{P_0}}}{{{{\left(\rho _{center,0}^0\right)}^\gamma }}}{\left(\rho _{center,c}^{j + 1}\right)^\gamma },\quad r_{i,c}^{j + 1} \le 0.\end{equation}
Substituting  $P_{gas,c}^{j + 1}$,
 $R_{in,c}^{j + 1}$,
 $R_{CF,c}^{j + 1}$,
 $V_{in,c}^j$,
 $V_{CF,c}^j$ into (E25) to update the acceleration of the internal surface
 \begin{align}
\dot{V}_{in,c}^{j + 1} & =- \dfrac{{\left(1 - {\varepsilon
_0}\right)}}{{\left(1 - {\varepsilon
_{min}}\right)}}\dfrac{{V_{in,c}^jV_{CF,c}^j}}{{\left(R_{CF,c}^{j + 1}
- R_{in,c}^{j + 1}\right)}}\notag\\ & \quad +
\dfrac{{\int_{r_{_{0,c}}^{j + 1}}^{r_{_{CF,c}}^{j + 1}} { -
[{P_{gas,c}^{j + 1}\left(r_{i + 1,c}^{j + 1}\right) -
P_{gas,c}^j\left(r_{i,c}^{j + 1}\right)} ]R_i^{j + 1}\,\textrm{d}r}
}}{{\left(R_{CF,c}^{j + 1} - R_{in,c}^{j + 1}\right)R_{in,c}^{j +
1}\left({1 - {\varepsilon_{\min }}} \right){\rho _{solid}}\Delta r}} +
\dfrac{{{{\left(V_{in,c}^j\right)}^2}}}{{R_{CF,c}^{j + 1}}} -
\dfrac{{V_{in,c}^j}}{{R_{in,c}^{j + 1}}}.
\end{align}
The parameter  $\dot{V}_{in,c}^{j + 1}$ in turn serves to update
 $V_{in}^{j + 1}$
 \begin{equation}V_{in,c}^{j + 1} = V_{in,c}^j + \dot{V}_{in,c}^{j + 1} \cdot \Delta t.\end{equation}
Here,  $V_{CF,c}^{j + 1}$ satisfies the Rankine–Huguenot condition (4.18) and is updated by (E27)
 \begin{equation}V_{CF,c}^{j + 1} = \frac{{V_{in,c}^{j + 1}R_{in,c}^{j + 1}}}{{R_{CF,c}^{j + 1}}}\left( {\frac{{1 - {\varepsilon_{min}}}}{{{\varepsilon_0} - {\varepsilon_{min}}}}} \right).\end{equation}
The parameter  $u_{solid,CF}^{j + 1}$ meets (E28)
 \begin{equation}u_{solid,CF}^{j + 1} = \frac{{V_{in,c}^{j + 1}R_{in,c}^{j + 1}}}{{R_{CF,c}^{j + 1}}}.\end{equation}
Analogous to the (E9),  $V_{in,c}^{j + 1}$ and
 $u_{solid,CF}^{j + 1}$ are used to update the distribution of absolute particle velocity as shown in (E29)
 \begin{equation}U_{solid,c}^{j + 1}(r_{i,c}^{j + 1}) = \left\{ \begin{array}{@{}l@{}} - V_{in,c}^{j + 1},\quad r_{i,c}^{j + 1} < 0\\ \dfrac{{V_{in,c}^{j + 1}R_{in,c}^{j + 1}}}{{R_{i,c}^{j + 1}}} - V_{in,c}^{j + 1},\quad 0 \le r_{i,c}^{j + 1} \le r_{CF,c}^{j + 1}\\ \dfrac{{u_{solid,CF}^{j + 1}}}{2} - \dfrac{{u_{solid,CF}^{j + 1}}}{2} \cdot \textrm{erf}\left( {4\dfrac{{r_i^{j + 1} - R_{CF,c}^{j + 1}}}{{{w_{CF}}}}} \right) - V_{in,c}^{j + 1},\quad r_{CF,c}^{j + 1} < r_{i,c}^{j + 1} \le r_{CF,c}^{j + 1} + {w_{CF}}\\ V_{in,c}^{j + 1},\quad r_{CF,c}^{j + 1} + {w_{CF}} < r_{i,c}^{j + 1} \le r_{out,c}^{j + 1} \end{array} \right..\end{equation}
Equations (E10)–(E29) are solved iteratively until the CF arrives at the external surface,  $R_{CF,c}^{{j_{comp}}} = R_{out}^0$, where jcomp represents the end time step of the shock compaction model.
The thermodynamic state of the central gases and the state of the particle ring at tcomp sets the initial conditions for the ring pulsation model
 \begin{align}\left. {\begin{array}{*{20}{@{}c@{}}} {P_{gas,p}^0 = P_{gas,c}^{{j_{comp}}},\quad \rho_{center,p}^0 = \rho_{center,c}^{{j_{comp}}},\quad R_{in,p}^0 = R_{in,c}^{{j_{comp}}},\quad R_{out,p}^0 = {R_{out,0}},\quad U_{solid,p}^0 = U_{solid,c}^{{j_{comp}}},}\\ {V_{in,p}^0 = V_{in,c}^{{j_{comp}}},\quad V_{out,p}^0 = V_{in,c}^{{j_{comp}}}{R_{out,0}}/R_{in,c}^{{j_{comp}}},\quad \varepsilon_p^0 = \varepsilon_\textrm{c}^{{j_{comp}}},\quad k_p^0 = k_c^{{j_{comp}}}.} \end{array}} \right\}\end{align}
Below, the time marching scheme for the ring pulsation model is presented. Here,  $R_{in,p}^{j + 1}$ (
 $R_{out,p}^{j + 1}$) is updated with
 $R_{in,p}^j$ (
 $R_{out,p}^j$) and
 $V_{in,p}^j$ (
 $V_{out,p}^j$), as described in (E31)–(E32)
 \begin{gather}R_{in,p}^{j + 1} = R_{in,p}^j + V_{in,p}^j \cdot \Delta t,\end{gather}
 \begin{gather}R_{out}^{j + 1} = R_{out}^j + V_{out}^j \cdot \Delta t.\end{gather}
The absolute coordinate is transformed into relative coordinate with (E33)
 \begin{equation}r_{i,p}^j = R_{i,p}^j - R_{in,p}^j.\end{equation}
Specially, the relative coordinates of inner and outer surfaces are expressed by
 \begin{gather}r_{in,c}^{j + 1} = 0,\end{gather}
 \begin{gather}r_{out,p}^{j + 1} = r_{out,p}^j + (V_{out,p}^j - V_{in,p}^j) \cdot \Delta t.\end{gather}
The porosity of the ring keeps εmin due to the assumption of an incompressible ring and mass conservation. The porosity of the central gas region ( $r_{i,p}^0 < 0$) is set to 0.999 instead of unity to avoid a zero denominator. Substituting
 $r\; _{out,p}^{j + 1}$ into (E36) to update
 $\varepsilon _p^{j + 1}$, we in turn update the permeability with (E37)
 \begin{gather}\varepsilon _p^{j + 1} = \left\{ \begin{array}{@{}l@{}} 0.999,\quad r_{i,p}^{j + 1} < 0\\ {\varepsilon_{min}},\quad 0 \le r_{i,p}^{j + 1} \le r_{out,p}^{j + 1} \end{array} \right.,\end{gather}
 \begin{gather}k_p^{j + 1}(r_{i,p}^{j + 1}) = \frac{1}{{150}}\frac{{{{\left[\varepsilon _p^{j + 1}r_{i,p}^{j + 1}\right]}^3}}}{{{{\left[1 - \varepsilon _p^{j + 1}\left(r_{i,p}^{j + 1}\right)\right]}^2}}}d_p^2,\quad r_{i,p}^{j + 1} \le r_{out,p}^{j + 1}.\end{gather}
The pressure distribution within the ring is updated with (E38)
 \begin{gather}P_{gas,p}^{j + 1}\left(r_{i,p}^{j + 1}\right) = \frac{{[\left(A - B\right) \cdot \textrm{d}t + C]}}{{\varepsilon _p^{j + 1}\left(r_{i,p}^{j + 1}\right)}},\quad 0 < r_i^{j + 1} < r_{out,p}^{j + 1},\end{gather}
 \begin{gather}\begin{aligned} A & = \dfrac{{k_p^j\left(r_{i + 1/2,p}^j\right)P_{gas,p}^j\left(r_{i + 1/2,p}^j\right)r_{i + 1/2,p}^j\dfrac{{P_{gas,p}^j\left(r_{i + 1,p}^j\right) - P_{gas,p}^j\left(r_{i,p}^j\right)}}{{\Delta r}}}}{{\mu r_{i + 1/2,p}^j\Delta r}}\\ & \quad - \dfrac{{k_p^j\left(r_{i - 1/2,p}^j\right)P_{gas,p}^j\left(r_{i - 1/2,p}^j\right)r_{i - 1/2,p}^j\dfrac{{P_{gas,p}^j\left(r_{i,p}^j\right) - P_{gas,p}^j\left(r_{i - 1,p}^j\right)}}{{\Delta r}}}}{{\mu r_{i - 1/2,p}^j\Delta r}},\end{aligned}\end{gather}
 \begin{gather}B = \frac{{\begin{array}{@{}c@{}}\varepsilon
_p^j\left(r_{i + 1/2,p}^j\right)P_{gas,p}^j\left(r_{i +
1/2,p}^j\right)V_{solid,p}^j\left(r_{i +
1/2,p}^j\right)r_{i + 1/2,p}^j\\ - \varepsilon _p^j\left(r_{i
- 1/2,p}^j\right)P_{gas,p}^j\left(r_{i -
1/2,p}^j\right)V_{solid,p}^j\left(r_{i -
1/2,p}^j\right)r_{i - 1/2,p}^j\end{array}}}{{r_{i,p}^j\Delta
r}},\end{gather}
 \begin{gather}C = \varepsilon _p^j\left(r_{i,p}^j\right)P_{gas,p}^j\left(r_{i,p}^j\right).\end{gather}
Where the variables at half-nodes (i − 1/2, i + 1/2) are calculated with the values of side nodes
 \begin{gather}k_\textrm{p}^j\left(r_{i - 1/2,p}^j\right) = \frac{{2k_\textrm{p}^j\left(r_{i - 1,p}^j\right) \cdot k_\textrm{p}^j\left(r_{i,p}^j\right)}}{{k_\textrm{p}^j\left(r_{i - 1,p}^j\right) + k_\textrm{p}^j\left(r_i^j\right)}},k_\textrm{p}^j\left(r_{i + 1/2,p}^j\right) = \frac{{2k_\textrm{p}^j\left(r_{i + 1,p}^j\right) \cdot k_\textrm{p}^j\left(r_{i,p}^j\right)}}{{k_\textrm{p}^j\left(r_{i + 1,p}^j\right) + k_\textrm{p}^j\left(r_{i,p}^j\right)}}\end{gather}
 \begin{gather}\varepsilon _\textrm{p}^j\left(r_{i - 1/2,p}^j\right) = \frac{{2\varepsilon _\textrm{p}^j\left(r_{i - 1,p}^j\right) \cdot \varepsilon _\textrm{p}^j\left(r_{i,p}^j\right)}}{{\varepsilon _\textrm{p}^j\left(r_{i - 1,p}^j\right) + \varepsilon _\textrm{p}^j\left(r_{i,p}^j\right)}},\varepsilon _\textrm{p}^j\left(r_{i + 1/2,p}^j\right) = \frac{{2\varepsilon _\textrm{p}^j\left(r_{i + 1,p}^j\right) \cdot \varepsilon _\textrm{p}^j\left(r_{i,p}^j\right)}}{{\varepsilon _\textrm{p}^j\left(r_{i + 1,p}^j\right) + \varepsilon _\textrm{p}^j\left(r_{i,p}^j\right)}} \end{gather}
 \begin{gather}P_{gas,\textrm{p}}^j\left({r_{i
- 1/2,p}^j} \right)= \frac{{P_{gas,\textrm{p}}^j\left({r_{i - 1,p}^j}
\right)+ P_{gas,\textrm{p}}^j\left({r_{i,p}^j}
\right)}}{2},\notag\\ P_{gas,\textrm{p}}^j\left({r_{i + 1/2,p}^j} \right)=
\frac{{P_{gas,\textrm{p}}^j\left({r_{i,p}^j} \right)+
P_{gas,\textrm{p}}^j\left({r_{i + 1,p}^j} \right)}}{2}
\end{gather}
 \begin{gather}\begin{array}{@{}l@{}} \left. {\begin{array}{*{20}{c}} {U_{solid,p}^j\left(r_{i - 1/2,p}^j\right) = \dfrac{{U_{solid,p}^j\left(r_{i - 1,p}^j\right) + U_{solid,p}^j\left(r_{i,p}^j\right)}}{2},}\\ {U_{solid,p}^j\left(r_{i + 1/2,p}^j\right) = \dfrac{{U_{solid,p}^j\left(r_{i,p}^j\right) + U_{solid,p}^j\left(r_{i + 1,p}^j\right)}}{2},} \end{array}} \right\}\\ \end{array}\end{gather}
where  $\rho _{center,p}^{\; j + 1}$ is acquired by accounting for the volumetric increase in the gas pocket and the mass outflow due to the infiltration effect (E43)
 \begin{equation}\rho _{center,p}^{j + 1}
= \rho _{center,p}^j\frac{{\left(R_{in,p}^j\right)}^2}{{\left(R_{in,p}^{j + 1}\right)}^2}
+ 2\frac{\rho_{center,p}^jk_p^j\left(r_{0,p}^j\right)}{\mu
R_{in,p}^j}\left(\frac{P_{gas,p}^j\left(r_1^j\right) -
P_{gas,p}^j\left(r_0^j\right)}{\Delta r}\right)\Delta t.\end{equation}
Assuming an isentropic expansion for the central gases we obtain  $P_{gas,p}^{\; j + 1}$ with (E44)
 \begin{equation}P_{gas,p}^{j + 1}\left(r_{i,p}^{j + 1}\right) = \frac{{{P_0}}}{{{{\left(\rho _{center,0}^0\right)}^\gamma }}}{\left(\rho _{center}^{j + 1}\right)^\gamma },\quad r_{i,p}^{j + 1} \le 0,\end{equation}
and substituting  $P_{gas,p}^{j + 1}$,
 $R_{in,p}^{j + 1}$,
 $R_{out,p}^{j + 1}$ and
 $V_{in,p}^j$,
 $V_{CF,p}^{\; j}$ into (E45) to update the acceleration of the internal surface at j + 1 time step we get
 \begin{equation}\dot{V}_{in,p}^{j + 1} = \frac{{{{\left(V_{in,p}^j\right)}^2}}}{{R_{out,p}^{j + 1}}} + \frac{{\int_{r_{0,p}^{j + 1}}^{r_{out,p}^{j + 1}} { - \left[P_{gas}^{j + 1}\left(r_{i + 1,p}^{j + 1}\right) - P_{gas}^{j + 1}\left(r_{i,p}^{j + 1}\right)\right]\left(R_{i,p}^{j + 1}\right)\,\textrm{d}r} }}{{\left(R_{out,p}^{j + 1} - R_{in,p}^{j + 1}\right)R_{in,p}^{j + 1}\Delta r\left(1 - {\varepsilon _{min}}\right){\rho _{solid}}}} - \frac{{{{\left(V_{in,p}^j\right)}^2}}}{{R_{in,p}^{j + 1}}},\end{equation}
which serves to acquire  $V_{in,p}^{j + 1}$
 \begin{equation}V_{in,p}^{j + 1} = V_{in,p}^j + \dot{V}_{in,p}^{j + 1} \cdot \Delta t.\end{equation}
Substituting  $V_{in,p}^{j + 1}$ into (E47) we gain
 $V_{out,p}^{j + 1}$
 \begin{equation}V_{out,p}^{j + 1} = \frac{{V_{in,p}^{j + 1} \cdot R_{in,p}^{j + 1}}}{{R_{out,p}^{j + 1}}}.\end{equation}
The relative particle velocity in the central gas region ( $r_{i,p}^j < 0$) is set as
 $ - V_{in,p}^j$ as stagnate in the absolute coordinate. Applying the assumption of an incompressible ring with mass conservation, the absolute particle velocity within the ring is proportional to 1/R. In conclusion, the relative particle velocity distribution follows
 \begin{equation}U_{solid,p}^{j + 1}\left(r_{i,p}^{j + 1}\right) = \left\{ \begin{array}{@{}l@{}} - V_{in,p}^{j + 1},\quad r_{i,p}^{j + 1} < 0\\ \dfrac{{V_{in,p}^{j + 1}R_{in,p}^{j + 1}}}{{r_{i,p}^{j + 1} + R_{in,p}^{j + 1}}} - V_{in,p}^{j + 1},\quad 0 \le r_{i,p}^{j + 1} \le r_{out,p}^{j + 1} \end{array} \right..\end{equation}
Equations (E31)–(E48) are solved iteratively until presumably the expansion-to-contraction of the ring occurs, Vout < 0.



