Introduction
Animal organisms are highly controlled complex systems. Species fitness is achieved through homeorhetic regulations (HR) that coordinate changes in the metabolism of tissues necessary to support the various physiological changes of female organisms (Bauman and Currie, Reference Bauman and Currie1980). HR thus support both foetal development, to give birth to a new generation, and lactation, to ensure the survival and growth of the offspring. To perform these regulations, the female metabolism must be altered in order to establish a strong milk secretion priority above all other functions. The role of HR is not limited to the realisation of one pregnancy–lactation cycle. HR are also determining factors in the organisation of the successive sequences of physiological changes throughout the productive life. Moreover, HR coordinate animal functions (especially nutrition and reproduction) by changing rules in nutrient partitioning and as a result relative priorities among physiological functions.
Researchers have dealt both with the question of the control of nutrient partitioning and with the representation of HR as a driver of this partition. The different principles used to formalise HR in lactating ruminant models were reviewed by Sauvant (Reference Sauvant1996). Changes in nutrient partitioning are usually represented through changes in theoretical hormones that control the major flows involved in metabolism. These models have a high level of detail, but they ignore the successive gestation–lactation cycles and remain at the scale of a single lactation (Baldwin et al., Reference Baldwin, France and Gill1987; Danfaer, 1990). Some herd models (Blackburn and Cartwright, Reference Blackburn and Cartwright1987; Sorensen et al., Reference Sorensen, Kristensen and Thysen1992; Tess and Kolstad, Reference Tess and Kolstad2000) have attempted to integrate controls of nutrient partitioning over a succession of production cycles without representing hormonal effects. These models divide lactation into several phases according to the number of days before or after milk peak. Each phase is associated with an equation of dry-matter intake (DMI) determining energy input and then a set of rules determining energy allocation for each physiological function (maintenance, milk production and body reserves mobilisation). Although these approaches represent changes in functional priorities throughout the productive life of females, they remain inexplicit as to the drivers of these changes.
The objective of this work was to develop a dynamic model of a lactating female, which includes HR through the driving effect of theoretical hormones on the evolution of nutrient partitioning. In this way, the model expresses the production potential (‘pull’ approach); thus it does not represent any feed limitation. It simulates the changes in milk production, DMI and body weight (BW) throughout the entire productive life of a lactating female. The model combines a minimum of mechanistic representations used in models of lactating female with the long-term approach developed in herd models. This modelling framework is applied to the dairy goat.
Model
Conceptual model
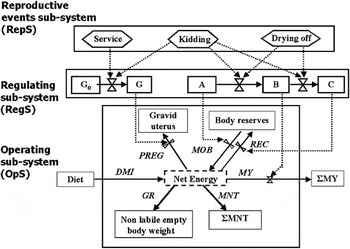
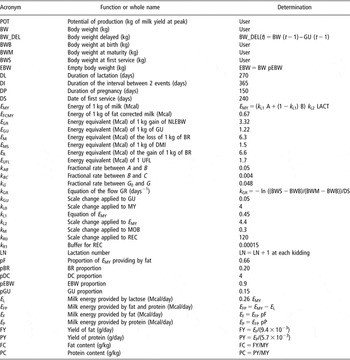
Figure 1 presents the diagram of the conceptual model. Following the approach proposed by Sauvant (Reference Sauvant1992), the female organism is represented by two interactive sub-models: the operating sub-system (OpS) and the regulating sub-system (RegS). OpS represents the productive functions of the lactating female considered as a converter of feed into milk. RegS stands for the regulations using theoretical hormones. It directly controls the major physiological flows of the OpS. In order to expand the animal model over the productive history of the female, the model incorporates a third sub-system, the reproductive events sub-system (RepS), which coordinates the RegS through discrete reproductive events. The model framework thus combines a dynamic part representing compartments and flows of RegS and OpS and a discrete part for reproductive events. The model is developed on the ModelMaker 4.0 software (Modelkinetix, Oxford, UK), which is a visual modelling environment based on the system dynamics paradigm (Forrester, Reference Forrester1971). System dynamics is based on conceptualising a system in terms of compartments (stocks) and flows, and provides an intuitive way of modelling with differential equations. Acronyms, variables and parameters used here are listed in Table 1.
Representation of the model framework. Rectangular forms represent the compartments; dotted arrows represent information flows; triangular forms represents the control points; polygonal forms represent events and full arrows represent the flows of dry-matter intake (DMI, kg/day), pregnancy (PREG, kg/day), growth (GR, kg/day), maintenance (MNT, UFL per day), MY (kg/day), reconstitution (REC, kg/day) and mobilisation (MOB, kg/day). See Table 1 for parameters.

List of acronyms, parameters and variables used in the model

Components of the operating sub-system: GU = gravid uterus (kg), NLEBW = non-labile empty body weight (kg), BR = body reserves (kg), DMI = dry matter intake (kg dry matter per day), UFL = unité fourragère lait (French unit of net energy equivalent to 1.7 Mcal), GR = flow of growth (kg NLEBW per day), MY = milk yield (kg/day), MOB = flow of mobilisation (kg BR per day), REC = reconstitution flow (kg BR per day), DC = digestive contents (kg).
A, B, C, G0 and G are compartments of the regulating sub-system; LACT and GEST are two Boolean variables of the reproductive events sub-system.
Reproductive events sub-system (RepS)
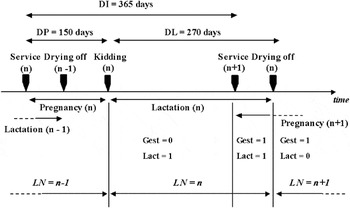
In order to simulate the productive life of a dairy goat female, RepS integrates three events that induce change in its physiological status: service, kidding and drying off. These events are governed by biological or management rules. Breeding service activates the gestation functions, and fertilisation is assumed to occur at each service and systematically lead to a gestation of fixed duration. The latter is followed by kidding, which induces lactation. Finally, drying off stops lactation. This sequence of pregnancy–lactation cycles is repeated throughout a yearly range of time (DI = 365 days). The time t = 0 of simulation corresponds to the birth of the dairy goat and the first service occurs at the day DS = 240 days. Durations of pregnancy (DP) and lactation (DL) are fixed at 150 and 270 days, respectively, as shown in Figure 2. RepS controls RegS through two Boolean variables, LACT and GEST. They simply drive the flows of the RegS by taking the values 1 or 0 in function of the physiological status of the female. The simulation of the productive history of a dairy female needs to consider not only the temporal sequence of pregnancy–lactation cycles but also the ageing process. Therefore, at each kidding, a variable ‘lactation number’ (LN) is increased by one to simulate this process. LN influences milk production and most of the other flows: their values increase until the fourth lactation where the maximum potential is reached and then slightly decrease (see further).
Sequence of two pregnancy–lactation cycles coordinated by the reproductive events sub-system with the Boolean variables GEST and LACT inducing the occurrence of the three considered events (service, kidding and drying off) and the aging process with the lactation number (LN) increased by one. These events occur with a yearly range (DI = 365 days). Durations of pregnancy (DP) and lactation (DL) are assumed to be constant (respectively, 150 and 270 days).

Regulating sub-system (RegS)
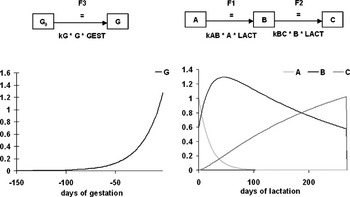
In contrast to previous models considering lactation only (Sauvant and Phocas, Reference Sauvant and Phocas1992; Martin and Sauvant, Reference Martin and Sauvant2007), RegS is based on two sets of meta-hormones controlling, respectively, pregnancy and lactation. Pregnancy is controlled by a two-compartment system, G and G 0 (Figure 3). The flow between G and G 0 generates a positive exponential kinetic used to model the increase of gravid uterus (GU) weight as described by the following equation:

Structure, mathematical formalism and dynamic of the theoretical hormonal effects of pregnancy (left side) and lactation (right side) constituting the RegS. See Table 1 for parameters.

Concerning lactation, a flow of substance moving through three successive compartments, A, B and C, according to the mass action law generates kinetics with close analogy to the major patterns related to the lactation process (Figure 3). The three compartments are used to represent the three partly concomitant phases of reserves mobilisation (mainly adipose tissue) with A, milk production with B and reconstitution of reserves with C. In early lactation, compartment A decreases exponentially with time, allowing a maximum effect of a theoretical lactation hormone. The charge of compartment B by the flow from A following by the discharge of B by the flow to C creates a dynamic in B analogous to a lactation curve. The outflow from B is accumulating in C and it creates a dynamic analogous to the pattern of body reserves reconstitution. These kinetics allow the female to accumulate energy in adipose tissue after its energy investment for the offspring through milk production. The following differential equations define the kinetics of A, B and C throughout lactation:
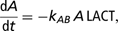


As we first wanted to test the hypothesis of a simple representation of HR, we chose to fix the values of kAB and kBC in order not to have too many parameters to control and to be able to simply introduce production potential.
Operating sub-system (OpS)
The OpS converts dietary energy into flows of energy. Its framework is supported by three compartments (Figure 1): GU, body reserves (BR) and non-labile empty body weight (NLEBW). To model flows of DMI (kg/day), milk yield (MY, kg/day) and BW (kg), virtual compartments are created for available dietary resource (Diet), accumulation of energy of maintenance (SMNT) and milk production (SMY). Moreover, an auxiliary variable, DC, represents the digestive content, which is proportional to DMI (Chilliard et al., Reference Chilliard, Rémond, Agabriel, Robelin and Vérité1987). This framework makes it possible to calculate BW according to the equation:




Each compartment has a dynamic evolution and the model thus makes it possible to follow the changes in BW. For GU, at t = kidding the Boolean variable GEST decreases from 1 to 0 and as a result GU immediately drops to zero. This drop is reported on BW. The compartmental framework also simulates the key physiological flows through the body: MY, body reserves mobilisation (MOB in kg of BR per day), body reserves reconstitution (REC in kg of BR per day), pregnancy (PREG in kg of GU per day), growth of NLEBW (GR in kg of NLEBW per day) and maintenance (MNT in UFL per day with UFL = unité fourragère lait, the French unit for net energy with 1 UFL = 1.7 Mcal of net energy). The following flows directly involved in lactation and pregnancy are defined by RegS:


where k M, k L0, k R0, k R1 and k GU parameters change the dimensions between RegS (substance with no unity) and OpS (physiological unit). Concerning BR, changes are driven by REC and MOB. MOB flow is activated only during lactation as it is defined by A. REC flow takes account of both reconstitution during lactation and growth throughout productive life. Indeed, REC is defined by the compartment C of RegS and also by GR. Hence, at the beginning of simulation, BR changes are only due to GR: the size of BR follows the growth of the young female. When kidding occurs, RegS is activated and then BR changes are due to MOB and REC. The reconstitution of BR is limited by a buffer (k R1 (BRmax – BR)). This way, the flow cannot exceed the maximum size of BR, BRmax, equal to pBR × EBW. The MNT and GR flows are calculated on the basis of INRA equations (Sauvant et al., Reference Sauvant, Giger-Reverdin and Meschy2007):


where BWM is the body weight at maturity, BWB is the body weight at birth and pEBW is the average proportion of EBW in total BW at these time points. MNT is calculated with BW_DEL and not with BW as in the INRA equation. BW_DEL is the delayed variable equal to BW − GU with a time step difference of 1 day. This assumption is made to avoid the problem of a circular reference at the beginning of simulation run. The parameter pEBW could seem to be useless because of equation (8), which already defines EBW. In fact, this parameter makes it possible to initialise the model with birth, first service and mature body weight and not with empty body weight at these same time points. NE is a ‘zero pool’ compartment that maintains the energy balance between flows of inputs and outputs. The physiological flows (material unit per day) are converted in net energy flows (Mcal/day) with the set of parameters E M, E UFL, E GR, E GU and E R expressed in Mcal per material unit (Sauvant et al., Reference Sauvant, Giger-Reverdin and Meschy2007). E MY represents the energy output through milk. It raises a specific issue in the sense that the change in energy secretion in milk is fairly different from that of the MY. It is considered that milk energy output has two origins, one driven by the global process of lactation (proportional to B) and the other driven by the reserves mobilisation (proportional to A). Therefore, E MY is calculated according to the equation

where k L1 is a parameter that controls the respective influences of A and B while k L2 is a converter used to change the scale between RegS and OpS following the same principle as for the other flows.
NE is defined by the following equation:

For each time step, dNE/dt = 0. Energy inputs (energy from DMI and MOB) are thus equal to outputs (energy of MNT, GR, GU, MY and REC) and therefore:

where E MS is the parameter converting DMI into Mcal/day and thus represents the energetic concentration of the diet. We assume it remains constant throughout the simulation. Our work is based on the assumption of a pull approach, which means that production pulls intake. Moreover, we consider physiological flows in terms of net energy. Milk production is an energy export and intake is an import, in response to production. In order to express this energy import in terms of dry matter (which is easier to manipulate), we used a parameter to convert energy in dry matter. As our concern is not to test the effect of feed on dairy goat’s performances, we choose to set this parameter constant as its role remains to convert units (Mcal in kg of dry matter) and we choose the value of 1.5 Mcal/kg of dry matter because it reflects the value of a good-quality forage as maize silage. Equation (17) makes it possible to calculate DMI, which is an output of the model, governed by the milk production.
The model also simulates milk composition. Energy exported in milk is equal to the sum of energy flows of its three major constituents:

where E L represents the energy flow of lactose, E F that of fat and E P that of protein in Mcal/day. E L is considered as a constant proportion of E MY, equal to 0.26. Hence, the sum of energy flows of fat and protein (E FP) is equal to:

E FP is split between E F and E P with the parameter pF assuming a constant ratio of energy of milk fat and protein


The fat and protein yields (respectively, FY and PY in g/day) are then calculated with the energy concentrations of fat and protein (respectively, equal to 9.4 and 5.7 Mcal/kg):


It is thus possible to predict fat content (FC) and protein content (PC) in g/kg of milk:


The auxiliary variable fat-corrected milk yield (FCMY) is calculated according to the equation:

where E FCMY is the energy content in 1 kg of milk with 3.5% of fat content.
The proposed model simulates energy requirements of each physiological function. Moreover, it simulates the dynamic change of these requirements throughout time through the dynamic determination of OpS flows by RegS compartments. As a result, the nutrient partitioning is modified during one sequence of gestation–lactation and changes occur during the breeding cycles due to RepS action.
Effects of production potential and mature body weight
Production potential. The shapes of A, B and C dynamics are determined by the key parameters kAB and kBC. The model produces the effects of production potential (POT) and LN at the level of the lactation curve.
The effect of POT is introduced as an effect on the value of A 0 (corresponding at A for t = date of kidding) according to the following equation:

As a result, when A 0 is equal to 0.1931 POT, the maximum of milk production (MAX(MY)) is equal to POT. Thus, various values of POT can parameterise the model. This way of introducing an effect of production potential is linked to our choice of setting kAB and kBC as constant values: A 0 and maximum of B are thus known. The lactation curve is also modulated by LN. Our assumption is that LN modifies the value of the peak reached during lactation. As for POT, the LN effect is introduced by modifying the value of A 0. At each date of kidding, RepS manages the calculation of A in function of LN. The effect of LN on MAX(MY) for each parity was calculated from the data of Williams (Reference Williams1993), who used a general equation of lactation curve derived from Wood and two equations linking parameters of the lactation equation to LN. These equations were used to provide MY for each lactation, from LN = 1 to 8. The relation between MAX(MY) and LN was then deduced with a polynomial regression. The following relation is introduced in the model:

with

For LN = 4, LN_effect = 1 and thus A 0 = 0.1931 POT. So, for the fourth lactation:

To link milk production of the 1st day of lactation to LN_effect, it is considered that, at each kidding, compartment B is filled so that initial milk production is equal to 60% of production at peak:

Body weight. In order to simulate the influence of various adult sizes and breed effect (mainly Saanen and Alpine), a parameterisation of the model in function of the mature body weight is introduced. This is done with the equation of GR, the flow of growth (equation (14). NLEBW is thus defined as:

The parameter of the growth curve is calculated using the weight at first service (BWS) reached at t = DS. The targeted weight at first service is often a management tool for French goat farmers. Thus

and

These equalities make it possible to calculate k GR:

As several flows are indexed on BW or on a percentage of it, changes of body mature weight alter overall model behaviour.
Data and simulations
The aims of the simulations are threefold: (i) to test model behaviour at the scale of an average dairy goat productive life (internal validation); (ii) to evaluate the effect of POT and BWM on the simulated dynamics of DMI, BW, MY and milk composition; and (iii) to compare these simulated dynamics to external data (external validation). The time step is the day and the simulations are run from birth until the fifth weaning (from day 0 until day 2120). The integration method is Runge–Kutta 4 with a fixed time step. Data used to build and evaluate the model come from several sources. In an initial step, the global patterns of MY, DMI and BW proposed by Morand-Fehr and Sauvant (Reference Morand-Fehr and Sauvant1988) are used to estimate a first set of values of the RegS parameters (kG, kAB and kBC) for a whole reproductive cycle. In a second step, to attain higher accuracy for key variables or flows such as DMI or FCMY and adjust parameters of RegS, the model is evaluated against several experimental data sets (Sauvant and Morand-Fehr, Reference Sauvant and Morand-Fehr1978) of 72 Alpine goats of the experimental herd of our lab. Finally, in order to challenge the model to external data, simulated data are compared with mean results of the French milk record organization (Bouloc, 1991), the French organism in charge of recording the milk performance of dairy herd (cows and goats) and advising the breeders.
Results
Internal validation
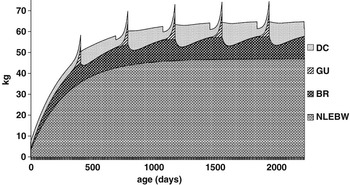
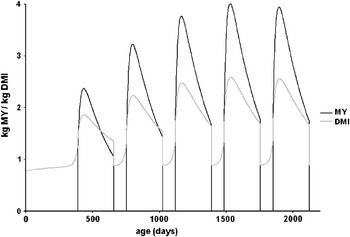
Simulation results were obtained for a female goat weighing 4 kg at birth and reaching, respectively, 37 kg at first service and 60 kg at maturity. Its production potential was 4 kg of milk at the peak of the fourth lactation. The kinetic of NLEBW represented female growth (Figure 4). Body reserves followed a similar pattern, increasing until maturity. The level of body reserves was clearly affected by mobilisation and reconstitution flows due to lactation. GU increased during pregnancy and then decreased suddenly at kidding. The maximal size of GU also increased until maturity because of the PREG equation, which took account of female growth. As expected, there was a quick drop of digestive contents at the dry phase. Because of the ‘pull’ approach, DMI followed MY and suddenly decreased on the day of drying off. As DC are proportional to DMI (equation (6) they also decreased suddenly and hence there was a drop in BW at this time point. Concerning lactation, Figure 5 represents the successive production cycles through productive life. The effect of LN is illustrated by the increasing production peak until the fourth lactation (where POT is reached) followed by a slightly less productive fifth lactation. The simulated dynamics were globally realistic (Morand-Fehr and Sauvant, Reference Morand-Fehr and Sauvant1988), suggesting an adequate and coherent model structure.
Simulated kinetics in kg/day of digestive contents (DC), gravid uterus (GU), body reserves (BR) and non-labile empty body weight (NLEBW) of a goat weighing 4 kg at birth, reaching 60 kg at maturity and with a production potential (POT) of 4 kg.

Simulated kinetics in kg/day of milk yield (MY) and dry-matter intake (DMI) of a goat weighing 4 kg at birth, reaching 60 kg at maturity and with a production potential (POT) of 4 kg.

Influence of production potential
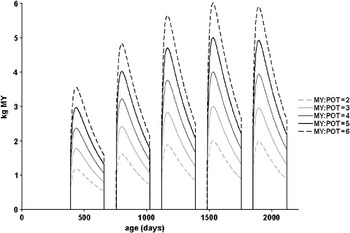
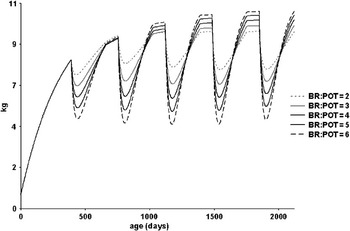
Sensitivity analysis was performed to assess how the POT parameter contributes to model output variability in terms of milk production (Figure 6) and body reserves (Figure 7). The model was run repeatedly for a combination of POT values varying from 2 to 6 kg at peak. The maximum value reached at the fourth lactation corresponded to POT. The loss of body reserves during lactation became higher as POT rose. The model assumes that females producing more are also those whose body reserves are most mobilised (Morand-Fehr and Sauvant, Reference Morand-Fehr and Sauvant1988). This general pattern suggests that the model fairly well simulates the link between a female’s ability to produce and mobilise reserves.
Simulated kinetics in kg/day of milk yield (MY) of a goat weighing 4 kg at birth, reaching 60 kg at maturity and with a production potential (POT) varying from 2 to 6 kg.

Simulated kinetics in kg/day of body reserves (BR) of a goat weighing 4 kg at birth, reaching 60 kg at maturity and with a production potential (POT) varying from 2 to 6 kg.

External validation
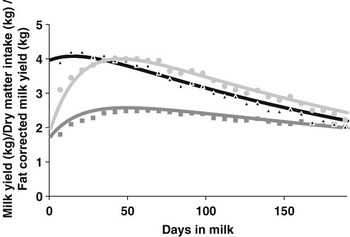
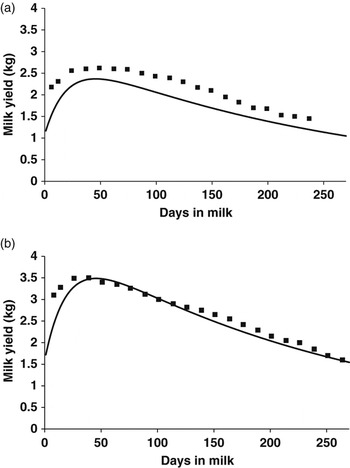
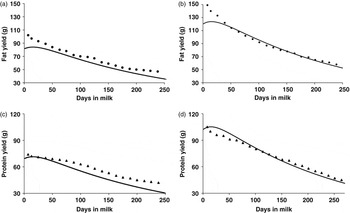
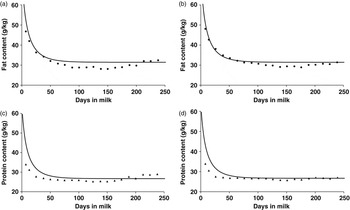
Figure 8 compares weekly simulated and observed values of MY, FCMY and DMI (Sauvant and Morand-Fehr, Reference Sauvant and Morand-Fehr1978). Globally, the prediction was satisfying although the simulated MY appeared a bit too low at the onset of lactation. Figure 9 compares simulated and measured MY of 10 1073 multiparous goats and 45 207 primiparous goats of the French milk record organization in 1987 (Bouloc, 1991). As the multiparous goats of the milking control were in average in their 2.5 lactation, the simulated curve presented here was obtained by calculating the average curve between the curves for LN = 2 and LN = 3 simulated by the model. As for Figure 8, the simulated MY was a bit too low at the onset of lactation of multiparous goats (POT = 3.4). For primiparous goats, the simulated kinetic was less satisfying near the peak. Figure 10 compares, for the same source of data, the simulated and observed kinetics of fat and protein yield. For multiparous goats, the simulated decay of protein and, mainly, fat was insufficient, suggesting too low a weight for compartment A and probably a variable ratio between fat and protein flows. Figure 11 compares simulated and observed values of milk protein and fat contents, resulting from the kinetics of Figures 9 and 10. For multiparous goats, the simulated milk protein content was too high compared to the milk-fat one. Moreover, simulations did not reveal the increases of MCP and, mainly, MFC during the last weeks of lactation.
Comparison of simulated milk yield ( ), fat-corrected milk yield (
 ) and dry-matter intake (
 ) with actual milk yield (
 ), fat-corrected milk yield (▴) and dry-matter intake (
 ) from 72 Alpine goats of the experimental flock of Grignon (Sauvant and Morand-Fehr, Reference Sauvant and Morand-Fehr1978).

Comparison between simulated milk yield ( ) and data (▪) from the French milk record organization (Bouloc, 1991) for (a) goats in first lactation and (b) goats in their 2.5 lactation in average.

Comparison between simulated fat yield ( ) and data (●) from French milk control (Bouloc, 1991) for (a) goats in first lactation and (b) goats in their 2.5 lactation in average and between simulated protein yield (
 ) and data (▴) from French milk control for (c) goats in first lactation and (d) goats in their 2.5 lactation in average.

Comparison between simulated fat content ( ) and data (●) from French milk record organization (Bouloc, 1991) (a) for goats in first lactation and (b) goats in their 2.5 lactation in average and between simulated protein content (
 ) and data (▴) from French milk record organization for (c) goats in first lactation and (d) goats in their 2.5 lactation in average.

Globally, these validation results show that the model can simulate relevant sets of physiological dynamics.
Discussion
This paper develops a dairy female model simulating the range of biological dynamics (DMI, milk production and body weight evolution) throughout its productive life with an explicit integration of the representative homeorhetic controls. Calibration was currently performed on the dairy goat; however, this principle is applicable to any lactating female. It was originally assumed that physiological regulations can be easily formalised using a minimal compartmental structure without detailing physiological mechanisms. The proposed model generates sets of kinetics that are globally relevant even if their levels of accuracy need to be improved on several aspects. Our assumption on the possibility of building a minimal and realistic representation of animal HR was globally confirmed by the results.
Several limits of the current model have to be stressed. An important drawback is the constant shape of the lactation curve. It is known that the shape of the curve is altered by lactation number, season of kidding and feeding strategy (Gipson and Grossman, Reference Gipson and Grossman1990; Williams, Reference Williams1993; Montaldo et al., Reference Montaldo, Almanza and Juarez1997). As a further step in the model development, the effects of the most marked of these factors would have to be integrated. The simulated DMI curve is consistent with the known pattern of intake throughout lactation. In particular, the delay of time between peak MY and maximum DMI is approximately well represented. However, the increasing DMI pattern in late gestation remained unsatisfactory. This result is mainly due to the lack of representation of the regulating system control during the transition period between two successive reproductive cycles. The simulated BW changes during lactation (not presented) are less satisfying. The role of gut contents, which were assumed to be proportional to the DMI level, could be a cause of bias. Due to the model structure itself, strong links exist between A, B and C and therefore among kinetics of body reserves, lactation and intake. However, to achieve better accuracy, it might be necessary to partly dissociate the structure of RegS. Milk composition also requires improvement, a major aspect being the ratio between MFC and MPC, which was assumed to be constant while it is known to decrease throughout lactation (Bouloc, 1991). Another drawback concerns the lack of increase of MFC and MPC at the end of lactation. This result occurs because MFY, MPY and MY are mainly driven by B as lactation progresses.
Because reproductive events are driven by HR, which are themselves partly dependent on environmental influences (season, management, etc.), we depart from the Sauvant (Reference Sauvant1992) approach by adding RepS, thus making it possible to integrate events being governed by both biological and management rules. A prerequisite was to remain as simple as possible in this part, keeping in mind the preparation of further developments toward a herd model in which the current animal model will be the basic element.
At the operating level the current model is much less detailed than mechanistic models of lactating ruminant (Baldwin et al., Reference Baldwin, France and Gill1987; Danfaer, 1990; Martin and Sauvant, Reference Martin and Sauvant2007) as metabolites and key organs are not represented. However, at the regulating level, roughly the same logic of theoretical hormonal actions is used. Fairly similar effects are generated with a simple compartmental framework, for instance, the relationship between A and C is similar to that used by Martin and Sauvant (Reference Martin and Sauvant2007) for theoretical hormones of catabolism and anabolism. As these models were based on one lactation, HR effects were just represented at this time scale (300 days). We depart from this approach by taking HR effects at the scale of a whole productive life into account. This animal representation incorporating basic regulations throughout its productive life can therefore be easily used for a dynamic herd model.
RegS is built to control physiological dynamics throughout the whole productive life of the goat by interacting with RepS. Even if a long-term dimension of control was present in the herd models of Blackburn and Cartwright (Reference Blackburn and Cartwright1987), Sorensen et al. (Reference Sorensen, Kristensen and Thysen1992) or Tess and Kolstad (Reference Tess and Kolstad2000), our modelling approach has the advantage of explicitly incorporating more mechanistic elements to represent kinetic of nutrient partitioning through HR. However, in the current state of the model, interactions among processes of growth, pregnancy and lactation are only driven by HR. Flexibility in these interactions due to environmental factors will be considered in further developments.
In our model, primacy is given to the control of body reserve by RegS throughout lactation. The body reserve is thus a kernel of the model and not an output as in previous approaches, considering the animal or herd level. Body reserves are a fundamental element in the expression of milk production potential and in the connected delay between dynamics of MY and DMI. Several authors have recently emphasised the need to integrate the role of body reserves in the way of conceptualising ruminant feeding systems. Friggens and Newbold (Reference Friggens and Newbold2007) introduce the concept of genetically driven mobilisation. In the revised INRA feeding system, Faverdin et al. (Reference Faverdin, Delagarde, Delaby and Meschy2007) take account of a given amount of energy coming from body reserves in the calculation of energy requirements for lactating cows. Thus, they explicitly include kinetics of body reserve mobilisation in their prediction equations of animal requirement. Moreover, Friggens (Reference Friggens2003) reviewed the important role of body reserves (size and rate of mobilisation) as indicators of present and future environmental constraints. Such indicators can help to anticipate the consequences of these constraints on the female reproductive performances. Due to this essential role of body reserve dynamic, we have chosen to build a model based on HR and on the expression of production potential. Methodologically, this choice was driven by the need to limit the level of complexity and achieve our objective of minimal regulation representation.
As HR control has an internal origin, the model constitutes a ‘pull’ approach. Therefore, another major further development could be to build, starting from the present model, a ‘push’ approach, taking both HS regulations and dietary fill influences into account in order to predict animal responses to environmental and dietary influences. The application of the recent version of the INRA fill unit system and of the response laws to concentrate supply to lactating goat (Sauvant et al., Reference Sauvant, Giger-Reverdin and Meschy2007) constitute a simple way of altering the potential through feeding limitations as also proposed for dairy cows by Faverdin et al. (Reference Faverdin, Delagarde, Delaby and Meschy2007).
Conclusion
The proposed model describes the potential kinetic of the milk production of a dairy goat, with a minimum of underlying mechanisms of HR. These HR consist of a strong dynamic link among body reserves mobilisation and reconstitution, lactation and DMI. By several aspects, the model is targeted to be integrated as a basic element in a herd simulator. It can easily represent different levels of milk production potential and body weight with a simple structure. It also considers the whole productive life of the dairy goat.
Acknowledgements
This work was carried out with the financial support of the ‘ANR- Agence Nationale de la Recherche – The French National Research Agency’ under the ‘Programme Agriculture et Développement Durable’, project ‘ANR-05-PADD-0XX, Praiterre’ and with a PhD scholarship provided by INRA (SAD and PHASE departments) and the Poitou-Charentes region.