


1. Introduction
Radar echo sounding (RES) at megahertz frequencies responds directly to basal water because of the strong dielectric contrast between liquid water and most other geological materials. Thus RES has been used to probe ice-sheet bed conditions with significant success. For example, studies by Reference Bentley, Lord and LiuBentley and others (1998) and Reference Gades, Raymond, Conway and JacobelGades and others (2000) used airborne and ground-based RES (respectively) to compare strengths of basal reflections beneath Siple Coast ice streams and inter-ice-stream ridges. Interpretation of the comparisons shows wetness beneath both dormant and active ice streams, a lack of wetness beneath ridges, and coincidence of transitions between bed conditions with independently known shear margins; these are significant results in the investigation of fast-flow dynamics. Both studies, however, depended on circumstances in which the variations of interest remained visible despite neglect of possible spatial variations in ice absorption.
A much more common situation is that in which uncertainty about such variations renders apparent differences in bed reflection inconclusive (Reference Bogorodsky, Bentley and GudmandsenBogorodsky and others, 1985; Reference Shabtaie, Whillans and BentleyShabtaie and others, 1987). RES probing of the bed in most locations relies on models for ice absorption that depend on temperature, impurity content and grain-size (Reference Corr, Moore and NichollsCorr and others, 1993; Reference Wolff, Miners, Moore and ParenWolff and others, 1997). In practice, however, inputs and functional dependencies in the models are often highly uncertain, and model results remain largely untested against direct observation (Reference Bogorodsky, Bentley and GudmandsenBogorodsky and others, 1985; Reference Shabtaie, Whillans and BentleyShabtaie and others, 1987). This situation may be especially problematic in precisely one of the most interesting situations, where variations in geothermal flux may produce simultaneous variations in ice temperature and basal conditions (Reference Blankenship, Bell, Hodge, Brozena, Behrendt and FinnBlankenship and others, 1993; Reference Fahnestock, Abdalati, Joughin, Brozena and GogineniFahnestock and others, 2001).
Direct measurement of electromagnetic absorption in ice sheets would thus be glaciologically valuable. Perhaps the most elementary basis for such methods is observation of the change in radar signal intensity with varying length of a propagation path through the ice. Here we present and demonstrate two methods based on path-length variation, using ground-based RES data from Siple Dome, West Antarctica (which, we will show, is particularly well suited for this initial work). Attenuation estimates from the two methods differ little relative to the expected range of attenuations in ice sheets, but the difference may nonetheless be informative, because it may serve to bound possible effects of temperature regimes and dielectric anisotropy which are probed differently by the two methods.
2. BED Echo Characteristics at Siple Dome
Both of our methods use the ice-sheet bed as a reflector so that various propagation path lengths can be observed at the (relatively accessible) ice-sheet surface. Thus, properties of the reflector must, implicitly or explicitly, be taken into account. Here we discuss observations of those properties for the special case pertaining to our measurements.
The RES data for this study were acquired with a low-frequency (3–5MHz) monopulse radar(Reference Jacobel, Scambos, Raymond and A. M. GadesJacobeland others, 1996, Reference Jacobel, Scambos, Nereson and Raymond2000; Reference GadesGades, 1998) during the course of several field seasons on Siple Dome. Siple Dome provides an unusually favorable location for initial development and application of our methods because most of its bed is unusually flat and homogeneous in apparent radar reflectivity (at least at the low frequencies we use). Figure 1 shows an RES profile (upper panel) and derived data (lower panel) from a transect across Siple Dome, including the summit. In the lower panel we have plotted, as a function of position, the apparent bed-reflected power, BRPR, which was defined by Reference Gades, Raymond, Conway and JacobelGades and others (2000) as an estimate of bed-reflected power after empirical correction for varying thickness of overlying ice. In this work, we utilize only the portion of transect on which data of 3 MHz center frequency were acquired within roughly 10 km north and 40 km south of the summit; for this portion, the apparent bed-reflected power, and thus presumably the bed reflectivity, varies by at most 10%.
Data from a conventional radar sounding transit across Siple Dome, together with estimates of the relative power of bed reflection after an empirical correction for ice thickness (as discussed in the text and explained in detail by Reference Gades, Raymond, Conway and JacobelGades and others (2000) ) .

New observations suggest that 5 MHz bed reflections beneath Siple Dome summit are not only homogeneous in magnitude, but also highly coherent. During the 2001/02 field season, we acquired stacks of roughly 2000 echoes (using the radar in the standard, nadir-looking configuration) while stationary at each of 201 points spaced 1 m apart, along a line within a few hundred meters of the summit (essentially at the point marked 0 km in Figure 1). Stacking reduces environmental and system noise in the echoes and thus yields estimates of the coherent reflection as a function of travel time beneath the radar. For display here, we have also band-pass filtered the echoes (with band edges of 3 and 8 MHz) to further reduce noise. Figure 2 shows an “A-scope” plot of the portions of the stacked, filtered echoes that contain the bed return. It is apparent that not only the amplitudes, but also the phases and details of the bed-reflected waveforms, are nearly invariant for all echoes along the line. Provisionally using the square of the maximum signal amplitude (Reference MorseMorse, 1997) as a measure of echo intensity, I, we compute a standard measure of signal coherence, the “scintillation index”, defined by m = variance(I)/[mean(I)]2 (A scintillation index of 0 indicates complete coherence, whereas random, uncorrelated values of I result in m = 1.) For the stacked filtered data, m = 0.107; even stacked but otherwise unfiltered data yield m = 0.114. Both results quantify the high degree of coherence across transverse distances on the order of hundreds of meters.
Successive stacks of roughly 2000 bed echoes, spaced 1m apart along a line 200 m long, near Siple Dome summit, displayed in the so-called “A-scope” format.

Common-midpoint sounding geometry, for two separations. Ice thickness is H. In general, range to the bed from (either) transmitter or receiver is R, and the propagation path makes an angle 6 with the vertical (we neglect near-surface refraction). Quantities associated with the minimum transmitter/receiver separation are denoted by subscript 1.

Angular dependences of Fresnel power reflectivity for plane interfaces separating materials with relative permittivities characteristic of ice (3.2) from (upper curve) a wet ice-sheet bed (8 0) and (lower curve) rock (1 0). Note the large difference in level but near-congruence of the angular-dependence curves.

Comparison of Figure 2 with figures 3 and 4 of Reference Schultz, Powell and BentleySchultz and others (1987), which are analogous plots of observations at 50 MHz on Whillans Ice Stream (formerly Ice Stream B), shows that our situation does not hold for all locations and radar frequencies. However, at Siple Dome and at 3–5 MHz frequency, these observations suggest that bed reflection can be approximated by simple Fresnel reflection from a sharp interface at the bed.
3. Wide-Angle Sounding for Attenuation
Figure 3 shows schematically the particular wide-angle sounding geometry we have thus far employed, in which source and receiver locations are arranged in pairs centered on a common midpoint (CMP). Reflection or scattering at the bed completes the variable-length path through the ice between transmitter and receiver, and we observe the variation in echo intensity with varying path length. CMP sounding maintains a common specular point on the bed for all pairs (in the absence of relative slope between surface and bed), and the reflecting bed area varies only minimally. Although CMP radar sounding has been used to estimate average wave speed and thickness in ice sheets, based on the variation of echo arrival time with separation (see, e.g., Reference Jezek, Clough, Bentley and ShabtaieJezek and others, 1978, and references therein), we know of no previous study in which the variation of echo intensity has been used to probe an ice sheet.
The particular CMP data used here were acquired in 1994 by Jacobel and Gades (Reference Jacobel, Scambos, Raymond and A. M. GadesJacobel and others, 1996, Reference Jacobel, Scambos, Nereson and Raymond2000) 4 km southeast of the summit of Siple Dome (ice thickness 996 m, roughly at the location of the –4 km point in Figure 1). The transmitting and receiving antennas were both resistively loaded dipoles resonant at 3 MHz, placed parallel (i.e. broadside) on the snow at 11 separations ranging from 100 to 1100 m.
In its simplest form, our estimation method can be derived from the conventional radar equation for ice-sheet sounding (Reference Bogorodsky, Bentley and GudmandsenBogorodsky and others, 1985). In this initial analysis, we neglect the (small) effects of refraction and focusing in the firn (Reference Bogorodsky, Bentley and GudmandsenBogorodsky and others, 1985), and we assume that the power supplied to the transmitter, and the receiver response to voltage across its terminals, are identical for all separations. In this case (see also Fig. 3),
where 1(6) is the received echo intensity (defined as in the previous section) for the source/receiver separation corresponding to specular angle 6 and range to the bed R, Pt is the power input to the source antenna, G(θ) is the effective directional antenna gain in the ice accounting for both transmission and reception, 11(θ) is power reflectivity of the bed, and κH is the depth average of the (generally depth-dependent) power attenuation per unit length in the ice, κz) over the depth range 0–H, the ice thickness:

The depth-averaged attenuation coefficient appears in Equation (1) because the increment of power loss at each depth is multiplicative, i.e. additive in the argument of the exponential function. Because we neglect refraction in this analysis, the same depth-averaged attenuation coefficient applies for each source/receiver separation.

Although the power attenuation coefficient is the theoretically natural quantity, it is less intuitive than the common measure of absorption in units of dB km–1, Na, or the characteristic (e-folding) length of absorption, L a in units of meters. The depth-averaged versions of these quantities are related to κH in units of m–1 according to:

If attenuation is interpreted in terms of an effective conductivity, then a depth-averaged version of the effective conductivity can be naturally defined by a relationship analogous to that between the attenuation coefficient κ(z) at depth z and the effective conductivity at that depth: σ (Ω -1 m–1) = 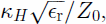 where ϵr is the real part of the relative permittivity of the ice and Z0 is the impedance of free space.
Our method relies not on absolute intensities, but rather on intensities normalized to that intensity observed at the shortest separation (corresponding to quantities in Figure 3 with subscript 1):

where we have written ranges to the bed, R and R 1, in terms of the ice-sheet thickness and the cosines of the propagation angles. Notice that the intensity ratio depends not on the individual values of bed reflectivities at the two angles, but rather only on their ratio. To use observations of the intensity ratio to infer κH, we must model the reflectivity ratio, as well as the angular dependence of the normalized (combined transmission/reception) gain. We assume that H and the cosines of θ and θ 1 are known (as they could, for example, easily be derived from timing data from the same CMP experiment that yields the intensity ratio data (Reference Jezek, Clough, Bentley and ShabtaieJezek and others, 1978)).
Based on the observations shown in the previous section, we propose perhaps the simplest model for the Siple Dome bed reflectivity ratio at 3–5 MHz, namely a coherent, Fresnel reflection from a sharp interface at the bed. While this model is likely to be appropriate only for exceptionally smooth beds (which may occur only rarely) and long radar wavelength, it is evidently consistent with our observations at Siple Dome. Figure 4 shows plots of the Fresnel power reflectivity of an ice/bed interface as a function of angle, for horizontal polarization (determined by the antenna configuration), assuming a relative permittivity for the ice of 3.2. The two curves correspond to differing relative permittivities of the bed: 10, corresponding to rock, for the lower curve, and 80, corresponding to liquid water, for the upper curve. Notice that although the magnitude of reflection differs greatly between the bed models, the “shapes” of the angular dependences are nearly identical. More precisely, the reflectivity ratio in Equation (4), for any θ1 close to zero, is very nearly independent of the dielectric contrast at the bed for the full range of physically plausible contrasts. Thus we can invert Equation (4) for κH, independent of whether the bed is wet or frozen, by using a simple functional fit (in practice, a second-order polynomial in cos(θ)) to the Fresnel reflectivity ratio.
For this initial work, we also assume that the gain pattern, G, for the resistively loaded dipoles on the snow surface is independent of angle. This assumption is certainly an oversimplification because of (generally complicated) near-field coupling between transmit and receive antennas in near-contact with the snow surface, particularly at the shorter separations in our dataset (Reference West and DemarestWest and Demarest, 1987; Reference MorseMorse, 1997). However, this assumption can be refined at the next stage of investigation and, based on the results below, is unlikely to greatly alter our results.
We proceed by rearranging Equation (4) to relate a synthetic dependent variable composed of intensity ratio observations and the other known or modeled ratios to a synthetic independent variable derived from the geometry of the CMP observation pairs.

where X is defined by

This equation can be stably inverted for κH by transforming it to

which is the equation of a straight line constrained (by the normalization) to pass through the origin. We fit a line to observed (X, Y) pairs in the least-squares sense. The stability of the estimated slope in the presence of noise is considerably increased by the constraint that the fitted line must pass through the origin. In this way we are able to estimate the effective absorption length scale in the ice using an uncalibrated radar over a bed of uncertain absolute reflectivity. In this simple version of our method, we have neglected, in addition to the relatively simple details noted above, any effects of anisotropic dielectric properties in the ice (Reference DoakeDoake, 1981; Reference FujitaFujita and others, 1999).
Figure 5a shows a plot of (X, Y) pairs for the CMP data described above. Repeated symbols at some values of X indicate repeated observations at the corresponding separation, without movement of antennas or other equipment; these repeated observations serve to indicate observational uncertainty due to environmental and system noise. Data points deviate from the fitted line by amounts similar to differences among repeated observations, suggesting that our approximations are at least roughly correct. The characteristic absorption length estimated from the slope of the fitted line is 124 m (corresponding to Na = 35 dB km– 1 , or a depth-averaged effective conductivity of σ = 3.81 x 10⁻⁵ Ω -1 m–1).
(a) Plot of (X,Y) pairs derived from Siple Dome CMP observations and our assumptions (denoted by *s) together with a least-squares linear fit. (b) Plot of observed ratios of echo intensities vs separation (denoted by *s), together with the prediction according to Equation (4) and our estimated absorption length and assumptions.

Figure 5b shows the predicted relationship between echo intensity ratios and separation based on our estimate of absorption length. Note that the intensity ratios are purely observations and involve no assumptions or modeling. Thus our inversion yields a self-consistent result.
4. Profile-Based Estimation of Attenuation
Because ice thickness on Siple Dome varies significantly over a homogeneous bed (Reference Gades, Raymond, Conway and JacobelGades and others, 2000), we can estimate κH in a nearly independent way by analysis of the observed relationship between bed echo intensity and ice thickness in conventional radar profile data (Catania and others, 2002).
Figure 6 shows the observed relationship between received bed-echo intensity (defined as in section 2, in unnormalized units of voltage squared) and travel time to the bed (which is converted to ice thickness assuming a wavespeed of 170 m μs–1) for the radar profile shown in Figure 1. (These data are the basis on which Reference Gades, Raymond, Conway and JacobelGades and others (2000) computed their measure of apparent bed-reflected power, BRPR . We now assume that BRPR is in fact constant across the full range of data used here, and analyze the variation of received power to estimate κH.) If the absorption length scale is also assumed to be constant across the Dome, data from different points on the profile differ only in the path length of propagation and associated geometrical spreading. Then the ratio of intensities I and I0 from differing profile points for which travel times to the bed are t and t0, respectively, is given by:
Apparent reflected bed intensity vs travel time to the bed, or effectively distance. Fitting a model for the ratio of intensities at two travel times (thus cancelling system gains, etc.), we obtain an estimate of 168 m for the characteristic absorption length.


where c is the wave speed in the ice. Notice that antenna gain patterns cancel entirely in this case, and thus uncertainties in those patterns are of no consequence.
To estimate κH we rearrange Equation (8) into the form I = (C/t2)exp(-2κHct) and use a grid-search algorithm with the unnormalized data in Figure 6 to find values of κH and the constant C that minimize the rms difference between this model and our data. The resulting estimate of the characteristic absorption length is 168 m (corresponding to Na = 26 dB km–1 , or a depth-averaged effective conductivity of σ = 2.81 x 10⁻⁵ Ω -1 m–1).
5. Discussion
The difference of 44 m between our two estimates is roughly an order of magnitude smaller than the range of absorption lengths reported for polar ice sheets (Reference Bogorodsky, Bentley and GudmandsenBogorodsky and others, 1985; Reference Shabtaie, Whillans and BentleyShabtaie and others, 1987). We view this level of agreement as encouraging, in view of the facts that none of the observations used here were intended for the estimation of attenuation and that our initial CMP analysis neglects some corrections and any effects of dielectric anisotropy in the ice.
Anisotropy could affect results of our two methods quite differently: Our profiling observations are all made at essentially nadir incidence, i.e. using propagation directions that differ little from the principal direction of radio-frequency anisotropy expected from strains beneath an ice dome (Reference FujitaFujita and others, 1999; Reference Thorsteinsson, Waddington, Taylor, Alley and BlankenshipThorsteinsson and others, 1999). Although the strength of strain-induced anisotropy may vary across Siple Dome, the orientation of profiling observations appears likely to minimize any effect of anisotropy. Our CMP observations at the summit, however, employ propagation paths off nadir at a number of angles ranging out to roughly 45° (Reference HargreavesHargreaves, 1977, Reference Hargreaves1978; Reference DoakeDoake, 1981). Conversion between polarization modes for such propagation paths could significantly alter our echo intensities. The level of agreement we observe, however, suggests that, at least at Siple Dome, the magnitude of any such effects is at most about 30%. Moreover, our two methods sampled ice of possibly significantly differing temperatures: The depth-varying attenuation coefficient at depth z, κ(z), is proportional to the loss tangent, tan δ, at that depth. The loss tangent varies strongly with temperature T near the melting temperature, Tm, (according to a relationship of the form  where A and B are constants). The basal temperature beneath Siple Dome summit is approximately 271 K, and temperature in the ice sheet decreases almost linearly with height to 248 K at the ice-sheet surface (H. Engelhardt, http://skua.gps.caltech.edu). Thus the depth-averaged attenuation coefficient, κH, is controlled largely by the warmer, near-basal temperature. Ice on the flanks of the Dome is thinner, and therefore likely to be colder and less attenuating near its bed, than ice near the summit where the CMP observations were made. Our observation of a lower attenuation in the profiling observations is qualitatively consistent with this effect, and because this mechanism must almost certainly account for part of our discrepancy, it further limits the possible effects of dielectric anisotropy.
Quantification of these final observations is clearly required, and can be expected to yield insight into both dielectric anisotropy in the particular flow environment of Siple Dome and the temperature dependence of attenuation. The next step in our analysis is therefore inclusion of corrections for antenna effects and analysis of differing results from the two methods in this light.
Acknowledgements
We thank R.W Jacobel for providing CMP observations from Siple Dome and for valuable discussions, and C. R. Bentley for additional helpful discussion. This work was supported by the Nasa Earth Science Enterprise, grant NAG5-10225.



