Introduction
It is difficult to evaluate the quality of the performance of a health care system during a disaster. Research instruments may be not available, not validated, or impossible to administer during a crisis. Although descriptive performance evaluations often are administered post-disaster, specific disaster research is rare, and often limited in scope.Reference Sundnes and Birnbaum1–Reference Harten van, Bierens and Welling4 On the other hand, disaster exercises are commonplace throughout the world and serve as a major education and training tool. The question arises whether exercises can be used to evaluate whether certain instruments can be applied to disaster research. If disaster exercises can be used as a proxy environment to evaluate the feasibility of potential research instruments, they should play an important role in the development of a research agenda for scientific analysis of health care performance during or immediately after a disaster-producing event.
The purpose of this study was to investigate the utility of questionnaires and chart reviews to assess the performance of incident command, patient flow, quality of patient distribution, and tertiary hospital capacity during a national disaster exercise.
Methods
This is a retrospective, mixed methodology study, using questionnaires and chart reviews from a national disaster exercise named “Bonfire.” The exercise was organized by the Ministry of the Interior and Kingdom Relations in the Netherlands, with the main objective to practice the decision-making process within the full Incident Command System (ICS) structure at national (including the Prime Minister), regional and local levels.5 The event initially was planned to be an unannounced exercise, but three weeks before the date of the exercise, the ban on informing all stakeholders that the exercise was planned was waived. This unexpected opportunity allowed the Principal Investigator to inform the Ministry at extremely short notice that the exercise represented an unparalleled study platform for evaluating the utility of potential disaster research instruments. Permission and finances were granted within 10 days, at which time the research design preparation commenced. The Ministry stipulated that at no time would the research studies interfere with the exercise process, and that no research observers would be allowed at the exercise locations, with the exceptions of the hospital Emergency Departments.
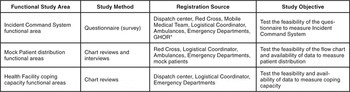
Due to these Ministerial restrictions, the final research proposal had to be limited to three, free-standing, functional areas. Chosen for study were: (1) incident and command locations; (2) mock patient distribution points; and (3) Emergency Departments of health facilities. Each functional area studied different participants/providers in the exercise (Table 1).
Main characteristics of the three functional study areas (* GHOR = the organization responsible for medical assistance in accidents and disasters in the Netherlands)

In each functional area, different data acquisition instruments were used. A five-point Likert scale questionnaire was used to study the ICS; common registrations (chart reviews) were used to study both mock patient distribution and health facility coping capacity.
The data was transferred into an SPSS for Windows database, version 16.0.0.1 (SPSS Inc., Chicago, Illinois, USA) by an independent data typist and cross-checked by the Primary Investigator. The statistical processing included the calculation of median and mode scores.
The Ethical Committee of the Vrije Universiteit (VU) (Free University) Medical Center was informed of the study objectives and methods, and declared that no formal permission was needed.
Exercise Event Scenario
At 12:30 hours, a bomb explosion in one of the largest multi-purpose stadiums in the country (capacity of 68,000 visitors) set a cascade of events into motion. In the stadium, approximately 10,000 spectators were attending a concert. Of these, 600 were instructed to simulate mildly injured persons (triage classification T3). An additional 140 trained mock patients were placed inside the stadium, where they simulated severely wounded patients (triage classifications T1 and T2). The Dutch triage system is similar to the four-category systems used in other countries. Patients in the first category (T1) require immediate care, without which they will not survive; patients in the second category (T2) require constant observation and urgent treatment, but are not in immediate danger; patients in the third “walking” category (T3) have minor or no visible injuries. The last category (T4) is special and generally reserved for wartime use or after mass-casualty events. Patients in the T4 category cannot be helped adequately given the current situation, i.e., the limited number of critical patients who can be successfully managed. Occasionally, T4 is used to denote the deceased.
Only T1 and T2 patient classifications were included in this study. Timeslots, based on defined timetables, were used to simulate treatment and waiting times for transport to the operating room, intensive care unit, or ward for each patient.
Incident Command System Functional Area
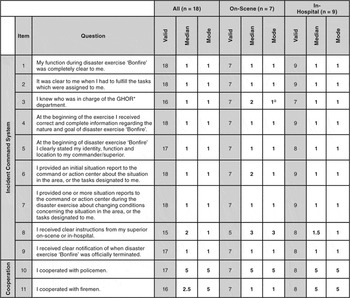
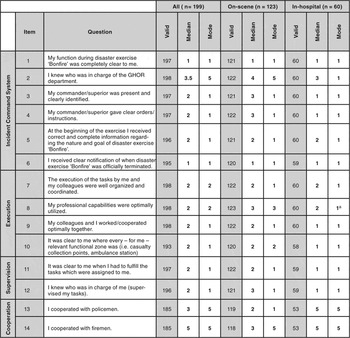
The research instrument consisted of two ICS questionnaires for commanders and non-commanders. Both questionnaires were based on existing ICS questionnaires,Reference Thomas, Hsu and Kim7 which were translated from English into Dutch, and adapted to the national structure and glossary of disaster management.Reference Dib, Naderi and Sheridan8,Reference Juffermans and Bierens9 Due to this adaptation and translation, slight modifications may have arisen in comparison with the original questionnaires. Two items relating to multidisciplinary cooperation were added, because this concern had been identified as a potentially significant and relevant problem during recent disasters in the Netherlands.Reference Welling, Harten van and Patka10 The questionnaire for commanders was tested and finalized by six subject matter experts. Remarks on the draft questionnaire for commanders were also included in the questionnaire for non-commanders since most questions were similar. The questionnaires for commanders and non-commanders consisted of 11 and 14 items, respectively (Table 2 and Table 3).
Results from the questionnaire for the commanders (On the five-point Likert scale, 1 = completely agree; 5 = completely disagree; a = two modes, both 1 and 2 reported in equal amounts; number of valid items refer to the amount of included items in the final dataset. empty or incorrect (≥1 answer) answers were excluded; * GHOR = the organization responsible for medical assistance in accidents and disasters in the Netherlands)

Results from the questionnaire for the non-commanders (NQC) (On the five-point Likert scale 1 = completely agree; 5 = completely disagree; a = two modes, both 1 and 2 reported in equal amounts; number of valid items refer to the amount of included items in the final dataset. Empty or incorrect (≥2 answer) answers were excluded; * GHOR = the organization responsible for medical assistance in accidents and disasters in the netherlands)

Each on-scene participant received the questionnaire with instructions in a lunch box provided during the exercise. At the location of the debriefing, four students, who had been instructed and trained for these assigned duties, collected the anonymously completed questionnaires. The commanders, deployed in the Strategic Command Center (off-limits to research personnel), received the questionnaire by e-mail.
In-hospital participants (Emergency Department and Crisis Control Units) were contacted in person by the research-trained students and requested to complete the questionnaire immediately after the disaster exercise ended. All items of the questionnaires were scored on an ordinal five-point Likert scale. Scores which were recorded ambiguously were excluded.
Mock Patient Distribution Functional Areas
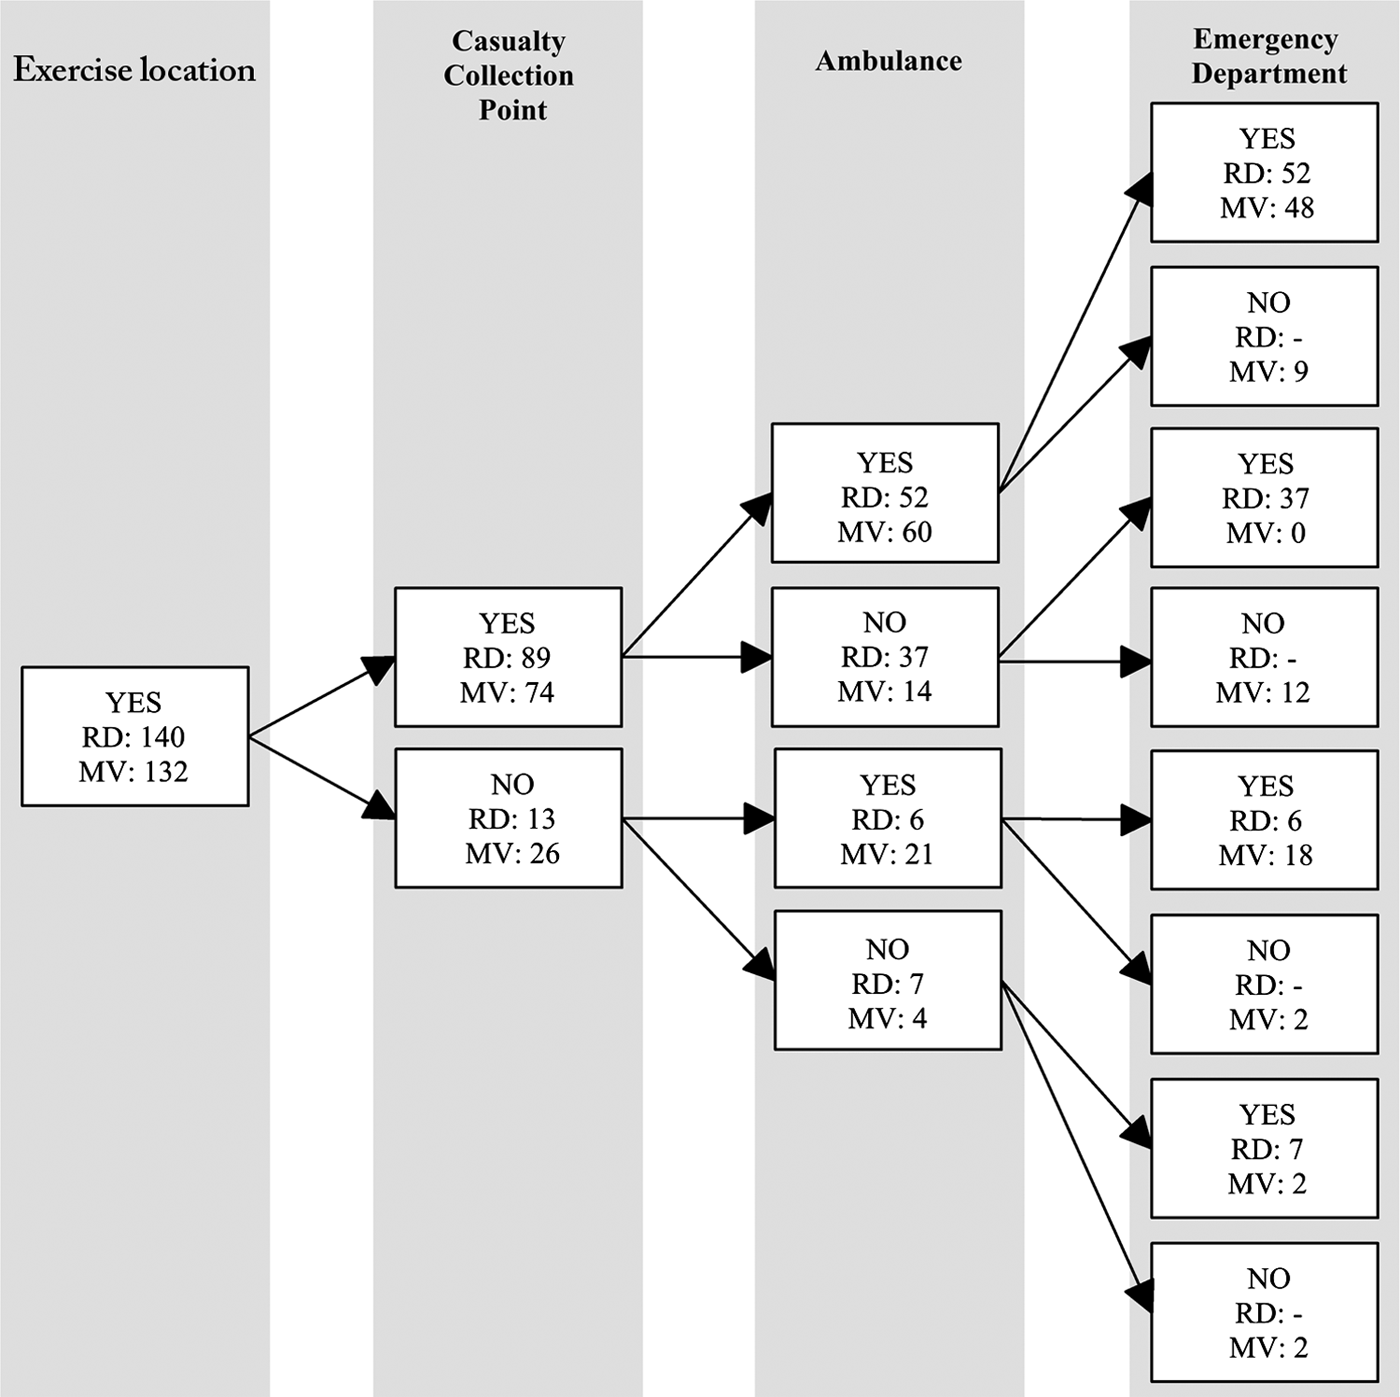
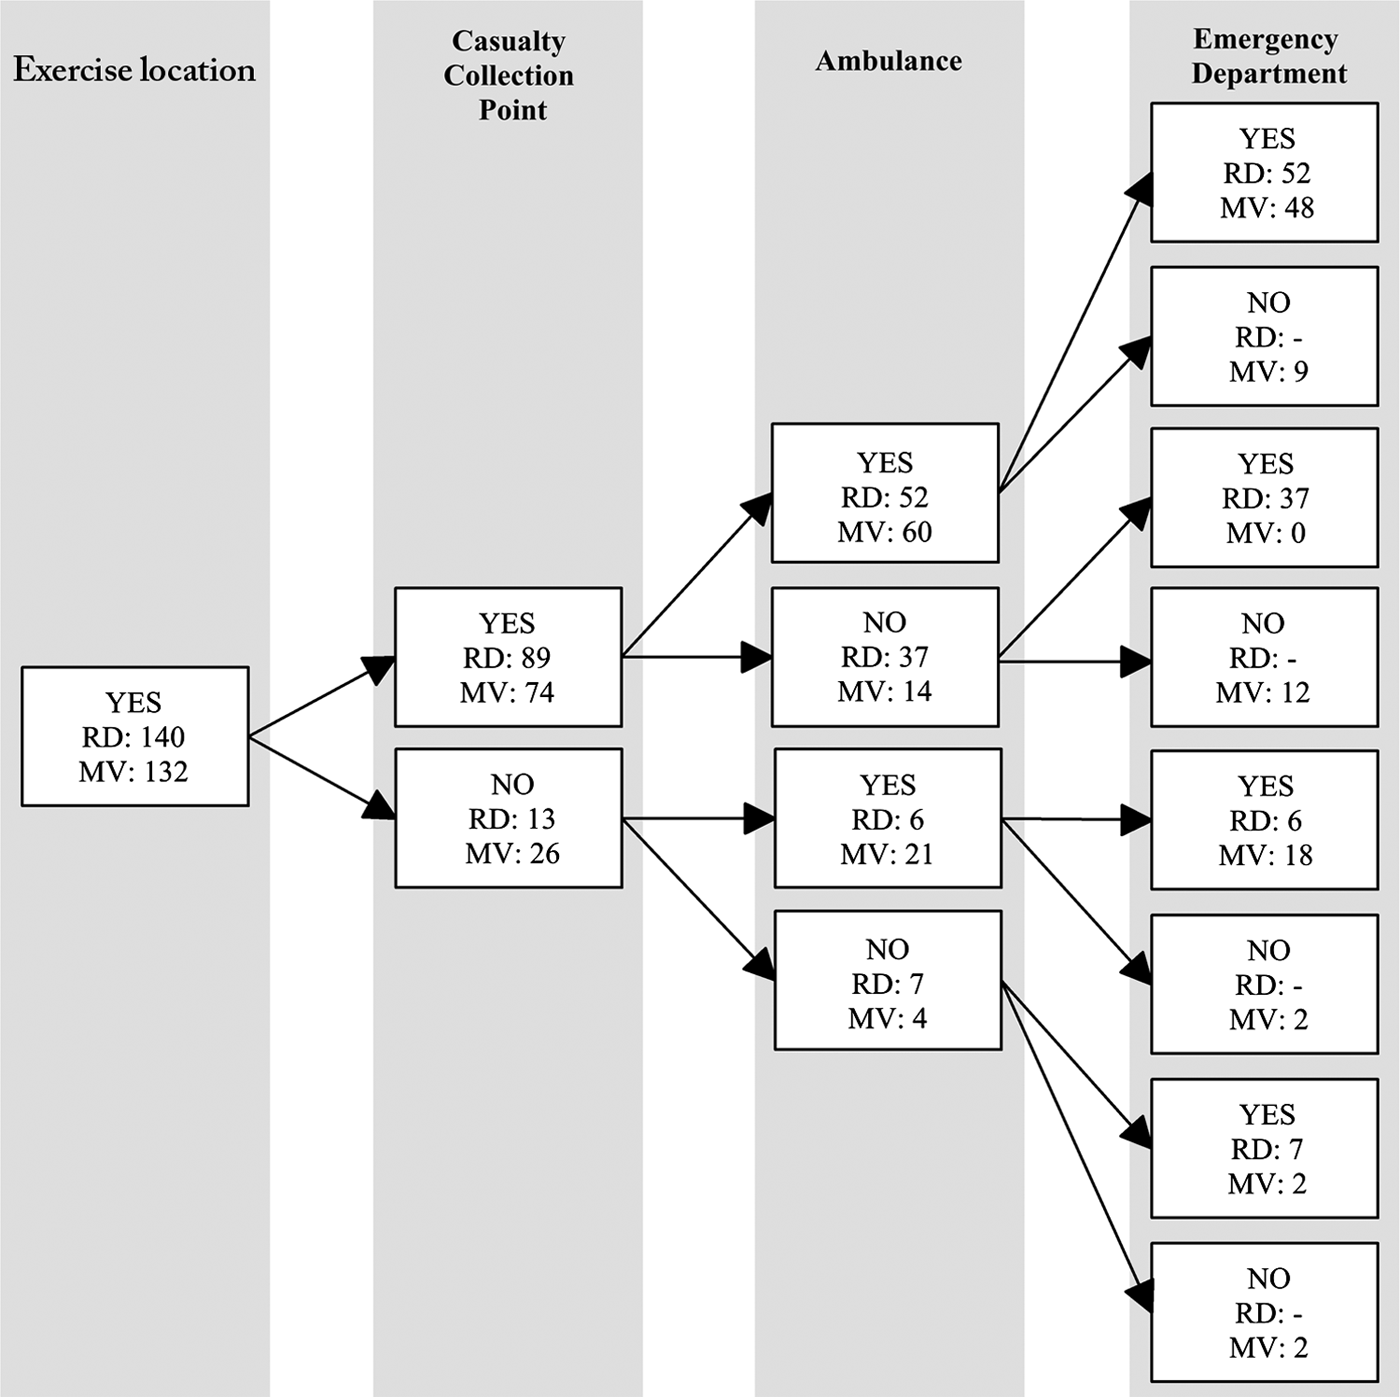
The working hypothesis was that three patient contact points (casualty collection point, ambulance, and hospital Emergency Department) characterize patient distribution, and that collecting logistical and clinical data at these points using a designated flow chart would facilitate evaluation of the quality of patient distribution. The assumption was that patient distribution could be traced by reviewing the data available on triage, ambulance, and Emergency Department admission charts. Based on this hypothesis and assumption, a flow chart with eight potential routes of patient distribution to a hospital was constructed (Figure 1). Two methods of control were used to monitor the accuracy of the data on the charts: (1) data provided by the logistical coordinator; and (2) data provided by the mock patients. All data from the casualty collection points, ambulances (tagged to the patient), and hospitals were collected at the two participating Emergency Departments by students, who had been instructed and trained for these assigned duties. Data from the Logistical Coordinator were collected after the exercise by one research student, who had been instructed and trained for this assigned duty. All mock patients were requested by the team leader to identify and verify the route they followed. The team leader was instructed regarding how the mock patients should identify and verify the route they followed; these instructions also were available on the flow chart that each mock patient completed.
Flow chart of patient distribution based on data from casualty collection point, ambulances, and the Emergency Department (RD = Research Data from triage charts, exercise location and Emergency Department charts; MV = Mock Patient data collected from mock patients; data of 25 mock patients who were not admitted to the Emergency Department at the end of the exercise have been included)
The study was designed to (1) evaluate whether the flow chart in Figure 1 can be used as a research instrument to study patient distribution (i.e., to test the hypothesis); and (2) evaluate whether the registered data were suitable to study the adequacy and quality of patient distribution. Before the exercise, arrangements were made with the Ministry officials to ensure access to all documents and data for the study.
Health Facility Coping Capacity Functional Areas
Another intent of this study was to analyze the appropriateness of Trauma Center Emergency Department admission charts as potential research instruments to measure health facility coping capacity. Within the Dutch Structure and Glossary of Disaster Management, coping capacity is defined as the number of category T1 and T2 patients that simultaneously can be treated in a hospital within 60 minutes.Reference Debacker and Bierens11 Both participating hospitals were university Trauma Centers with Level 1 Trauma Center status, and a capacity of 733 and 1,002 total beds, respectively. Hospital disaster plans of the two participating hospitals indicated that their coping capacity was 23 and 28 patients per hour, respectively. Exercise officials ensured access to all Emergency Department documents.
Results
Incident Command System Functional Area
A total of 217 health care workers participated in this study: four in the dispatch center; 94 in 62 ambulances; six in two mobile medical teams; 69 in the Emergency Departments; six disaster health officials; 19 disaster health workers; and 19 disaster health support personnel. A total of 18 commanders and 199 non-commanders completed the questionnaire. Two hundred seventeen participants were successfully contacted: 18 commanders (seven on-scene, nine in-hospital, and two unknown) and 199 non-commanders (123 on-scene, 60 in-hospital, and 16 unknown). Ninety-five percent of the data from commanders and 98% from non-commanders were considered eligible for analysis. Data were considered ineligible if no, or ≥ two answers were given.
The data listed in Table 2 indicate that commanders (both on-scene and in-hospital) were positive regarding all nine aspects of the ICS during the exercise, but were negative regarding multidisciplinary cooperation with policemen (both on-scene and in-hospital commanders) and firemen (in-hospital commanders).
Non-commanders (both on-scene and in-hospital) responded positively on nine of 14 items questioned (Table 3). On-scene, non-commanders responded neutrally (median and mode scores = 3) to item 8 regarding optimal utilization of their professional capabilities. There were a total of four negative responses: (1) on-scene commanders’ rating of items 2 and 14, and (2) both on-scene and in-hospital commanders responded negatively to item 13 on cooperation with firefighters (Table 3).
Mock Patient Distribution Functional Areas (Flow and Quality of Distribution)
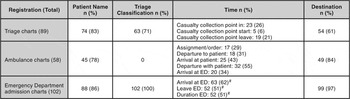
The availability of data at the three points of mock patient contact is shown in Table 4. A total of 102 mock patients reached the two participating hospitals. Triage charts were available on 89 (87%) of those who were transported to and treated in the hospital. Fifty-eight ambulance charts were available (57%), and Emergency Department admission charts were available for 102 (100%) of mock patients. The combination of available data for the tracking of 52 mock patients (51%) who participated and arrived at one hospital are graphically represented in Figure 1. This figure also depicts the discrepancies between the patient distribution as recorded in the registrations and the patient distribution recorded by the mock patients. The exercise Logistical Coordinator recorded 120 ambulance transports. Identification numbers and destination of the ambulance were available in 97% and 96%, respectively. However, mock patient data (name and/or triage chart number) and time data were available in only 32% and 18% of the cases.
Available data/registrations on patient distribution (* = minimum; # = excluding 6 no-play victims a = based on the total amount of patients treated)

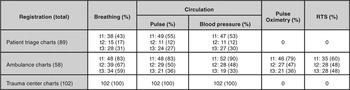
The logistical and clinical data on the quality of mock patient distribution were lacking in the vast majority of triage, ambulance, and Emergency Department admission charts (Table 5 and Table 6). Time data were under-reported in all charts, with the exception of charts from one participating hospital. Clinical data were under-reported, except in charts from the patient triage and ambulance areas at both hospitals. Pulse oximetry data were reported inconsistently; measurement data were available in ambulance charts, but not available on triage and Emergency Department admission charts. In general, the clinical data from the Trauma Centers were complete and consistent.
Availability of logistical data at three points of patient contact (# = In one Emergency Department, data were registered in all 52 cases/patients (100%). This Emergency Department also noted time data when the patient was dismissed. In the other Emergency Department, time data were registered in only 11 of 50 patients (22%).)

Availability of clinical parameters on the three forms that are available to study the quality of the patient distribution (RTS = Revised Trauma Score; t1 = at first contact, t2 = intermediate contact, t3 = last contact)

Health Facility Coping Capacity Functional Areas
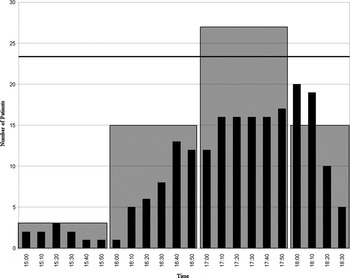
The number of mock patients who were present simultaneously in the Emergency Department of one hospital in time frames of 10 minutes and one hour are shown in Figure 2. In one hospital, the anticipated coping capacity was 23 patients/hour. The data indicate that during one hour (1700 to 1800h) there were four more patients (17%) treated than were predicted. However, when analyzed by 10-minute intervals, stagnation of patient flow occurred, and the number of patients simultaneously presenting in the Emergency Department varied between one and 20 during 10 minute periods. Data on coping capacity of the second hospital during the disaster exercise were not available because the times of admission and discharge were not registered.
Graphic representation of mock patient distribution at one participating hospital (Wide bars = number of patients simultaneously treated in the Emergency Department during a one hour period (coping capacity); narrow bars = number of patients simultaneously treated in the Emergency Department (time intervals of 10 minutes); line = hospital coping capacity in one hospital (23 patients/hour))

Discussion
This study demonstrates that a disaster exercise presents an important opportunity to prepare, test, and improve research to evaluate the medical management of victims in a real event. The results suggest that relevant data for research purposes can be obtained immediately after a disaster using the investigated ICS questionnaire, patient information, and charts. It also was learned from testing during an exercise that minor adaptations can improve the questionnaire as discussed below. Although the flow chart studied probably can be used, the current registration formats and the low quality of the charted data do not allow study of the flow and adequacy of patient distribution. Clearly, registration forms must be improved and relevant data must be charted before a research instrument for the evaluation of patient distribution can be applied appropriately. The instrument used to study the coping capacity of Emergency Departments is useful when simple data such as admission and discharge times are available, but provides limited information on the bottlenecks in surge capacity.
It is evident that some aspects of the ICS were perceived differently by commanders and non-commanders, both on-scene and in-hospital. The finding that on-scene non-commanders did not know who was in charge, while in-hospital non-commanders did, was unexpected. On-scene non-commanders have been trained in the Command and Control structure, while in-hospital non-commanders have no direct link to the command structure. This finding suggests that one or both groups may have interpreted the question incorrectly, and this deserves reassessment and possible revision of the questionnaire. The negative answers concerning the multidisciplinary cooperation between the in-hospital groups and police and firefighters are consistent with the scenario of this exercise, in which there was no requirement for multidisciplinary cooperation. These findings support the need for revision of the question concerning who was in charge.
Results regarding current, formal registration systems for patient tracking and patient distribution were less favorable. Only half of the patients could be tracked, even when triage, ambulance, and hospital charts were combined. This was due to incomplete registration on the patient triage charts, and on the forms used by the ambulance services. Data from the Logistical Coordinator, which in itself should allow tracing of all patients, proved to be unusable for this task because various essential data were missing. In addition, information from the mock patients was not reliable. The finding that patient distribution cannot be studied is worrisome, not only from the perspective of disaster research, but also from the broader planning perspective. Identical practical problems may occur when the patient distribution process is studied during an actual disaster. If patient distribution cannot be measured by the three available contact points (combination of registrations, registration by the person in charge of patient distribution, registration by the patients themselves), obtaining quality measurements, and thus improvement of patient distribution, is a major concern.
Problems with tracking patients due to communication and transport factors during disasters and disaster exercises have been reported.Reference Arnold, Paturas and Rodoplu12–Reference Joy and Kemp14 Even with most modern Information and Communication Technologies (ICT) in a controlled military environment, tracking of patients appears to be a problem.Reference Walderhaug, Meland and Mikalsen15
The concern becomes even greater in relation to the lack of data to evaluate the quality of the patient distribution. On the available triage charts, most of the data were missing. Triage, ambulance, and Emergency Department admission charts do not collect identical parameters, or they use different definitions for the same parameters. This causes inconsistencies, which make it nearly impossible to estimate the quality of patient distribution. Data provided by the mock patients deviated largely from registered data on the triage, ambulance, and Emergency Department admission charts, and could not be used to study patient distribution. Real patients may be even less reliable in providing data to assess how well the patient distribution system has worked.
Measuring the coping capacity of one hospital was feasible because the times of Emergency Department admission and discharge were registered. The differences between the patients simultaneously present in time frames of 10 minutes and one hour point to an arbitrary definition of coping capacity. The smaller time intervals gave more precise information on the large fluctuations in patient presentation rates.
This study confirms that lessons can be learned from testing potential research instruments during disaster exercises. Integration of the instruments tested in this study with other quality measurement tools is an important next step. Also, hypotheses can be tested during disaster exercises staged as experimental settings. The current study would have benefited from earlier consultation to facilitate better coordination between study design and disaster exercise planning to optimize the research potential.Reference Kulling, Birnbaum and Murray3,Reference Harten van, Bierens and Welling4,Reference Juffermans and Bierens9
Overall, the results of this study added to the understanding of why research during disasters is problematic, and sheds a light on the potential for and problems with disaster research during exercises. The lack of data hampers disaster research, even in the artificial setting of a national disaster exercise. Proactive disaster research instruments are needed, and good information documentation by field workers is essential. Unfortunately, disaster health researchers have limited access to the mechanisms and policies that can improve the quality of documentation by field workers. Because appropriate charting during disaster exercises can result in better information during real disasters, policymakers should work to increase field workers’ awareness of the need for quality registration data.
Limitations
The study design, conceived under great time pressure, would have benefited from more reflection and attention to detail. The original objective of the study was to investigate potential research instruments for use in the disaster setting. In reality, most of the questionnaires and charts that could be used as data sources for research had been tested.
Instructions to the students and mock patients, as well as the compliance of the participants, appeared not to have been negatively influenced by the short preparation period, nor did it adversely influence the research design preparedness of the three functional areas of study. However, if more time had been available, the studied functional areas might have been designed so that data from each area could be compared to data from the others, and the ICS questionnaires could have been validated.
Advance planning of disaster exercises and the roles of all participants are somewhat theoretical, and this limits the validity for predicting what might occur during an actual event. It is unclear if this has positively or negatively influenced the quantity and quality of the data. The lack of direct observation by the researchers may have had a negative effect on the quality of data in relation to Command and Control, patient distribution, and hospital coping capacity. On the other hand, the presence of observers might have influenced the behaviour of the participants.
In the ICS functional area, it was not possible to establish the exact participation rate due to deviations in the planned scenario. However, based on the original scenario, it is estimated that data of 90% of prehospital, and close to 100% of in-hospital professionals could be retrieved. The testing and validation of the questionnaire for non-commanders had to be waived; however this questionnaire was largely similar to the tested questionnaire administered to the commanders. The questionnaire studied uses a qualitative technique based on subjective information and may include bias. Objectively measurable parameters would further improve the value of assessing ICS performance.Reference Thomas, Hsu and Kim7
In the mock patient distribution functional area, the lack of data was problematic and did not allow validation of the flow chart. It was not possible to explain the differences between the registered data and mock patient data, despite the fact that the mock patients had received clear instructions from their leader as well as on the printed forms.
In the health facility coping capacity functional area, analysis was limited because some data were not available. Only one of the hospitals had a basic set of data available. This hospital used custom-designed forms created by hospital staff. These forms, and a rigid method of registration, resulted in one proper set of data. It was not possible to study the bottlenecks in the surge capacity at either hospital. Finally, this study was not designed to study whether improvements could be made in disaster site planning, nor was it designed to evaluate the exercise itself.
Conclusions
This study supports the use of research instruments such as questionnaires and charts for evaluations during disaster exercises. The questionnaires utilized appear to have generated some usable information regarding ICS performance. However, it was not possible to study patient flow and the quality of patient distribution, due to lack of data or incomplete data in the charts used. It is worrisome that such an essential element of disaster performance management has eluded study. Coping capacities can be measured more precisely when 10-minute intervals are assessed. This study also demonstrated insufficient compliance by participants in regard to data registration during an exercise. More research is needed to understand whether the inclusion of potential research instruments in disaster exercises can advance the quality of the health management of future disasters.
Abbreviations:
ICS = Incident Command System
ICT = Information and Communication Technologies