INTRODUCTION
Application of cattle slurry (CS) to agricultural soil supplies nitrogen (N) in the form of ammonium (NH4 +), which can be oxidized to nitrate (NO3 −) by nitrifying microorganisms. Since NO3 − is mobile in soil, it is easily lost to the groundwater, which has human health implications and can promote eutrophication of surface waters (Galloway & Cowling Reference Galloway and Cowling2002). The nitrification process and subsequent denitrification of the NO3 − produced also contribute to nitrous oxide (N2O) release to the atmosphere, with effects on climate change and stratospheric ozone depletion (Montzka et al. Reference Montzka, Dlugokencky and Butler2011). There have been increased political efforts in recent years to decrease NO3 − leaching and N2O emissions, e.g. through the EU Water Framework Directive (2000/60/EC) (EU 2000) and the Kyoto Protocol (United Nations 1998). Furthermore, the rising costs of N fertilizers have increased the commercial incentive for farmers to limit N losses. Nitrification inhibitors are compounds which slow the conversion of NH4 + to NO3 −, thereby reducing losses of reactive N such as NO3 − and gaseous N compounds such as nitric oxide (NO), N2O and N2 (Chien et al. Reference Chien, Prochnow and Cantarella2009; Richardson et al. Reference Richardson, Felgate, Watmough, Thomson and Baggs2009). However, it is essential to determine whether they have any non-target effects on the soil system. There is a lack of studies on if, and to what extent, nitrification inhibitors affect gross N transformation processes in the soil other than nitrification.
While net N rates provide an indication of plant N availability in soils, gross N rates provide an understanding of the underlying N transformations with the individual processes producing and consuming N in the soil. One of the main advantages of 15N tracing studies is that process-specific N transformation rates can be quantified (Müller & Clough Reference Müller and Clough2013). The cycling of mineral N between organic and inorganic pools, which does not necessarily lead to changes in net mineralization or immobilization, is known as mineralization–immobilization turnover (MIT) (Bjarnason Reference Bjarnason1987).
One of the most commonly used nitrification inhibitors is dicyandiamide (DCD) (Chien et al. Reference Chien, Prochnow and Cantarella2009), which inhibits nitrification by deactivating the ammonia monooxygenase (AMO) enzyme of ammonia oxidizing bacteria (Amberger Reference Amberger1989). Work in New Zealand in the last decade has focused on the development of a field application technique to grazed grasslands (Di & Cameron Reference Di and Cameron2004) with the aim of reducing both N2O emissions (Di & Cameron Reference Di and Cameron2006) and NO3 − leaching (Di & Cameron Reference Di and Cameron2005). It has been claimed that the soil microbial biomass is not affected by DCD (Zaman et al. Reference Zaman, Saggar, Blennerhassett and Singh2009; Guo et al. Reference Guo, Di, Cameron, Li, Podolyan, Moir, Monaghan, Smith, O'Callaghan, Bowatte, Waugh and He2013), but there have been studies indicating that DCD can increase net immobilization of mineral N (Juma & Paul Reference Juma and Paul1983; Guiraud et al. Reference Guiraud, Marol and Thibaud1989; Williamson et al. Reference Williamson, Menneer and Torrens1996) or net N mineralization (Gioacchini et al. Reference Gioacchini, Nastri, Marzadori, Giovannini, Antisari and Gessa2002).
The objectives of the present study were to (1) identify the dominant gross N transformation rates in different grassland soils, (2) determine to what degree DCD application affected gross NH4 + oxidation and (3) determine if DCD application had non-target effects, i.e. effects on gross N transformations other than NH4 + oxidation.
MATERIALS AND METHODS
Soil properties and experimental setup
A microcosm incubation experiment was established under controlled conditions (15 °C, 70% relative humidity (RH)). The temperature corresponded to the average long-term (1981–2010) soil temperature (0–10 cm) in Ireland from the end of May to the beginning of June, a time when CS is often spread following the first harvest of silage. Soil was collected from the upper 7·5 cm from three grassland field sites (predominated by Lolium perenne) across Ireland. The sites were: a luvic gleysol at Johnstown Castle (JC), County Wexford, Ireland (52°18′N; 6°30′W); a haplic cambisol at Moorepark (MP), County Cork, Ireland (52°17′N; 8°23′W); and a eutric cambisol at Hillsborough (HB), County Down, Northern Ireland (54°46′N; 6°08′W). According to the texture analysis of the upper 7·5 cm, all three soils fell into the ‘loam’ category (US Department of Agriculture 2013).
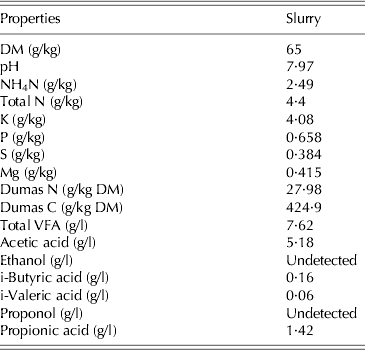
The soils were passed through a 12·5 mm sieve and pre-incubated for 5 days (15 °C and 70% RH), to reduce the number of seeds germinating during the experiment. After the pre-incubation, soils were sieved to 6·7 mm and partially air-dried at room temperature until they reached a water content of 0·3 g/g dry weight (DW). A fresh weight equivalent of 175 g dry matter (DM) of soil was packed into acid-washed 500 ml Ravenhead Kilner® jars to obtain a bulk density of 0·88 g/cm3 and a soil porosity of 65%. The microcosms were covered in Parafilm® (pierced with ten pin pricks) and incubated for 3 days under the experimental conditions (15 °C and 70% RH) prior to the commencement of the experiment. Dairy farm CS was collected at JC, homogenized by blending in a mechanical blender and sieved (2 mm). Analysis of the CS for pH, DM, volatile fatty acids (VFAs) and macronutrient content (Table 1) was carried out as described in McGeough et al. (Reference Mcgeough, Laughlin, Watson, Müller, Ernfors, Cahalan and Richards2012).
Properties of the CS applied
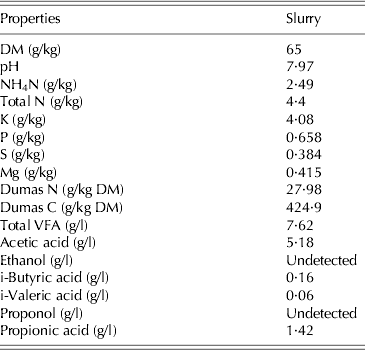
DM, dry-matter; VFA, volatile fatty acids.
15N tracing design
To enable determination of several simultaneously occurring gross N transformation rates, either the NH4 + (15NH4NO3) or the NO3 − (NH4 15NO3) pool was labelled at 40 atom% 15N enrichment, in paired microcosms. To determine fungal : bacterial (F : B) ratios by phospholipid fatty acid (PLFA) analysis an additional microcosm receiving unlabelled solution was set up for each pair of labelled microcosms. In summary, there were two experimental treatments (CS with (+DCD) and without (−DCD)), each with three 15N label combinations (15NH4NO3, NH4 15NO3 and non-labelled). The experiment was arranged as a randomized block design with three replicates, with one set of microcosms (18 jars) prepared for each sampling time, to allow for destructive sampling. Replicates were randomly assigned to three different blocks, which were located at three different heights in a controlled environment chamber, to account for possible temperature differences. Application of treatments to the three blocks took place on 3 consecutive days. For each jar, 6 g (fresh weight) of CS was weighed into a plastic container and an aliquot of treatment solution was prepared, containing labelled or unlabelled ammonium chloride (NH4Cl) and potassium nitrate (KNO3) to obtain final concentrations in the microcosms of 148 μg NH4 +–N/g DW and 100 μg NO3 −–N/g DW. For the DCD-treated microcosms, DCD was added to the treatment solution at a rate of 15% of the total amount of NH4 +–N applied. Directly before application, the treatment solution and the slurry were combined, shaken by hand, and the mixture was evenly applied to the microcosm surface. After treatment, all microcosms had a water-filled pore space of 65%, allowing both nitrification and denitrification to proceed (Linn & Doran Reference Linn and Doran1984). Microcosms were incubated in the dark. The water content of the microcosms sampled for PLFA analysis was measured gravimetrically at the end of the incubation which showed that water loss was negligible throughout the study. The 15N-labelled microcosms were destructively sampled for analysis of soil mineral N (NH4 + and NO3 −) and 15N enrichment over seven sampling times within a 20-day incubation period (0 h, 5·5 h, 2, 6, 10, 15 and 20 days). Samples for PLFA analysis were taken in triplicate from the three soils before amendment and the microcosms for PLFA analysis were sampled immediately after amendments and at days 10 and 20. The samples were flash frozen in liquid N, kept at −80 °C and freeze dried at −57 °C (Scanvac CoolSafe 55-4, Lynge, Denmark).
Mineral N analysis
For the analysis of NH4 + and NO3 − contents, each microcosm was extracted by adding 350 ml 2M potassium chloride (KCl). Microcosms were hand-shaken immediately after KCl addition and placed on a rotary shaker for 1 h. An aliquot of the suspension was centrifuged at 4302 g for 10 min, filtered through a Whatmann GF/D glassfibre filter and stored at 4 °C until analysis. A subsample of the extract was analysed for NH4 + and NO3 − concentrations using a Skalar San Plus automated wet chemistry analyser (Skalar Analytical B.V., Breda, Netherlands). Ammonium and NO3 − in two other subsamples were converted to N2O (Stevens & Laughlin Reference Stevens and Laughlin1994; Laughlin et al. Reference Laughlin, Stevens and Zhuo1997) and analysed by Isotope-Ratio Mass Spectrometry to quantify their 15N enrichment, using a Europa Scientific 20–20 Stable Isotope Analyser interfaced to a Europa Scientific Trace Gas Preparation System ANCA-TG (Crewe, UK) with Gilson autosampler (Anachem, Luton, UK).
Fungal : Bacterial ratio
The fungal : bacterial ratio of the soil microbial community was determined by PLFA analysis. For each sample, 5 g of freeze-dried soil was weighed out and screened for community composition by PLFA as described by Frostegård et al. (Reference Frostegård, Petersen, Baath and Nielsen1997). The F : B ratios were calculated using the PLFA peak 18 : 1w9c as an estimate of fungal biomass and the sum of peaks i50 : 0, a15 : 0, 15 : 00, i16 : 0, 16 : 1w7t, i17 : 0, ai17 : 0, cy17 : 0, 18 : 1w7t as an estimate of bacterial biomass.
DCD concentrations and pH
The soil extracts from the +DCD treatment were analysed for DCD concentration using a Waters Alliance 2695 High-Performance Liquid Chromatograph with UV–visible detection with a photodiode array detector (Waters 996, Waters Ltd, Elstree, UK), following the protocol of Turowski & Deshmukh (Reference Turowski and Deshmukh2004). In addition, pH in all extracts was measured using a Metrohm 691 pH meter (Metrohm, Herisau, Switzerland).
Model analysis
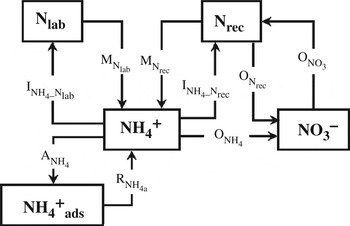
Gross transformation rates were quantified using the 15N tracing model described by Müller et al. (Reference Müller, Rütting, Kattge, Laughlin and Stevens2007). To find the parameter set that best fitted the observed data, model setups with different combinations of N pools, N transformations and kinetic settings were tested (Rütting & Müller Reference Rütting and Müller2007). The Akaikes Information Criterion was used to identify the best fit (Cox et al.
Reference Cox, Gibbons, Wood, Craigon, Ramsden and Crout2006). The same parameter set was used for the +DCD and −DCD treatments, while different setups were accepted for the three soils. The model included five soil N pools: NH4
+; NO3
−; labile soil organic N (Nlab); recalcitrant soil organic N (Nrec) and NH4
+ fixed to soil particles (e.g. to clay minerals) (NH4
ads
+) and nine N transformations: mineralization of Nrec to NH4
+ (
 ${\rm M}_{{\rm N}_{{\rm rec}}} $
); mineralization of Nlab to NH4
+ (
 ${\rm M}_{{\rm N}_{{\rm lab}}} $
); immobilization of NH4
+ to Nrec (
 ${\rm I}_{{\rm NH}_{\rm 4} {\rm -} {\rm N}_{{\rm rec}}} $
); immobilization of NH4
+ to Nlab (
 ${\rm I}_{{\rm NH}_{\rm 4} {\rm -} {\rm N}_{{\rm lab}}} $
); immobilization of NO3
− to Nrec (
 ${\rm I}_{{\rm NO}_{\rm 3}} $
); oxidation of Nrec to NO3
− (
 ${\rm O}_{{\rm N}_{{\rm rec}}} $
); oxidation of NH4
+ to NO3
− (
 ${\rm O}_{{\rm NH}_{\rm 4}} $
); adsorption to fixed NH4
+ pool (
 ${\rm A}_{{\rm NH}_{\rm 4}} $
) and release from fixed NH4
+ pool (
 ${\rm R}_{{\rm NH}_{\rm 4}}\hskip-4pt $
) (Fig. 1). Dissimilatory NO3
− reduction to NH4
+ was considered but not included in the final model since it did not improve the model performance. Most N transformations were best described by zero- or first-order kinetics, except for
 ${\rm O}_{{\rm NH}_{\rm 4}} $
(autotrophic nitrification) where Michaelis–Menten kinetics provided a better fit (Rütting & Müller Reference Rütting and Müller2007). Each optimization was run with a minimum of 5000 iterations. The model was used for the time period of 0–10 days because thereafter the NH4
+ concentrations remaining in the MP soil were too low for determination of 15N enrichments. The organic N pool was determined as the total N pool minus the mineral N pool and the Nlab pool was estimated to be 1% of the total organic N pool.
15N tracing model for analysis of gross N transformation rates in soil. Modified from Müller et al. (Reference Müller, Rütting, Kattge, Laughlin and Stevens2007). NH4
+; NO3
−; labile soil organic N (Nlab); recalcitrant soil organic N (Nrec) and NH4
+ fixed to soil particles (e.g. to clay minerals) (NH4
ads
+) and nine N transformations: mineralization of Nrec to NH4
+ (
 ${\rm M}_{{\rm N}_{{\rm rec}}} $
); mineralization of Nlab to NH4
+ (
 ${\rm M}_{{\rm N}_{{\rm lab}}} $
); immobilization of NH4
+ to Nrec (
 ${\rm I}_{{\rm NH}_{\rm 4} {\rm -} {\rm N}_{{\rm rec}}} $
); immobilization of NH4
+ to Nlab (
 ${\rm I}_{{\rm NH}_{\rm 4} {\rm -} {\rm N}_{{\rm lab}}} $
); immobilization of NO3
− to Nrec (
 ${\rm I}_{{\rm NO}_{\rm 3}} $
); oxidation of Nrec to NO3
− (
 ${\rm O}_{{\rm N}_{{\rm rec}}} $
); oxidation of NH4
+ to NO3
− (
 ${\rm O}_{{\rm NH}_{\rm 4}} $
); adsorption to fixed NH4
+ pool (
 ${\rm A}_{{\rm NH}_{\rm 4}} $
) and release from fixed NH4
+ pool (
 ${\rm R}_{{\rm NH}_{\rm 4}} $
).

Calculations and statistics
Net nitrification rates for the whole incubation and for the first 10 days were calculated by subtracting the initial NO3 − content from the NO3 − content at the end of the incubation period and dividing by the number of days between the two time points (Hart et al. Reference Hart, Stark, Davidson, Firestone, Weaver, Angle, Bottomley, Bezdiecek, Smith, Tabatabai, Wollum, Mickelson and Bigham1994). Net mineralization was calculated for the same periods, by subtracting the initial sum of NH4 + and NO3 − from the sum of NH4 + and NO3 − at the end of the incubation period and dividing by the days between the two time points (Hart et al. Reference Hart, Stark, Davidson, Firestone, Weaver, Angle, Bottomley, Bezdiecek, Smith, Tabatabai, Wollum, Mickelson and Bigham1994). Average gross transformation rates were calculated as the integrated flux over the 10-day period divided by the 10 days. Initial fixation of NH4 + to soil particles was calculated as the amount of added NH4 + minus the amount extracted at time 0 h.
Statistical analysis was carried out according to the least significant difference (LSD) procedure described in Müller et al. (Reference Müller, Laughlin, Christie and Watson2011), in Sigmaplot (version 12·5, Systat Software Inc., San Jose, CA, USA), using the number of actual experimental repetitions as sample size (n=3) and averages and standard deviations (s.d.) from the model output. Net N transformation rates, initially fixed NH4 + and F : B ratios in unamended soil were analysed using analysis of variance and Tukey's post-hoc test, in SPSS software (IBM SPSS Statistics 20.0, SPSS Inc., Chicago, IL, USA). The F : B ratios during the incubation were analysed using SAS software (SAS 9.2, SAS Institute Inc., Cary, NC, USA), using the GLIMMIX linear mixed model function. All assumptions of the analyses were met.
RESULTS
Soil properties
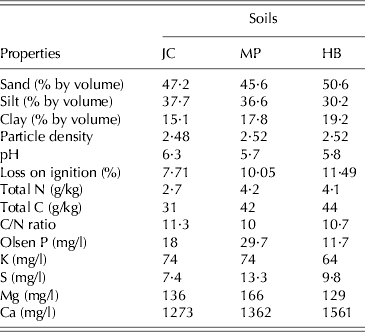
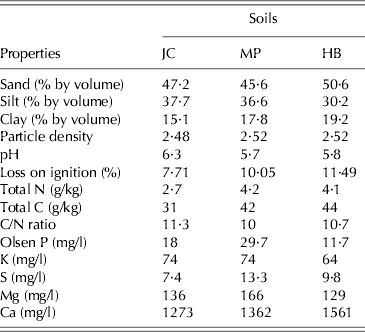
The soils had similar C : N ratios, whereas organic matter content (loss on ignition), total N and total C contents were lower and pH was slightly higher in JC, compared with HB and MP. Moorepark had a higher concentration of available P (Olsen P) than the other two soils. The physical and chemical properties of the soils are shown in Table 2.
Physical and chemical properties of the soil (0–7·5 cm depth) from each of the three sites: JC, MP, HB
Main N transformations
Based on the 15N tracing analysis, the main gross N transformations occurring in the control treatments were (1) oxidation of NH4
+ to NO3
− (
 ${\rm O}_{{\rm NH}_{\rm 4}} $
; autotrophic nitrification), (2) immobilization of NO3
− to recalcitrant organic N (
 ${\rm I}_{{\rm NO}_{\rm 3}} $
), (3) immobilization of NH4
+ to labile organic N (
 ${\rm I}_{{\rm NH}_{\rm 4} {\rm -} {\rm N}_{{\rm lab}}} $
) and (4) mineralization of recalcitrant and labile organic N to NH4
+ (
 ${\rm M}_{{\rm N}_{{\rm rec}}} $
;
 ${\rm M}_{{\rm N}_{{\rm lab}}}\!$
) (Table 3). For the JC soil, immobilization into Nrec (
 ${\rm I}_{{\rm NH}_{\rm 4} {\rm -} {\rm N}_{{\rm rec}}} $
), adsorption to the fixed NH4
+ pool (
 ${\rm A}_{{\rm NH}_{\rm 4}} $
) and release of NH4
+ from the fixed NH4
+ pool (
 ${\rm R}_{{\rm NH}_{{\rm 4a}}} $
) were not included in the model since they did not contribute to an improved model fit. Heterotrophic nitrification from organic N (
 ${\rm O}_{{\rm N}_{{\rm rec}}} $
) was estimated for all three soils, but the rates were small compared with NH4
+ oxidation (Table 3). The initial adsorption of NH4
+ to the fixed pool was on average 20·0 (s.e. 0·84) μg N/g DW, with no significant differences between soils. For MP and HB there was a subsequent net release of fixed NH4
+ during the incubation, whereas no release or uptake of NH4
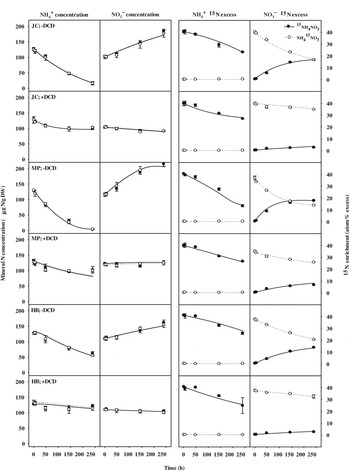
+ was estimated for the JC soil (Table 3). In general, the model fitted observed data well (Fig. 2) and R
2 values were ⩾0·98.
Concentrations and 15N enrichments of NH4 + and NO3 − after application of CS with and without DCD to three soils (JC, MP and HB). Points represent experimental data (mean±s.d.) and lines represent modelled data.

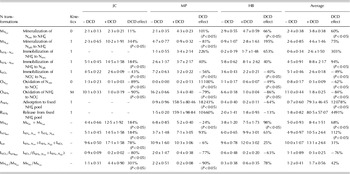
Mean (±s.d.) modelled gross N fluxes, over 10 days after amendments, for the JC, MP and HB soils

P values refer to differences between +DCD and −DCD treatments. 0, zero-order kinetics; 1, first order kinetics; M, Michaelis–Menten kinetics.
Effects of DCD on gross N transformations
Dicyandiamide decreased gross
 ${\rm O}_{{\rm NH}_{\rm 4}} $
rates by 90, 79 and 86% for JC, MP and HB, respectively (Table 3). Gross heterotrophic nitrification also decreased with DCD addition in JC and HB (by 89 and 49%, respectively), whereas there was no significant effect in MP (Table 3). Immobilization of NH4
+, both to
 ${\rm I}_{{\rm NH}_{\rm 4} {\rm -} {\rm N}_{{\rm lab}}} $
and the total rate (
 ${\rm I}_{{\rm NH}_{{\rm 4tot}}} $
), showed statistically significant increases (P⩽0·05) for JC and across the three soils in the +DCD treatment. For MP and HB,
 ${\rm I}_{{\rm NH}_{\rm 4} {\rm -} {\rm N}_{{\rm lab}}} $
and
 ${\rm I}_{{\rm NH}_{{\rm 4tot}}} $
tended to be higher in the +DCD treatment compared to the −DCD treatment (no significant difference). At the same time, the immobilization of NO3
− was significantly lower (P⩽0·05) in the +DCD treatment for all soils. The total rate of immobilization (Itot) increased for JC but did not change significantly for MP or HB (Table 3). The
 ${\rm I}_{{\rm NO}_{\rm 3}} {\rm /I}_{{\rm NH}_{{\rm 4tot}}} $
ratio decreased significantly (P⩽0·05) with DCD for JC and tended to be lower in the +DCD treatment compared to the −DCD treatment (no significant difference) for MP and HB (Table 3). Averaged across the three soils, there were significant increases (P⩽0·05) in total mineralization to NH4
+ (
 ${\rm M}_{{\rm N}_{{\rm tot}}} $
) and total immobilization of NH4
+ (
 ${\rm I}_{{\rm NH}_{{\rm 4tot}}} $
) when DCD was added (Table 3). The main exceptions from this pattern occurred in MP, where DCD significantly decreased
 ${\rm M}_{{\rm N}_{{\rm lab}}} $
and
 ${\rm M}_{{\rm N}_{{\rm tot}}} $
, by 81 and 24%, respectively (P⩽0·05). At the same time, averaged across the three soils, significant decreases (P⩽0·05) in heterotrophic nitrification (
 ${\rm O}_{{\rm N}_{{\rm rec}}} $
) and immobilization of NO3
− (
 ${\rm I}_{{\rm NO}_{\rm 3}} $
) (Table 3) were observed. The main deviation was again in MP, where
 ${\rm O}_{{\rm N}_{{\rm rec}}} $
increased significantly (P⩽0·05) with DCD addition but was low in both treatments. The response of immobilization to source pool size was stronger for NH4
+ than for NO3
−, with first order parameter values (slopes) of 0·07–0·14 for total NH4
+ immobilization (
 ${\rm I}_{{\rm NH}_{{\rm 4tot}}} $
, Table 3) and 0·02–0·04 for NO3
− immobilization (
 ${\rm I}_{{\rm NO}_{\rm 3}} $
). The total immobilization (Itot) and total mineralization rates (
 ${\rm M}_{{\rm N}_{{\rm tot}}} $
) were higher in the DCD treatments when averaged across all soils despite a significant decrease of
 ${\rm M}_{{\rm N}_{{\rm tot}}} $
in MP (P⩽0·05, Table 3). The response of
 ${\rm M}_{{\rm N}_{{\rm lab}}} $
to the addition of DCD was less consistent than that of immobilization, with a significant increase for JC (P⩽0·05), a non-significant increase for HB and a significant decrease for the MP soil (P⩽0·05).
Net N transformation rates
Net nitrification rates over the first 10 days were 7·8, 10·5 and 4·8 μg N/g DW/day for the control treatment and −1·3, 0·5 and −0·7 μg N/g DW/day for the +DCD treatment, for JC, MP and HB, respectively. The decrease in net nitrification rate with DCD was statistically significant (P⩽0·05) across the three soils, and the differences between soils were also all significant (P⩽0·05), across the two treatments. There was a net N immobilization over the first 10 days of 3·2, 2·1 and 2·0 μg N/g DW/day for the control treatment and 3·9, 2·4 and 1·9 μg N/g DW/day for the DCD treatment, for JC, MP and HB, respectively. There was no significant difference in net mineralization between treatments, across soils, but the JC soil had a significantly higher (P⩽0·05) net immobilization rate than the HB soil over 10 days, across treatments. The net rate of mineralization/immobilization changed over time after the treatment additions, turning from net immobilization to net mineralization after about 6 days. During the 20-day incubation, net mineralization of 0·8, 1·7 and 1·6 μg N/g DW/day for the −DCD treatment and −0·5, 1·2 and 1·8 μg N/g DW/day for the +DCD treatment were observed, for JC, MP and HB, respectively. Net mineralization, over 20 days, was significantly lower (P⩽0·05) in the +DCD treatment than in the −DCD treatment across the three soils, and significantly lower (P⩽0·05) in the JC soil compared with the MP and HB soils across treatments.
pH
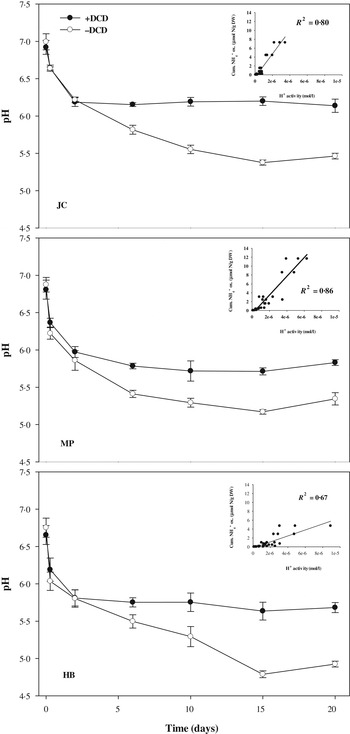
After an initial decrease of about one unit, the pH in the 2M KCl extracts stayed almost constant in the +DCD treatment whereas it decreased markedly in the −DCD treatment (Fig. 3). For each soil, there was a strong linear correlation between H+ activity in the extracts and cumulative gross autotrophic nitrification (Fig. 3, insert).
Dynamics of pH for the JC, MP and HB soils in KCl extracts. Inserts: cumulative gross NH4 + oxidation v. H+ activity.

Dicyandiamide degradation
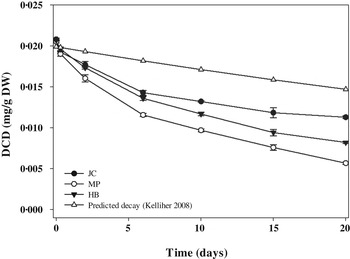
Soil DCD concentration decreased over the incubation period (Fig. 4), with observed degradation rates being higher compared with the predicted degradation rates modelled using Kelliher et al. (Reference Kelliher, Clough, Clark, Rys and Sedcole2008). Dicyandiamide was reduced by 36, 52 and 43% over the first 10 days and 45, 72 and 60% over the first 20 days of incubation for the JC, MP and HB soils, respectively. The DCD lost during the first 10 days of incubation contained 2·2 (s.e. 0·05), 3·1 (s.e. 0·07) and 2·6 (s.e. 0·06) μg C/g DW and 5·0 (s.e. 0·13), 7·2 (s.e. 0·15) and 6·0 (s.e. 0·15) μg N/g DW, for JC, MP and HB, respectively.
DCD concentrations in KCl extracts for the JC, MP and HB soils, compared with predicted DCD concentrations at 15 °C (Kelliher et al. Reference Kelliher, Clough, Clark, Rys and Sedcole2008).

F : B ratio
Before treatment applications, the F : B ratio was significantly higher (P⩽0·05) for the JC (0·29; s.e. 0·01) than for the MP (0·24; s.e. 0·01) and HB (0·24; s.e. 0·01) soils. During the incubation, averaged across the two treatments and across the three time points, the F : B ratios were 0·25 (s.e. 0·01), 0·22 (s.e. 0·01) and 0·19 (s.e. 0·01) for the JC, MP and HB soils, respectively. There was no significant difference in F : B ratio between the DCD and no DCD treatments, across soils and time points, and there was no significant interaction between treatment and time.
DISCUSSION
Oxidation of NH4
+ (
 ${\rm O}_{{\rm NH}_{\rm 4}} $
) was the dominant gross N transformation process in all three soils and ranged from 6·6 to 16·2 μg N/g DW/day. The NH4
+ oxidation rate in the −DCD treatment was highest in MP and lowest in HB, which was also illustrated by the fact that the NH4
+ concentration in the −DCD treatment decreased to background levels by day 10 in MP, by day 15 in JC and was not fully depleted in HB by day 20. In contrast, the NH4
+ and NO3
− concentrations in the +DCD treatments remained relatively unchanged. The effect of DCD on NH4
+ oxidation increased in the order MP<HB<JC, which might be explained by the degradation rates of DCD, which increased in the opposite order (JC<HB<MP).
After day 2, inhibition of nitrification by DCD resulted in pH being significantly higher in the +DCD treatment, similar to the effect observed by O'Callaghan et al. (Reference O'Callaghan, Gerard, Carter, Lardner, Sarathchandra, Burch, Ghani and Bell2010). The drop in pH up to day 2 was not affected by DCD and could not be attributed to nitrification. It could, however, be related to the labile C source in the CS. Paul & Beauchamp (Reference Paul, Beauchamp, Hansen and Henriksen1989) observed that the VFA concentration in CS after application to soil decreased significantly after 1 day and completely disappeared after 4 days. In the microcosm experiment, metabolism of VFA in the slurry would have created anaerobic conditions in the soil and inhibited nitrification until the VFAs were all consumed and aerobic conditions were restored. Despite the pinprick holes provided, gas exchange between the microcosms and the ambient air was probably impeded by the parafilm cover, as indicated by high CO2 concentrations up to day 2 (unpublished data). Under these conditions, volatilization rates of ammonia would have been low and the most likely explanation for the decrease in soil pH is the dissolution of CO2.
Increased mineralization of recalcitrant organic N after DCD addition
For the MP and HB soils and on average for the three soils,
 ${\rm M}_{{\rm N}_{{\rm rec}}} $
increased significantly after DCD application. Previous studies have shown that gross rates of N mineralization in soil mainly correlate with microbial biomass/activity and total soil C and N concentrations (Nakajima et al.
Reference Nakajima, Ishizuka, Tsuruta, Iswandi and Murdiyarso2005; Ros Reference Ros2012). In the present study, the amounts of total and labile organic material in the microcosms did not differ between treatments, with one exception. The DCD itself is an organic compound, which decomposed during the experiment. Any NH4
+ released during decomposition of DCD would have provided unlabelled NH4
+ to the NH4
+ pool of the DCD treatment that was not present in the −DCD treatment. In the model, any NH4
+ from DCD would be included in
 ${\rm M}_{{\rm N}_{{\rm rec}}} $
, since the recalcitrant organic N remained more or less unlabelled throughout the incubation. The maximum NH4
+ release that would have resulted if all DCD lost by degradation had been converted to NH4
+ was, however, only 0·34 and 0·32 of the increase in
 ${\rm M}_{{\rm N}_{{\rm rec}}} $
in the +DCD treatment of MP and HB, respectively, and DCD degradation rates could not explain the entire effect.
On days 10, 15 and 20 after treatment application, when the initially high CO2 flux levelled off, the production of CO2 in the microcosms was c. 50% greater in the +DCD treatment compared to the −DCD treatment, averaged over all soils (data not shown). This indicates a higher microbial activity in the +DCD treatment, which could explain the higher rate of mineralization of organic matter. The higher CO2 emissions in the DCD treatment could not be explained by the decomposition of DCD, since this could only have produced 0·004–0·117 of the recorded increase. It could be argued that the addition of the relatively easily decomposable compound DCD exerted a priming effect (Kuzyakov et al. Reference Kuzyakov, Friedel and Stahr2000) on recalcitrant organic matter in soil and slurry, but since the decomposed DCD, over the first 10 days of incubation, represented only 0 11–0·15 of the VFA-C added with the slurry, this effect is likely to have been small. O'Callaghan et al. (Reference O'Callaghan, Gerard, Carter, Lardner, Sarathchandra, Burch, Ghani and Bell2010) previously found no change in the active microbial community structure with addition of DCD.
A higher microbial activity in the +DCD treatment may have been related to the difference in pH between the two treatments, which developed during the course of the experiment. The PLFA results showed that all three soils were dominated by bacteria (F : B ratios of 0·17–0·32) and respiration by soil bacteria is generally negatively affected by lower pH (Bååth & Anderson Reference Bååth and Anderson2003; Nannipieri et al. Reference Nannipieri, Ascher, Ceccherini, Landi, Pietramellara and Renella2003). The production of CO2 (data not shown) showed a negative linear correlation (R 2=−0·62) with H+ activity, in the microcosms, indicating an effect of soil pH on microbial activity.
Decreases in heterotrophic nitrification of organic N after DCD addition
Heterotrophic nitrifiers are generally not expected to respond to nitrification inhibitors, which target AMO (De Boer & Kowalchuk Reference De Boer and Kowalchuk2001) and DCD is one of several nitrification inhibitors that have been used to distinguish between autotrophic and heterotrophic nitrification (Nakajima et al.
Reference Nakajima, Ishizuka, Tsuruta, Iswandi and Murdiyarso2005). It is therefore not likely that the decreases in
 ${\rm O}_{{\rm N}_{{\rm rec}}} $
in JC and HB were caused by direct inhibition of nitrification by DCD. However, it might be possible that the effect of DCD on
 ${\rm O}_{{\rm N}_{{\rm rec}}} $
was pH-related. If a lower pH in the −DCD treatment suppressed the general heterotrophic activity of the bacteria-dominated microbial population, heterotrophic microorganisms less sensitive to low pH, such as fungi (de Boer et al.
Reference De Boer, Folman, Summerbell and Boddy2005), may have experienced less competition. In a grassland similar to those sampled for the present study, Laughlin et al. (Reference Laughlin, Rütting, Müller, Watson and Stevens2009) found that heterotrophic nitrification was predominantly related to fungal activity. If
 ${\rm O}_{{\rm N}_{{\rm rec}}} $
was mainly performed by fungi in the present study, the effect on heterotrophic activity due to higher pH in the +DCD treatment might explain the lower
 ${\rm O}_{{\rm N}_{{\rm rec}}} $
.
Immobilization and N turnover after DCD addition
With regard to immobilization and overall mineralization–immobilization turnover, the JC and HB soils seemed to behave in similar ways, although there were fewer significant effects of DCD for HB than for JC. The fewer significant effects for HB may have been a consequence of a generally lower microbial activity: the NH4
+ oxidation rate was lower for HB than for JC in the −DCD treatment and
 ${\rm M}_{{\rm N}_{{\rm tot}}} $
and Itot values were also lower, especially in the +DCD treatment, where the pH was not as much changed by NH4
+ oxidation. A lower microbial activity was also confirmed by the HB soil having a lower CO2 production than JC (data not shown).The MP soil responded somewhat differently to DCD compared with the JC and HB soils. The MP soil had a higher NO3
− turnover without DCD, with a higher NH4
+ oxidation rate, a higher
 ${\rm I}_{{\rm NO}_{\rm 3}} $
and a larger
 ${\rm I}_{{\rm NO}_{\rm 3}} {\rm /I}_{{\rm NH}_{{\rm 4tot}}} $
ratio. The MP soil also had the lowest
 ${\rm M}_{{\rm N}_{{\rm tot}}} $
and Itot values in the +DCD treatment, where the pH was less changed by NH4
+ oxidation. The seemingly more NO3
− dominated N cycling of the MP soil could possibly explain the different response to DCD, compared with JC and HB.
The significantly lower
 ${\rm I}_{{\rm NO}_{\rm 3}} {\rm /I}_{{\rm NH}_{\rm 4} _{{\rm tot}}} $
ratio for the JC soil, and the lower
 ${\rm I}_{{\rm NO}_{\rm 3}} $
for all soils, in the +DCD treatment (Table 3) are most likely to have been a response to the lower NO3
−/NH4
+ ratio in the +DCD treatment, compared to the −DCD treatment. The increased total immobilization rate (Itot) in the +DCD treatment for the JC soil indicates a possible increase in microbial biomass during the incubation, which would have increased the pool of labile N (Mlab) and might explain the significant increase in the
 ${\rm M}_{{\rm N}_{{\rm lab}}} $
/
 ${\rm M}_{{\rm N}_{{\rm rec}}} $
ratio. The MIT clearly increased with DCD for the JC soil, with significant increases in
 ${\rm M}_{{\rm N}_{{\rm tot}}} $
and
 ${\rm I}_{{\rm NH}_{{\rm 4tot}}} $
. For HB,
 ${\rm M}_{{\rm N}_{{\rm tot}}} $
increased significantly with DCD, indicating increased MIT, although the increase in
 ${\rm I}_{{\rm NH}_{{\rm 4tot}}} $
was not significant. The significant increases in the average
 ${\rm M}_{{\rm N}_{{\rm tot}}} $
and
 ${\rm I}_{{\rm NH}_{{\rm 4tot}}} $
for the three soils, despite a decrease in
 ${\rm M}_{{\rm N}_{{\rm tot}}} $
for the MP soil, strengthen the general conclusion that DCD can increase overall MIT in grassland soil.
CONCLUSIONS
Rates of NH4 + oxidation were significantly reduced for all three soils, by up to 90%, which means that DCD was very effective as a nitrification inhibitor. Degradation of DCD was faster than expected and soil type specific. The increase in MIT of N as demonstrated in the present study indicates that DCD can cause non-target effects. A faster N cycling rate can potentially increase crop N availability (Inselsbacher et al. Reference Inselsbacher, Wanek, Strauss, Zechmeister-Boltenstern and Müller2013) but also increase the risk of N loss (Mahmood et al. Reference Mahmood, Ali, Latif and Ishaque2011). The study showed that gross rate determinations are needed to identify non-target effects of nitrification inhibitors on individual N transformations, which cannot be achieved via net rate determinations. If DCD is to be used to mitigate N losses from soil on a larger scale, effects on gross N transformations need to be studied in more detail, particularly in the presence of plants. Furthermore, studies over longer periods of time are required to evaluate the full consequences of DCD amendments over an entire season.
This research was financially supported under the National Development Plan, through the Research Stimulus Fund, administered by the Department of Agriculture, Food and the Marine. F.P. Brennan acknowledges funding support from Teagasc, the French Embassy in Ireland and the Burgundy region. B.S. Griffiths acknowledges support from Science Foundation Ireland under their Stokes Professorship initiative (Grant No. 07/SK/B1236b). E.P. Minet acknowledges funding from the Irish Department of Agriculture, Food and the Marine (Research Stimulus Fund Programme – RSF 07545). The authors would like to thank Denny Brennan, Kerrie Nic Aogáin, Margaux Motte and Enda Cahalan for technical assistance.