


Political scientists draw on information from various geographical and historical contexts to describe and analyze political systems. In principle, we might learn as important lessons about politics from studying smaller, lesser-known, and less powerful countries as from studying larger, better-known, and more powerful ones. Nevertheless, one widely shared suspicion among many political scientists that is backed up by recent, systematic evidence on publication patterns (Hendrix and Vreede Reference Hendrix and Vreede2019; Pelke and Friesen Reference Pelke and Friesen2019; Pepinsky Reference Pepinsky2019) is that some parts of the world are heavily represented in political science studies, whereas others are less frequently studied. Indeed, the countries on which political scientists have historically concentrated their research might display characteristics (such as being Western, English speaking, and wealthy) that are not necessarily related to how fruitful these countries are from a research-design point of view. Skewed geographical coverage is also problematic if general theories of politics in comparative politics and international relations are based on, or at least colored by, the historical experiences of more frequently studied countries.
We examine and substantiate the suspicion that political science research has generally tilted towards focusing on certain regions and countries over others. We do so by drawing on an extensive data source that incorporates information from all the pieces published in eight major political science journals from their inception to 2019. This work further develops and uses the dataset on abstracts and titles from major political science journals that Wilson (Reference Wilson2017) introduced, as well as provides a new and easy-to-use online tool for graphing search terms and downloading citations and other information from the dataset. The oldest of the included journals, The American Political Science Review, was established in 1906, which provides us with more than a century’s worth of information. In total, we evaluate information from more than 27,690 publications from 2,413 published issues to describe trends in the geographical coverage of political science research.
When using these data and comparing across time and across journals from different subfields, we document several interesting patterns. Notably, a few countries in North America and Western Europe have been much more extensively studied than other countries. However, the empirical focus of political science research seems to have become somewhat more “globalized” in recent decades, with several non-Western regions being increasingly studied. Further, we find indications that geographical coverage is less balanced in international relations research than in comparative politics, leaning heavily towards the United States. This finding reinforces those in a recent special issue (see Colgan Reference Colgan2019) analyzing various “American biases” in the attention and accuracy of IR research. Digging deeper into the question of why certain countries are more widely studied than others, we use regression analysis to consider potential factors underlying the geographical patterns. Controlling for population size, language, region, and time trends, we find that richer and more democratic countries are more likely to be the focus of political science studies than poorer and more autocratic ones.
In the following sections, we first discuss how and why geographical coverage may be skewed in the research on core topics in comparative politics and international relations and discuss the recent literature on publication patterns in political science. Next, we introduce the data and present an online tool that allows readers to plot and evaluate trends in citations. We then describe regional trends, followed by a discussion of which countries have been more and less prominent contexts of study in top political science journals. Finally, we elucidate which country-level factors correlate with being a focus of study.
The Importance of Geographical Representation
Examples of core topics in political science where research has centered on specific geographical regions or countries are plentiful. For example, research on elections and electoral systems has long been dominated by studies of Western countries, with some sub-literatures focusing on the United Kingdom and the United States and others on the proportional representation systems of continental European countries (Lijphart Reference Lijphart1985). In the welfare state literature, the predominant empirical context has been the developed democracies of the OECD, mainly those in Western Europe and North America. Poorer democracies and autocracies in other regions—which tend to have different types of welfare programs and less universal coverage (Knutsen and Rasmussen Reference Knutsen and Rasmussen2018)—have historically received less attention (Haggard and Kaufman Reference Haggard and Kaufman2008, chap. 1).
Geographical biases in published political science research can stem from various factors that range from certain political systems being more prevalent in public discourses and thus drawing the attention of political scientists, to reviewers and journal editors (consciously or sub-consciously) preferring articles based on large and well-known countries. Alternatively, certain countries may provide better access to different types of relevant register data or archival sources in major languages spoken by political scientists, or they may facilitate fieldwork because they are less violent or conflict prone. Further, certain large and wealthy countries, such as the United States and United Kingdom, have more political scientists based at their universities. When combined with researchers having a “home bias” when selecting research topics (e.g., due to funding opportunities), this can produce skewed coverage.
Whatever the combination of causes, researchers should be aware of potential skewness in geographical coverage and contemplate its consequences for knowledge generation. Omission of relevant data from particular empirical contexts can potentially bias descriptive and causal conclusions and limit our ability to make robust inferences about how politics works across different contexts. Moreover, a restricted empirical scope—which focuses more heavily on the political-institutional features of certain country contexts—can influence the development of what is presented as more or less general theories about how politics work.
One example of the latter point pertains to research on political parties and party organization, where Western Europe is arguably the continent “for which most of our existing models [of party organization] were developed” (Carty Reference Carty2004, 7). Theoretical notions, such as “catchall parties” or “cartel parties” derived from observing Western democracies (Blyth and Katz Reference Blyth and Katz2005), need not highlight the most relevant characteristics of parties in other contexts. Other areas of research have been similarly dominated by Western cases. Take the literature on “Varieties of Capitalism,” where ideal types such as “liberal market economies” or “coordinated market economies” explicitly reflect the histories of Western countries (Hall and Soskice Reference Hall and Soskice2001). Indeed, when cases from other regions, notably East Asia, have been studied, this has spurred new theorizing on how capitalist systems are organized (Kang Reference Kang2003). Even the contents of overarching concepts used by political scientists, such as “liberal democracy,” may reflect the history and particular institutions of certain Western countries, especially the United States (Rodrik Reference Rodrik2016). Some scholars have gone so far as to argue that predominant theories in the classical works on democratization, such as Dahl (Reference Dahl1971), represent “a thinly veiled apology for the elite domination and mass apathy that suffuse[d] the politics of Western liberal democracies” (Krouse Reference Krouse1982, 444).
The tendency to focus on a narrow set of cases is not limited to comparative politics. Several critical voices claim that a Western focus underlies prominent theoretical frameworks in international relations. Acharya and Buzan (Reference Acharya and Buzan2009) asked why there is no non-Western international relations theory, whereas Chen (Reference Chen2011) asked more specifically why there is an “absence of non-western IR theory in Asia.” Not only do these critical voices consider IR theories such as neorealism and neoliberalism to originate from North America and Western Europe, but the related focus on actions and relationships between Western countries presumably affects key assumptions and implications following from the theories. Johnston (Reference Johnston2012) sums up the problem: “Transatlantic international relations (IR) theory has more or less neglected the international relations of East Asia. This relative neglect has come in different forms: excluding East Asian cases from analysis, including East Asian cases but miscoding or misunderstanding them, or including them but missing the fact that they do not confirm the main findings of the study” (53).
As Johnston noted, this omission would not have mattered for theory development, as such, if the preferences, capacities, and behavior of actors from different continents are similar in all relevant regards. However, this is a very strong assumption.
Similar concerns are voiced by Africanists. Nkiwane (Reference Nkiwane2001, 3) argued that “case studies, theories, and examples from Africa are exceedingly rare in international relations. Indeed, examples from Africa are, at best, valued for their nuisance potential.” Lemke (Reference Lemke2003) pointed out that issues with selective data availability in international relations research has the potential to produce cross-national analyses that do not adequately represent the units that they were intended to explain. This, in turn, can have adverse implications for the relevance of generated academic knowledge, and even for related policy advice. For example, the lack of focus on African cases might affect our understanding of states as unitary actors and how we theorize concepts such as “stateness” and “sovereignty.” Likewise, standard accounts of realism and liberalism are considered to reflect the foreign policy experiences and international political contexts of Western countries well but not those of sub-Saharan African countries (Dunn and Shaw Reference Dunn and Shaw2001; Lemke Reference Lemke2003)
These notions are corroborated by analyses in a recent special issue considering “American biases” in IR research (Colgan Reference Colgan2019). These studies document a strong U.S. focus, and a dominance of U.S. scholars and perspectives, in the sub-discipline. This influences the results and interpretations of empirical studies as well as the accuracy and validity of coding in cross-country datasets. Further, it informs theoretical assumptions. For example, Levin and Trager (Reference Levin and Trager2019) show that (general) assumptions about domestic audience costs and relationships between domestic and international politics based on U.S. experiences may be misleading; survey data show that knowledge about foreign policy and attitudes towards using force for resolving conflicts are often different in the United States from other countries.
Existing Studies on Publication Patterns
In analyzing patterns and trends in the geographical coverage of political science research, we build on a small but recent body of work on patterns and trends in political science research, especially within comparative politics. While some attention has been paid to geographical patterns (Hendrix and Vreede Reference Hendrix and Vreede2019; Pepinsky Reference Pepinsky2019; Pelke and Friesen Reference Pelke and Friesen2019), previous studies have mainly focused on trends in theory development, the substantive topics studied (by comparativists), and the use of particular research designs and methods.
Munck and Snyder (Reference Munck and Snyder2007) mapped the distribution of articles in top comparative politics journals according to major topics and type of method used. Key findings pertained to the prevalence of studies mixing theoretical and empirical contributions and the relative absence of pure theoretical contributions in the subfield. Munck (Reference Munck, Munck and Snyder2007) also gave a broad, historical overview of the development of comparative politics, outlining trends in substantive areas of focus, theory developments, relative influence from neighboring fields, and methodological developments following various “scientific revolutions”.
Wilson (Reference Wilson2017) corroborated the notion that comparative politics research has been shaped by the scientific revolutions posited by Munck (Reference Munck, Munck and Snyder2007). Considering trends in the frequencies of selected keywords from 1906–2015 in abstracts and titles from major political science journals, Wilson (Reference Wilson2017) found supporting evidence for three “revolutions,” namely “the divorce of political science from history during its early years, a behavioral revolution that lasted until the late 1960s, and a second scientific revolution after 1989 characterized by greater empiricism” (Wilson Reference Wilson2017, 979). More recently, Pepinsky (Reference Pepinsky2019) reviewed the tendency of comparative politics research to rely on single-country studies, drawing on articles from six major journals from every fifth year from 1965-2015 (plus 2017). He identified “a relative decline in single-country research in the 1980s that has rapidly reversed since the 2000s” (188). Pepinsky also described how the design and typical focus of single-country studies has shifted from qualitative and descriptive/theory-generating in the 1960s and 1970s to quantitative and theory-testing in the last decade.
Despite several scholars alluding to the potential for geographical biases in political science research, few studies have systematically scrutinized whether such patterns exist. One exception is Hendrix and Vreede (Reference Hendrix and Vreede2019), who analyzed publication patterns in four IR journals (International Studies Quarterly, International Organization, International Security, and World Politics) from the 1970s to 2010s. Country mentions in titles and text vary strongly but are fairly well explained by countries’ GDP and population levels; richer and large countries are more widely cited. However, certain countries, such as Israel and Taiwan, are “over-cited” relative to structural factors, as is the United States, which has received the most citations by far.
Another exception is Pepinsky (Reference Pepinsky2019). Counting comparative politics articles with single-country studies, he found that Western European countries and their offshoots are over-represented both relative to population size and in the number of countries. Pepinsky also found that Western countries’ predominance has been somewhat reduced after 2000, whereas the share of articles studying Latin American countries has grown. These trends are corroborated and further illustrated later in our analysis, which uses a very different sample (all publications across sub-fields, additional journals, and more extensive time series) and measurement strategy.
Finally, Pelke and Friesen (Reference Pelke and Friesen2019) constructed a database of 3,724 articles from 1990–2015 pertaining to democratization research and displayed several interesting patterns in major journals in that subfield. Democratization research, overall, seems to display broad geographical coverage, with countries from different regions dominating as empirical contexts for different topics. The most studied region in the literature on democratic transitions after 1990 is Eastern Europe and the post-Soviet realm, while Latin America and the Middle East and North Africa (MENA) occupy the same position for studies on democratic consolidation and authoritarianism, respectively. Our analysis suggests that this area of research may be atypical in its dispersed geographical coverage; the overall pattern in political science is that North American and Western European countries dominate. Furthermore, we demonstrate that aggregated regional trends mask interesting and systematic variation in country-level patterns.
Data and Measures
We utilize an updated version of the data that Wilson (Reference Wilson2017) collected. Though we provide a brief description here, we refer to that article for details on the data collection. The data contain citation information from eight major political science journals: American Political Science Review (APSR), American Journal of Political Science (AJPS), Journal of Politics (JOP), British Journal of Political Science (BJPS), International Organization (IO), World Politics (WP), Comparative Political Studies (CPS), and Comparative Politics (CP). The first four are generalist political science journals, and typically considered among the most prestigious (Giles and Garand Reference Giles and Garand2007)—if not the most prestigious—journals in the discipline. IO is the top subfield journal in IR, and CP and CPS are the two top subfield journals in comparative politics. WP is a mixed IR and comparative politics journal but considered a top journal within both subfields. Political science counts numerous lower- and higher-ranked journals, including highly regarded subfield journals in areas not included here, such as public administration and political theory. Still, the journals that we include represent political science research published at the “research frontier,” with a tilt towards generalist and comparative politics journals.
It is hard to say whether subfield journals or lower-level general journals have different geographical coverage than the more highly ranked generalist journals. We would need a large sample of the former, which we anticipate are very diverse in focus and contents, to determine whether this is the case. Even if there is a clear and systematic difference between the top journals and other journals, representation of geographical contexts in the top journals would still matter for how we judge the geographical coverage of the wider field, due to readership and citation counts. We therefore restrict our analysis to the aforementioned eight journals and include as much relevant information from them as possible. The data include citation information for all articles, errata, and book reviews published from the journal’s founding—1906 for the oldest journal, APSR—until 2019. We omitted citations without author information or title. This eliminated front- and back matter, volume information, letters from editors, and notices and messages published in the APSR’s early years. In total, we leverage information on 27,690 citations from 2,413 published issues.
To accompany our article, we introduce a publicly available online tool to search for terms in titles and abstracts of all articles in the dataset. The online tool enables users to graph the prevalence (as a raw count or proportion of all publications) of search terms by year and to download the citation data for personalized searches for up to three terms or phrases.Footnote 1 The tool thus allows researchers to analyze geographical trends (using alternative measurement strategies from ours) or trends in substantive topics or methods by applying different search terms as proxies. For illustration, the top panel of figure 1, which comes directly from the online tool, shows references to “AFRICA” and “ASIA”. The bottom panel compares references to democracy—using the prefixes “DEMOCRAC” and “DEMOCRATIC”—and democratization (“DEMOCRATIZ”). Similar trends can be plotted for relevant subsets of publications; online appendix figure B.1 reconstructs figure 1 for publications from comparative politics journals only.
Citation trends related to Africa and Asia (top) and democracy (bottom)
Note: Proportions are counts of search terms divided by number of publications, by year.
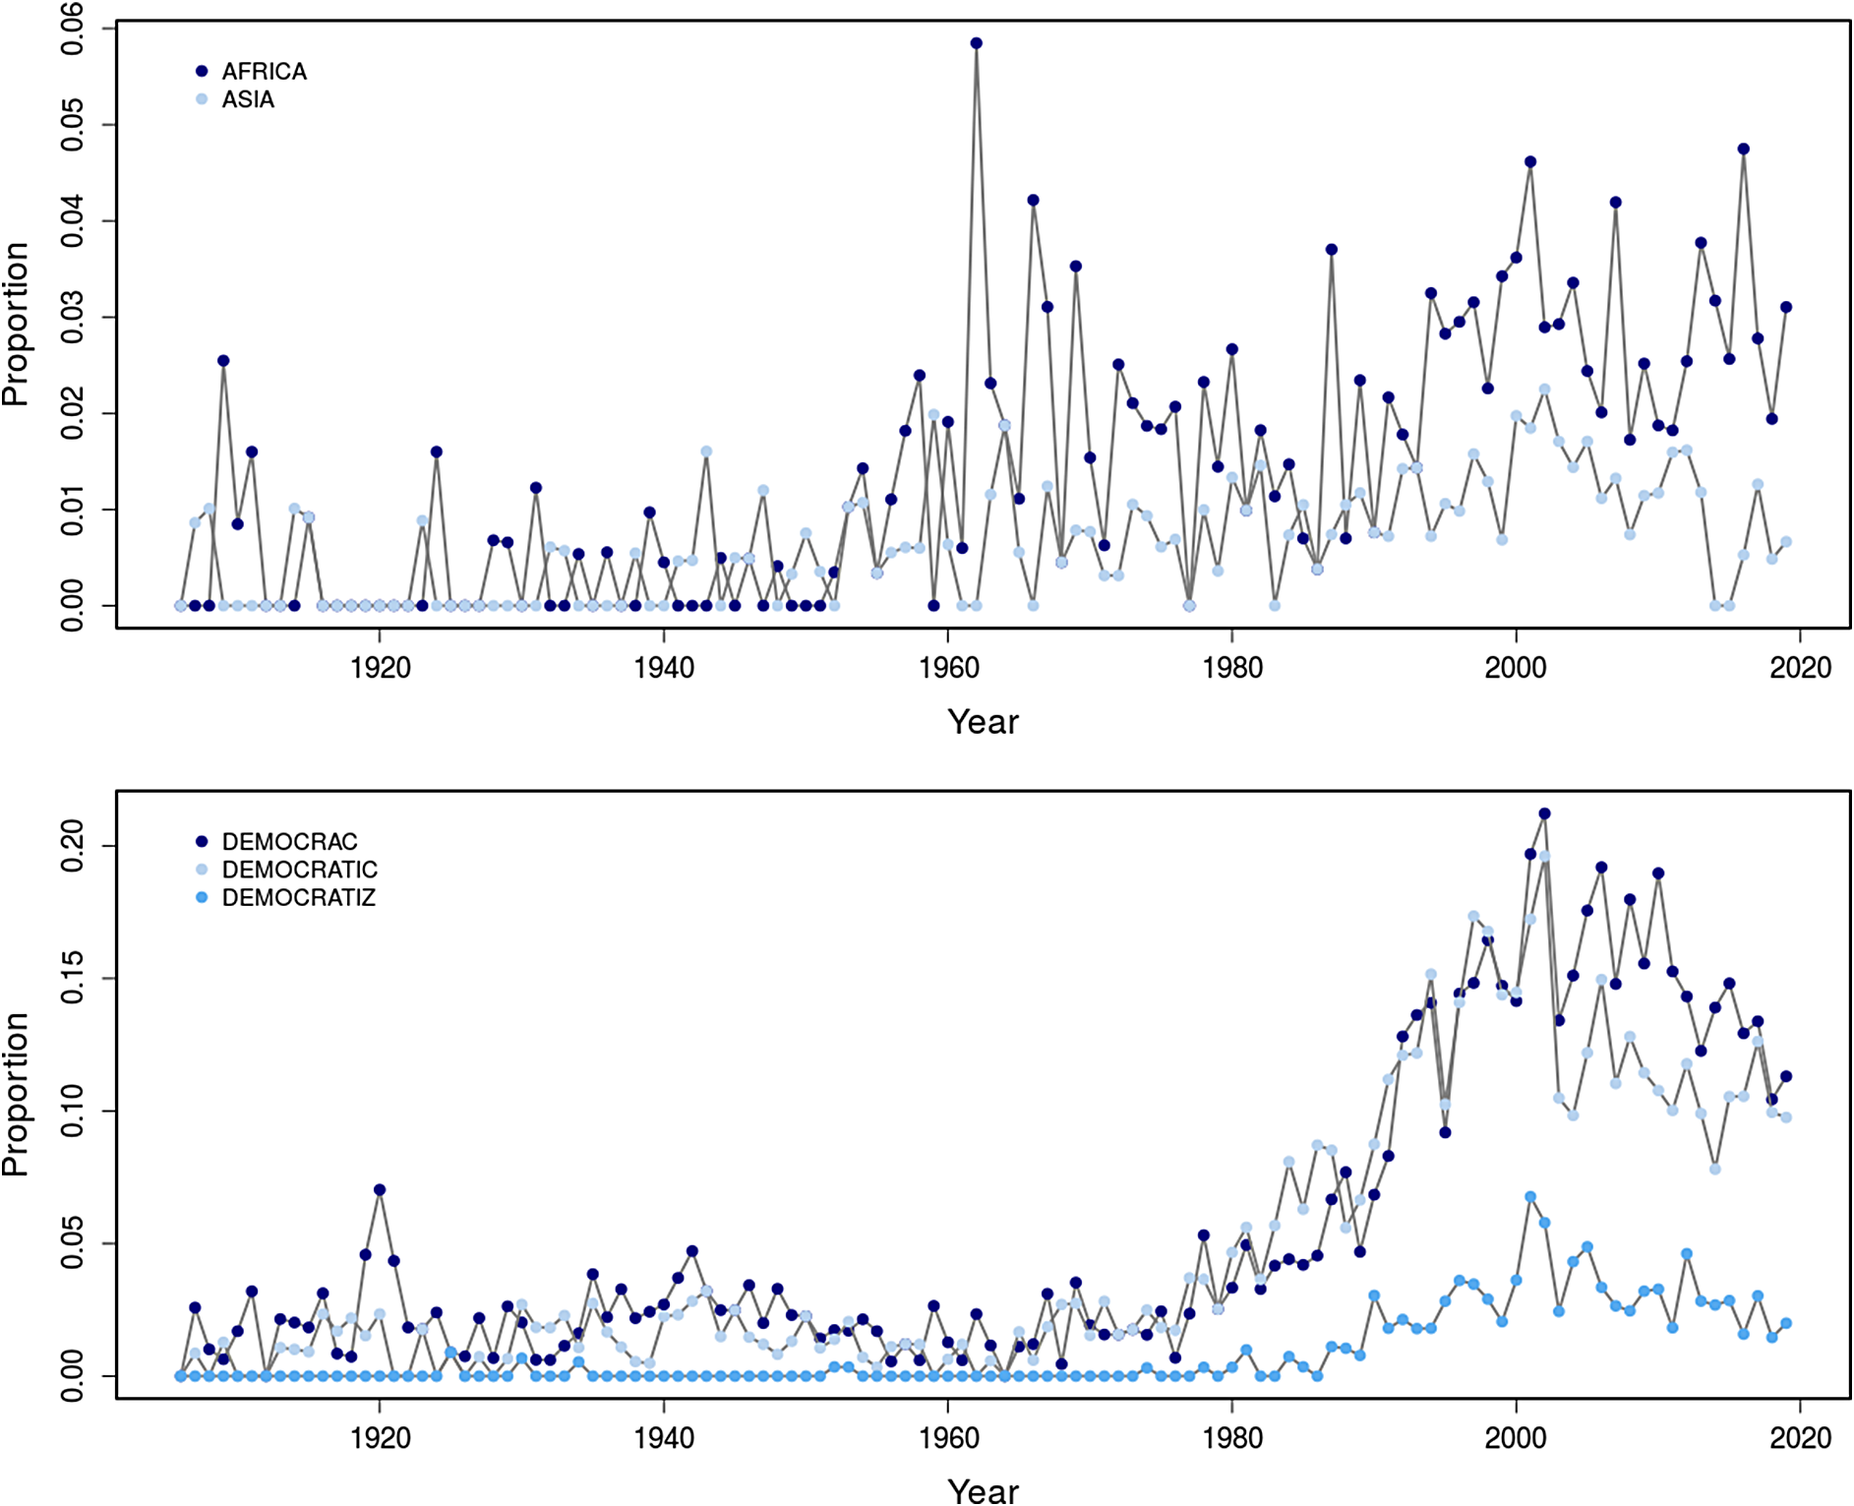
To identify the prominence of specific countries in published research, we counted references to country names and nationalities, including alternate country name spellings, in the title and abstract of every article. Keywords that identified references to Kyrgyzstan, for example, included “KYRGYZSTAN”, “KYRGYZ”, “KIRGHIS”, and “KYRGYZSTANI.”Footnote 2 Based on these keywords, we calculated the number of all articles by year that included a reference to each country. Using the regional classification from Teorell et al. (Reference Teorell, Samanni, Holmberg and Rothstein2011), we aggregated country references into nine major world regions—North America, Western Europe, East and Southeast Asia, Latin America, Eastern Europe, Middle East and North Africa, sub-Saharan Africa, South Asia, and Pacific and Caribbean island nations. In addition to counting references to countries, we also counted regional references such as “Eastern Europe”.
We considered several issues that may result from using proper nouns to count references to countries and world regions. First, using standard identifiers for the United States and United Kingdom were more problematic than for other countries. References to the American Political Science Association (APSA) are ubiquitous, for example. After examining 100 randomly selected entries for both countries, we identified and removed many potentially confounding phrases. For the UK, this included the country locations of major presses and “New England”; for the United States, we removed references to APSA, journal names, and institutions in the United States (e.g., the American Library Association and discussions of American universities).Footnote 3 Additional manual inspection corroborated the proper attribution of references to the United States and United Kingdom after these adjustments. Though presumably rare, the possibility remains of misidentifying references to countries based on items such as city names, as exemplified by a listed press in Lebanon, New Hampshire.
Second, using a count of country names in titles or abstracts likely under-counts the extent to which research uses data from––or even focuses on explaining or describing the politics of––a particular country. Some titles and abstracts focus exclusively on the substantive topic and general theory, though the paper may draw on data from one or a few countries in the empirical analysis. Thus, counting whether a reference appears in the abstract or title represents a high threshold for coding a piece of research as focusing on that country. This issue of under-counting may affect our interpretations, insofar as certain countries—for example smaller or poorer ones—may be less often reported in the abstract or title despite being the focus of research. Yet such issues stemming from relative differences in under-counting are presumably less severe than issues of absolute under-counting. Furthermore, any such relative differences can actually be informative. If authors believe that smaller or poorer countries are less interesting to, or considered less important by, reviewers in top journals, they could be reluctant to signal their research context up front, preferring instead to highlight the substantive question and concepts of interest. If so, our results incorporate differences that stem from perceptions about which countries are widely considered in the field as more “valuable” or “legitimate” research contexts.
Lastly, when we consider references to regions, we sum across references to the relevant countries in the region to create our summary count. Hence, we count references to more than one country within an article as separate references. Doing so has the effect of over-counting studies that uses small- or medium-N research. However, we are mainly interested in the relative number of references to countries and regions. Insofar as practices of referencing multiple countries in abstracts or titles of small-N analyses do not diverge systematically by region, this should not affect our conclusions. In sum, our approach provides a general indication of the extent to which the field has engaged with different countries and world regions.
Regional Trends
As Munck (Reference Munck, Munck and Snyder2007) suggested, political science has been dominated by Northern American and Western European institutions and scholars since its inception. Our data show a similar concentration in the geographical focus of political science research over the last century or so. Combining all relevant publications from the eight journals across 1906–2019, figure 2 shows that a North American country was mentioned in the abstract or title of roughly 13.5% of articles.Footnote 4 Western Europe comes close, with a country from this region being mentioned in 13.4% of articles. In contrast, there is a noticeable gap between Western Europe and the most-referenced “non-Western” region, namely East and Southeast Asia. A country from this region was represented in only 4.3% of abstracts or titles. Adding together the proportions of titles or abstracts that referenced every region except North America or Western Europe amounts to 16.6%. Thus, references to Western countries outnumber references to non-Western ones by roughly 1.6 to 1 in the journals that we study.
Proportion of references in titles or abstracts, by region
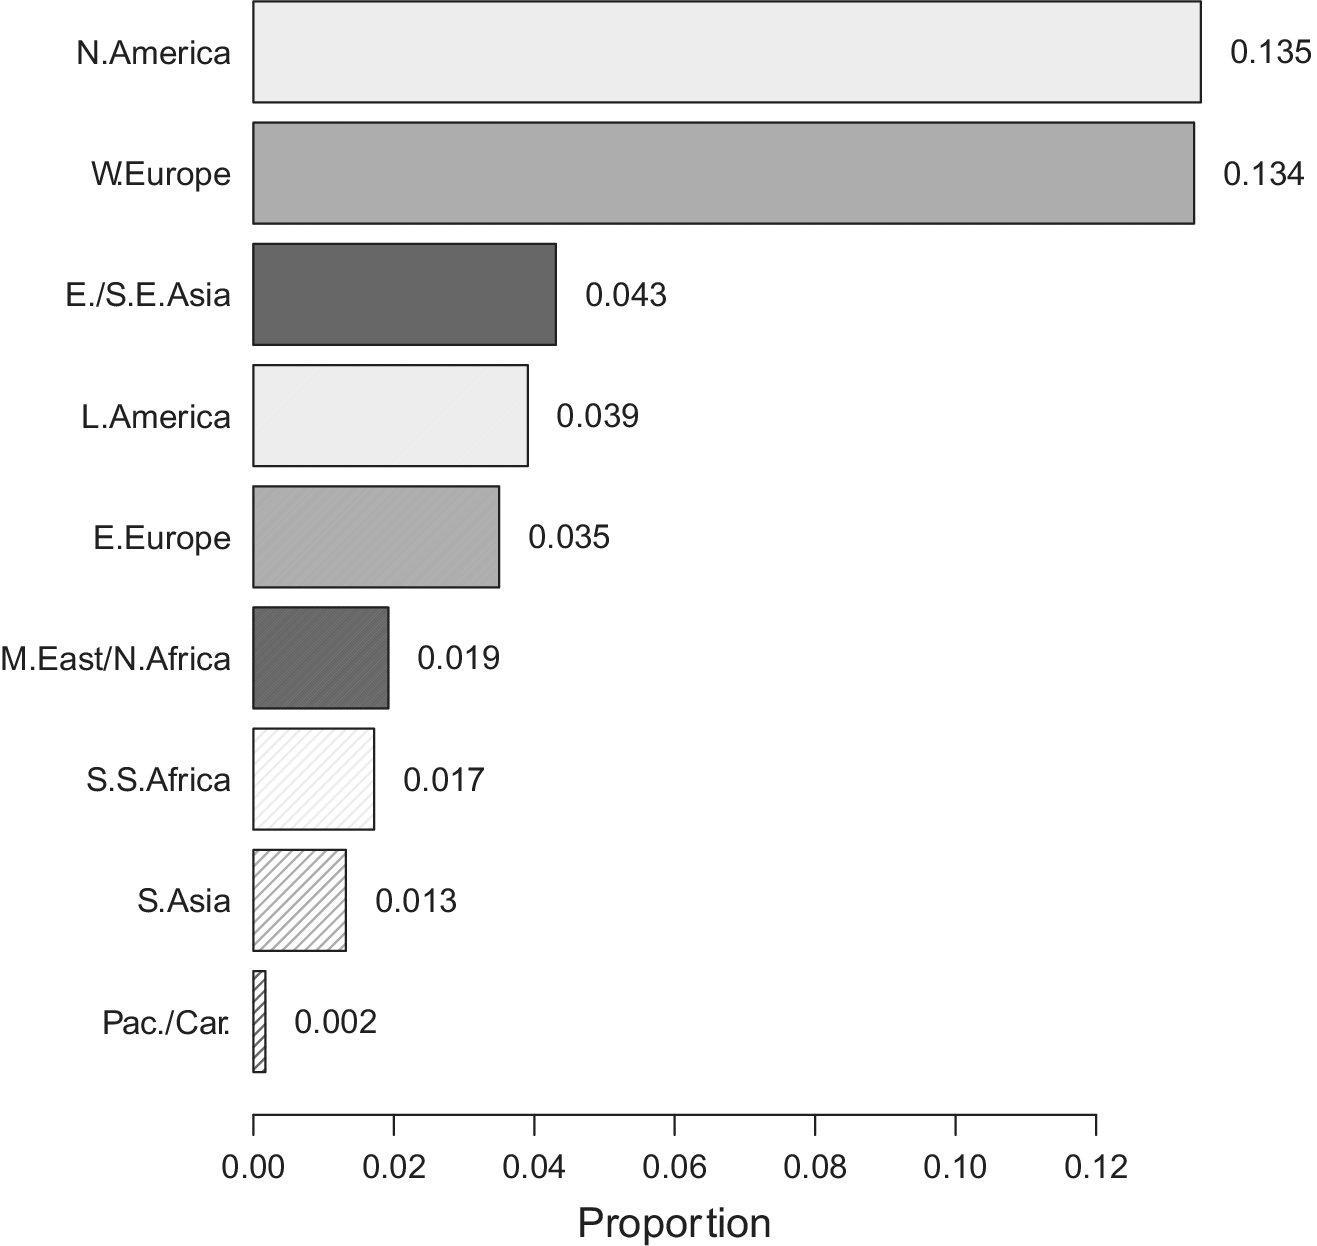
Nevertheless, the extent of “Western dominance” likely varies across sub-fields and by journal. The United Kingdom is (unsurprisingly) the most heavily referenced country in the BJPS, while there is a vastly disproportionate number of references to the United States among the generalist American journals that include research on American politics (AJPS, APSR, and JOP). When we focus on a sample that should largely contain comparative politics articles (CP, CPS and WP), the dominance of Western countries is substantially smaller (refer to online appendix figure B.2). References to Western European countries are the most frequent in the top subfield journals in comparative politics, making up roughly 16% of articles. Latin America is the next most-cited region, while North America trails behind East and Southeast Asia and Eastern Europe. Thus, even among comparative politics journals the Western world has been the most prominent area of focus, although this is largely due to the focus on Western European countries. In the top IR journal (IO), the picture is different, with North America dominating.
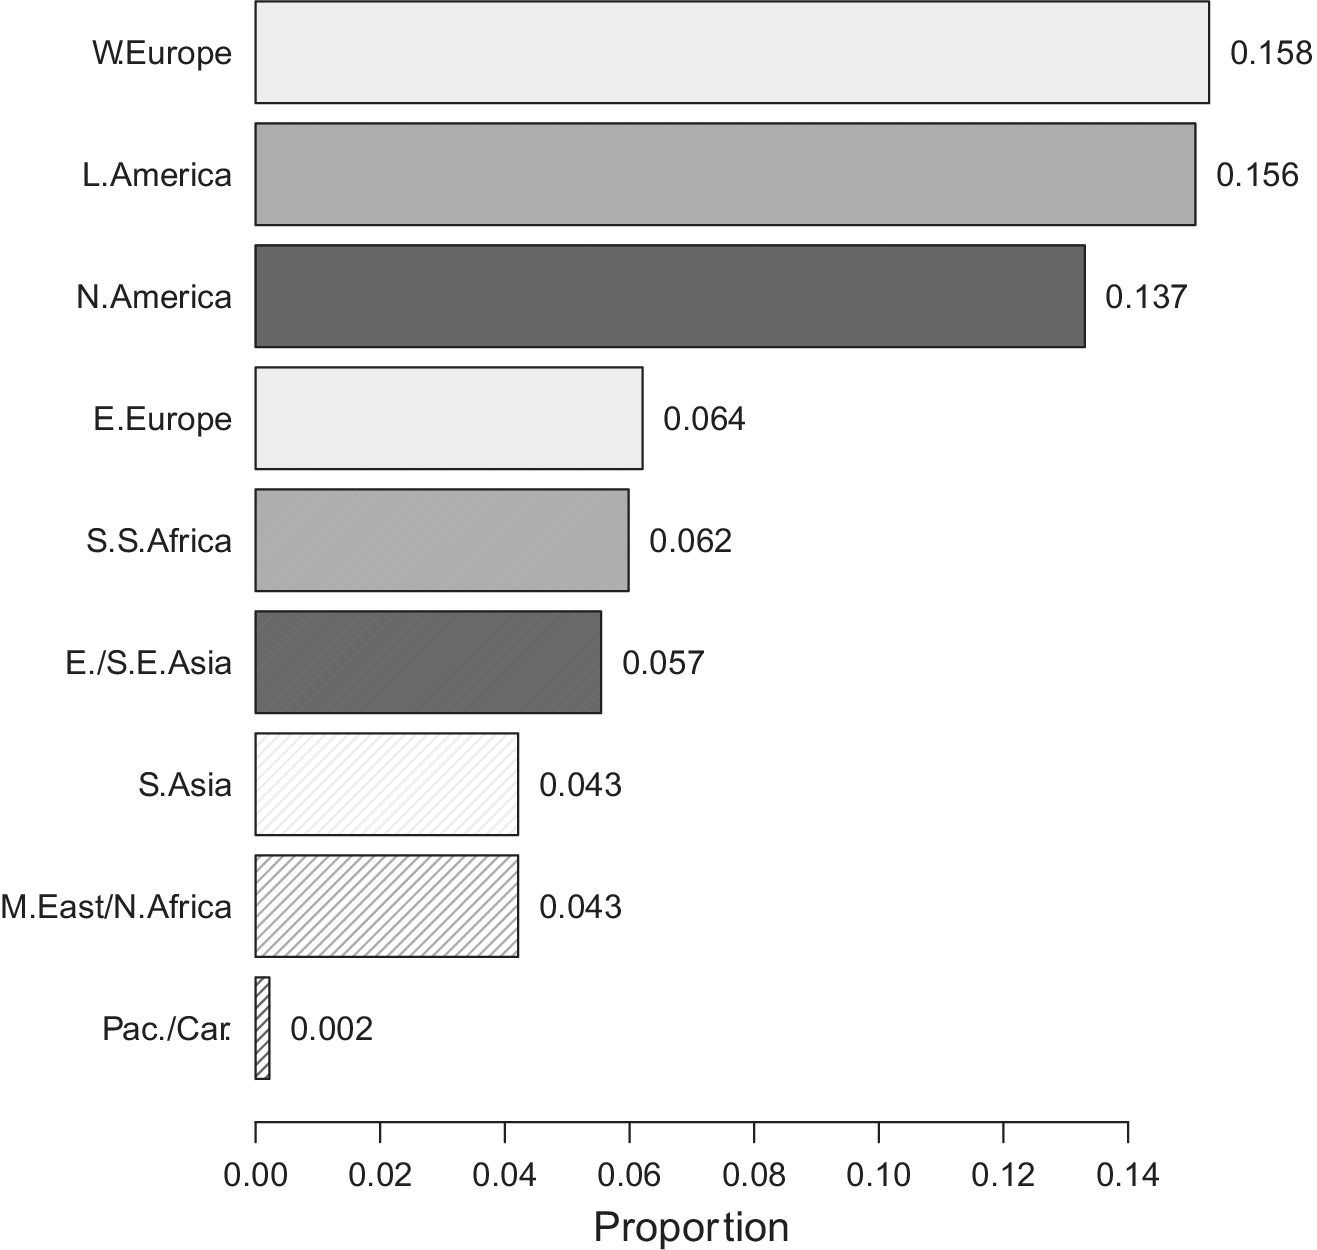
Coverage of non-Western countries has changed considerably in the last few decades. While there is still a clear over-representation of North American and Western European countries, several regions have been subject to increased focus recently. Figure 3 shows the share of publications referencing each region in the abstract or title in 2019. The cumulative representation of regions is higher in 2019 than in the overall sample. Yet the shares of references to Western European and North American countries, respectively, are fairly similar in 2019 to in the overall sample, with somewhat more references to Western Europe. In contrast, the shares of references to countries in the MENA and Eastern Europe in 2019 are roughly twice that of the respective shares in the total sample, and there are around three times more references to countries in sub-Saharan Africa and South Asia and nearly four times the number of references to Latin American countries.Footnote 5
Proportion of references in titles or abstracts in 2019, by region
Still, comparing patterns in a single year to the total sample is, at best, a crude way of demonstrating changes. Figure 4 provides a more comprehensive and nuanced view, illustrating trends in references to countries in each region by year (gray shading incorporates additional mentions to the region as a whole). First, it shows that North America and Western Europe have been consistently more referenced than other regions across the entire time period. Based on year-by-year distributions, references to North America have outnumbered those to other regions in fifty out of 114 years, with Western Europe predominating in fifty-seven. These two regions were equally referenced in the remaining seven years.
Proportion of references in titles or abstracts by year, by region
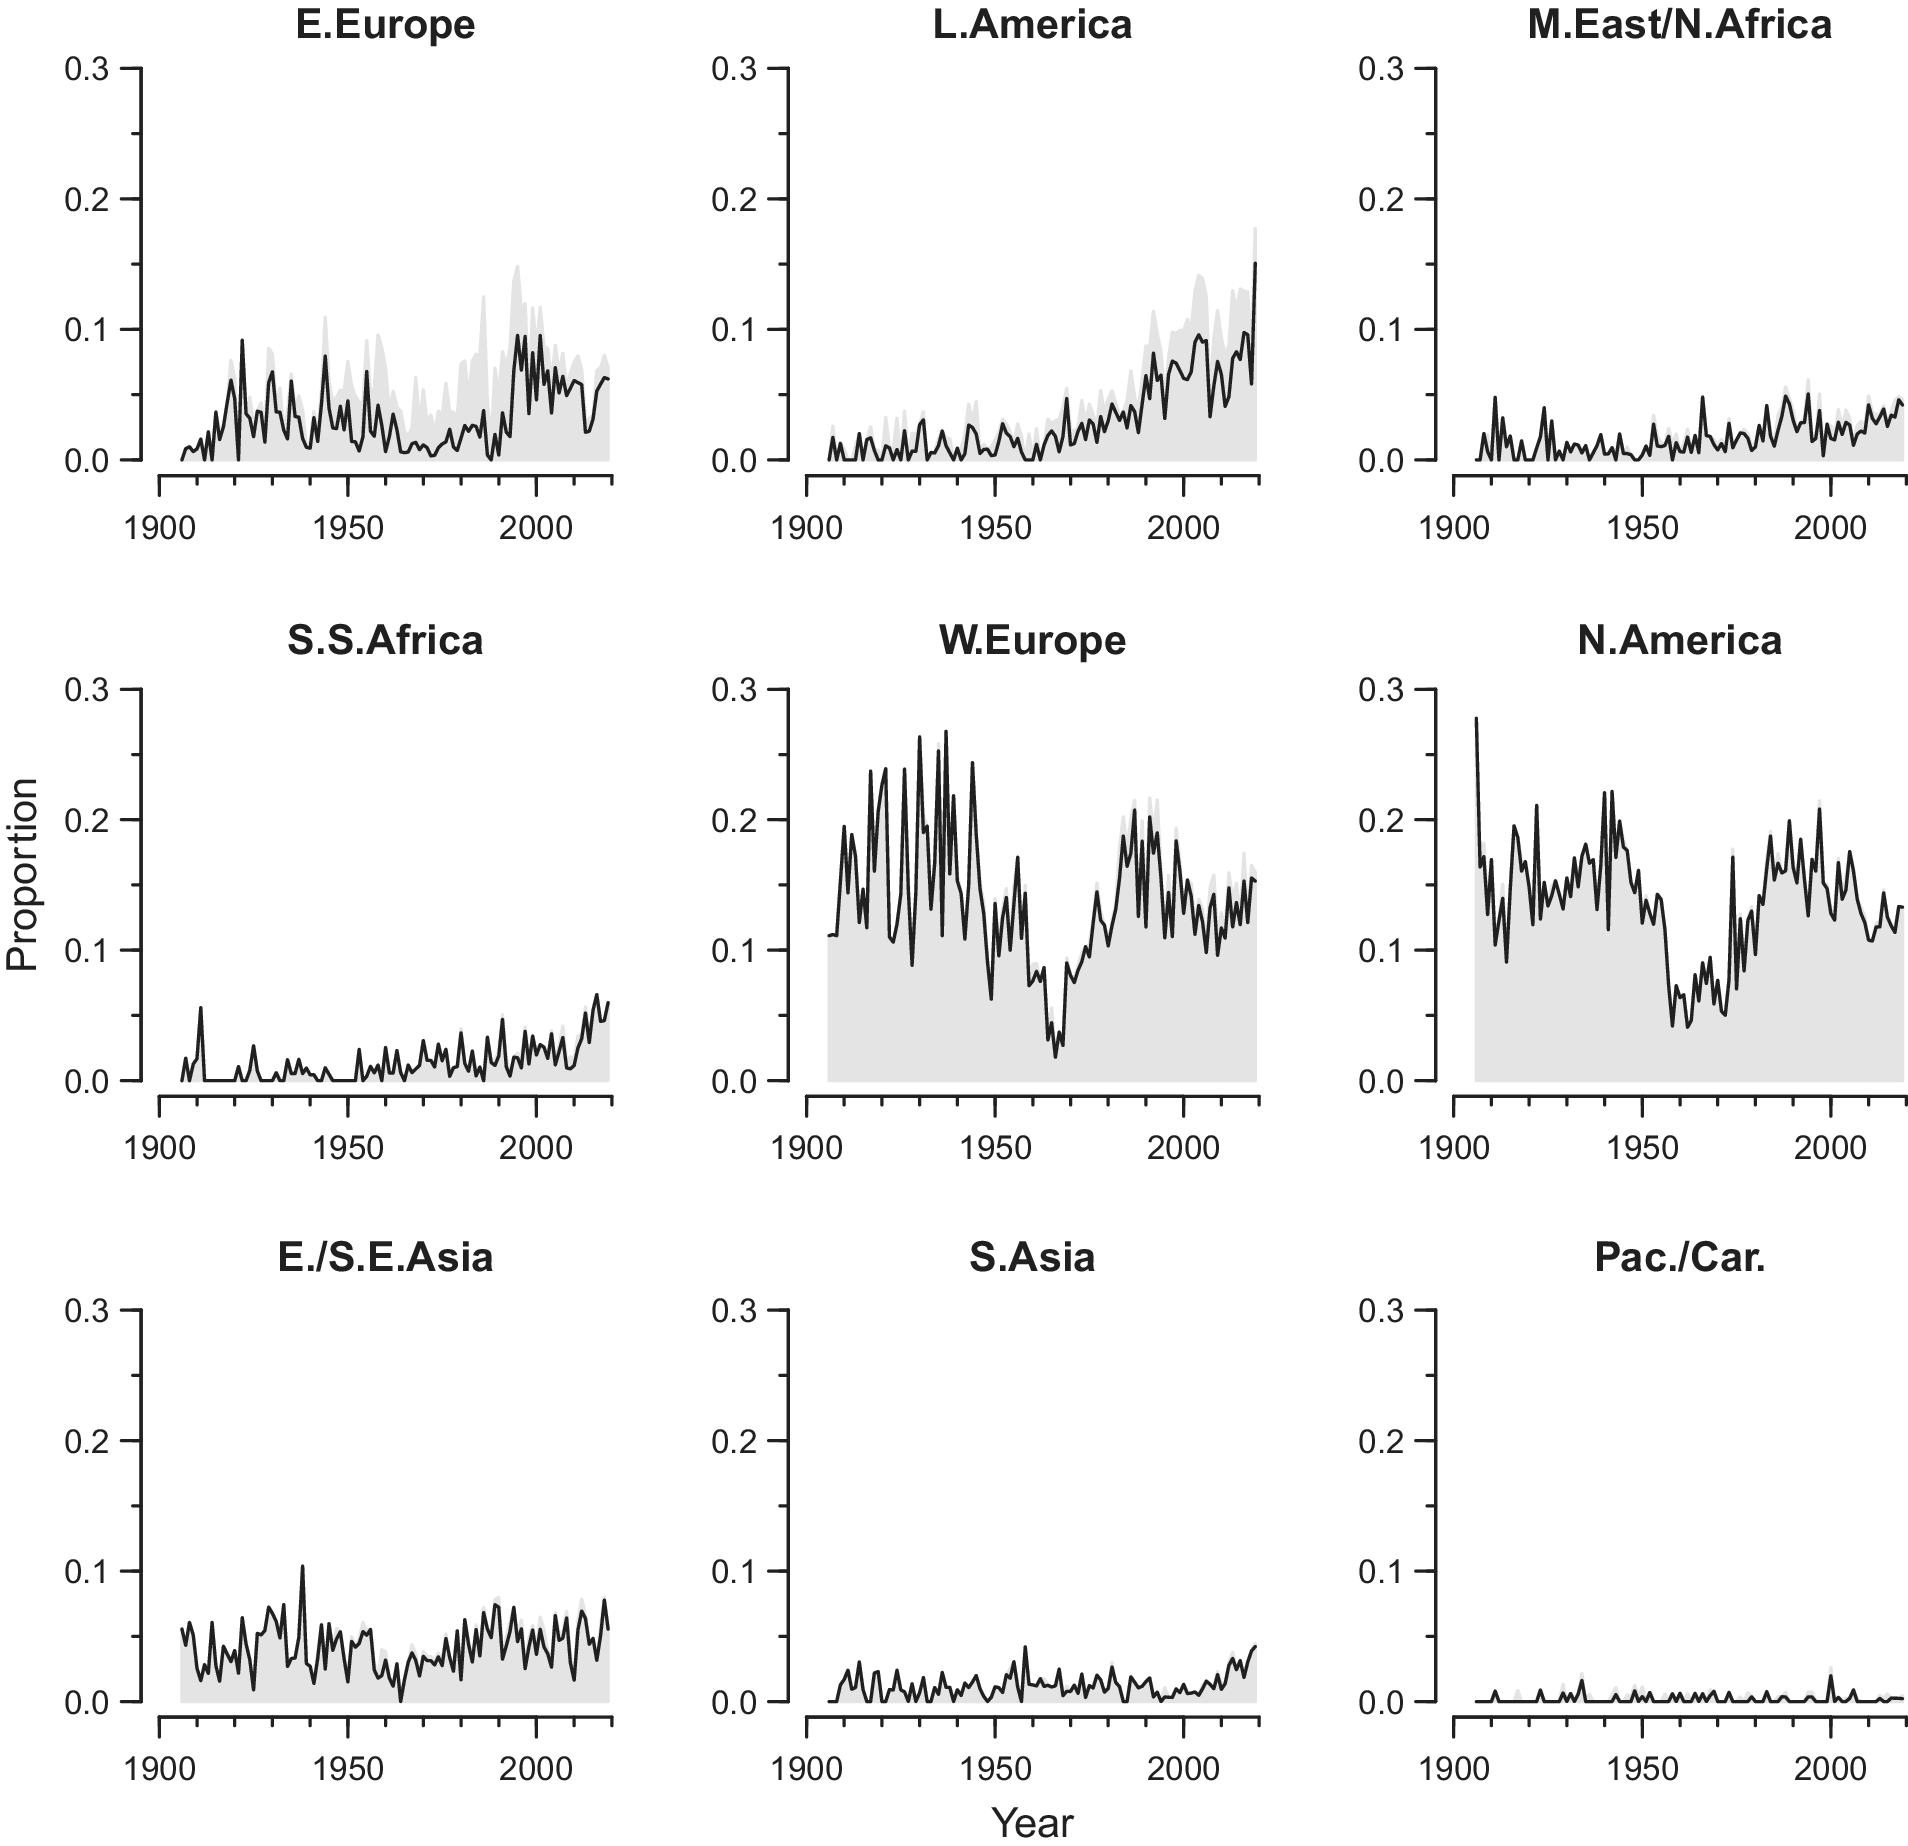
Second, Latin America stands out among the other regions as experiencing a gradual, positive, long-term trend in the number of references since the 1960s. The beginning of this period corresponds with the spread of military regimes in the region; examples of early works include Putnam (Reference Putnam1967), Lowenthal (Reference Lowenthal1974), and Thompson (Reference Thompson1975). In contrast, Eastern Europe observed a sharp jump in attention around the end of the Cold War, with the breakdown of Communist dictatorships and planned economies in that region. Several subsequent developments caught the attention of political scientists, including shock-therapy privatization, democratic transitions, and the expansion of EU membership to several “post-Communist” countries. Although less extensively researched, the MENA region, sub-Saharan Africa, and, to some extent, South Asia have also seen gradual increases in attention over time.Footnote 6 For instance, decolonization in Asia and Africa generated an early interest in explaining the politics and development of young states in these regions (Brecher Reference Brecher1963, Reference Brecher1969; Bowman Reference Bowman1968), whereas much of the increasing attention in later decades pertains to references in certain areas of comparative politics studying political development, regime change, and internal armed conflict.
Country Patterns
Unsurprisingly, the United States is the most studied country by political scientists, according to citation references in the eight top journals that we examine. Figure 5 shows that nearly 13% of all publications mention the United States either in the abstract or title (please note that the scale is truncated to fit the United States), outnumbering the sum of references made to the next six countries. The United Kingdom was the second most-referenced country, with roughly 4% of publications. Germany and France come in third and fourth with 2.5% and 2.1% respectively, while the most referenced non-Western countries, China and Japan, appear in 1.4% and 1.3% percent of publications. The next two countries are Russia and India, large non-Western countries, followed by the United States’ neighbors Canada and Mexico. The remainder of the list includes Italy, Brazil, Israel, Spain, and Argentina. No country belonging to Africa or Southeast Asia ranks among the most-referenced countries, which is also true when we only consider the three comparative politics journals (refer to online appendix figure B.5).
Proportion of references in titles or abstracts across 1906–2019, for the 15 most-referenced countries
Note: Scale truncated between 0.05 and 0.1.
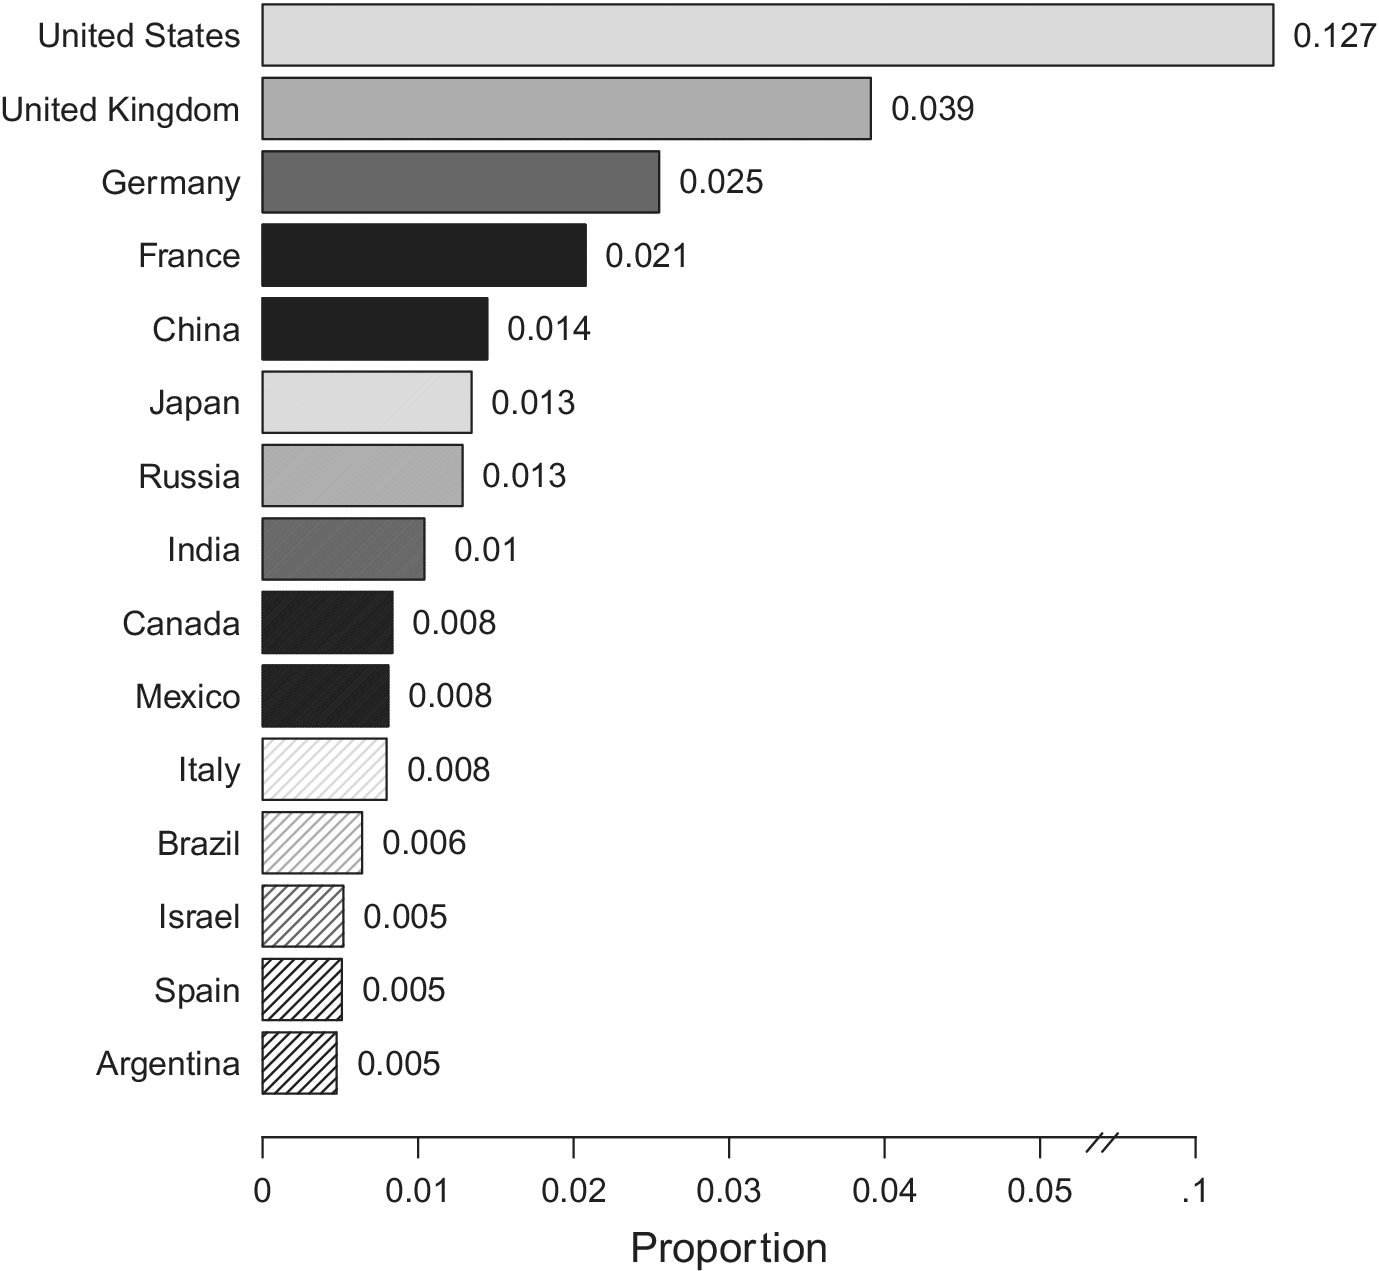
Figure 6 shows a color-coded map of the world, in which the extent of shading (percentage of grayscale) corresponds to the absolute number of references to each country.Footnote 7 The map clearly conveys that many African countries—even more populous states such as Ethiopia, the Democratic Republic of Congo, and Nigeria—are among the less referenced ones, as are Middle Eastern and many Central Asian countries. Further, many heavily populated states in South and Southeast Asia, including Pakistan, Bangladesh, Thailand, Myanmar, and even Indonesia, have received relatively little attention compared to small European states such as Denmark, the Netherlands, and Sweden.
Country coverage between 1906 and 2019
Note: Darker shading denotes more references.
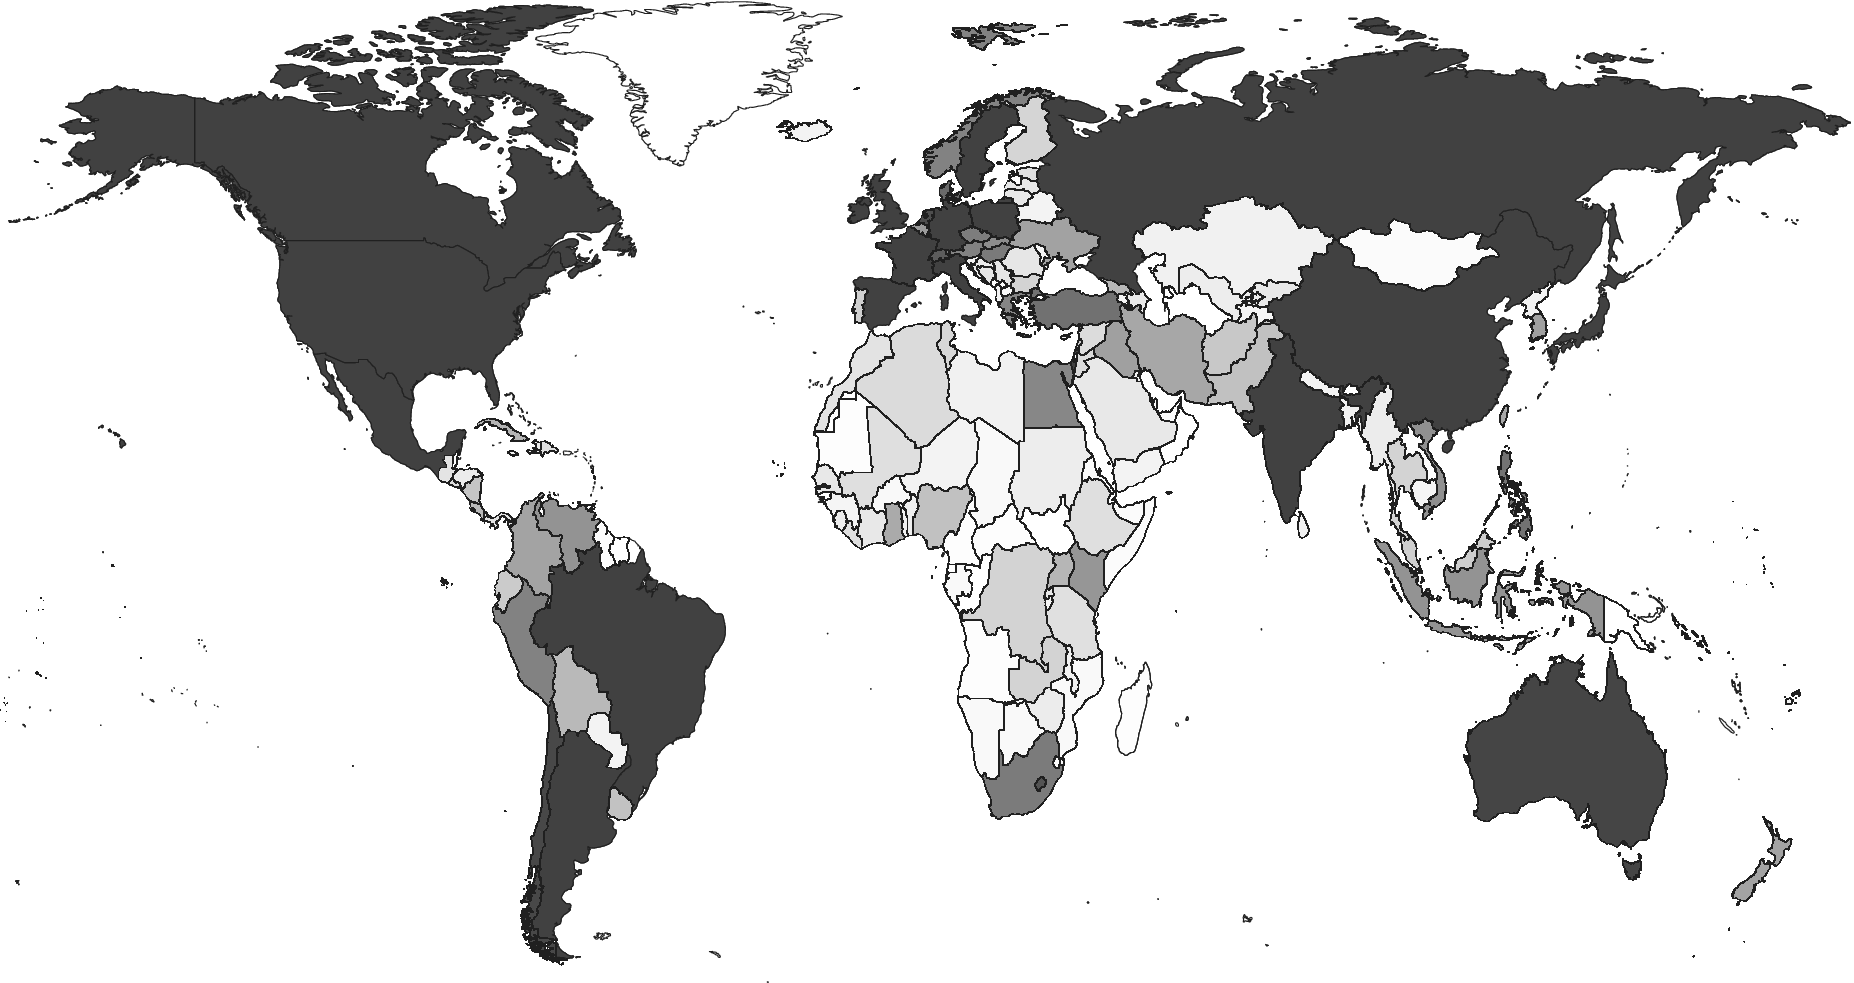
In all, twenty-one independent nations have never received specific mention in the titles or abstracts of leading journals. Several are microstates such as Andorra, Liechtenstein, Monaco, and San Marino, or island nations such as The Bahamas, Barbados, Comoros, The Maldives, and different Pacific island states.Footnote 8 The somewhat larger non-referenced countries include The Gambia, Oman, Papua New Guinea, and Turkmenistan. In contrast, other small (and especially Western) countries have been referenced numerous times, with Israel netting 144 references and Ireland 102. Insofar as the political systems of the omitted countries differ from the rest of the world, such discrepancies have likely influenced the base of empirical knowledge and theories on which political scientists have relied when describing and explaining political phenomena.
Overall, the United States has about as many references (3,505) as the next six countries combined (3,492). The U.S. dominance is especially clear in generalist journals such as APSR, AJPS and JOP (refer to figure 7). One contributing factor to the strong U.S. focus in these journals is that they include numerous articles in the field of American politics. In the APSR, the United States has more than three times the number of references as the next country (United Kingdom), and in the JOP and AJPS the equivalent differences are six-fold and nine-fold, respectively. Some of these differences may be explained by a strong focus on U.S. politics in early years and the long time series of some journals, especially the APSR. However, very little changes when we restrict the focus to post-World War II data for APSR and JOP, which were founded in 1906 and 1939, respectively (refer to online appendix figures A.1 and A.2).
Top ten most referenced countries in each journal
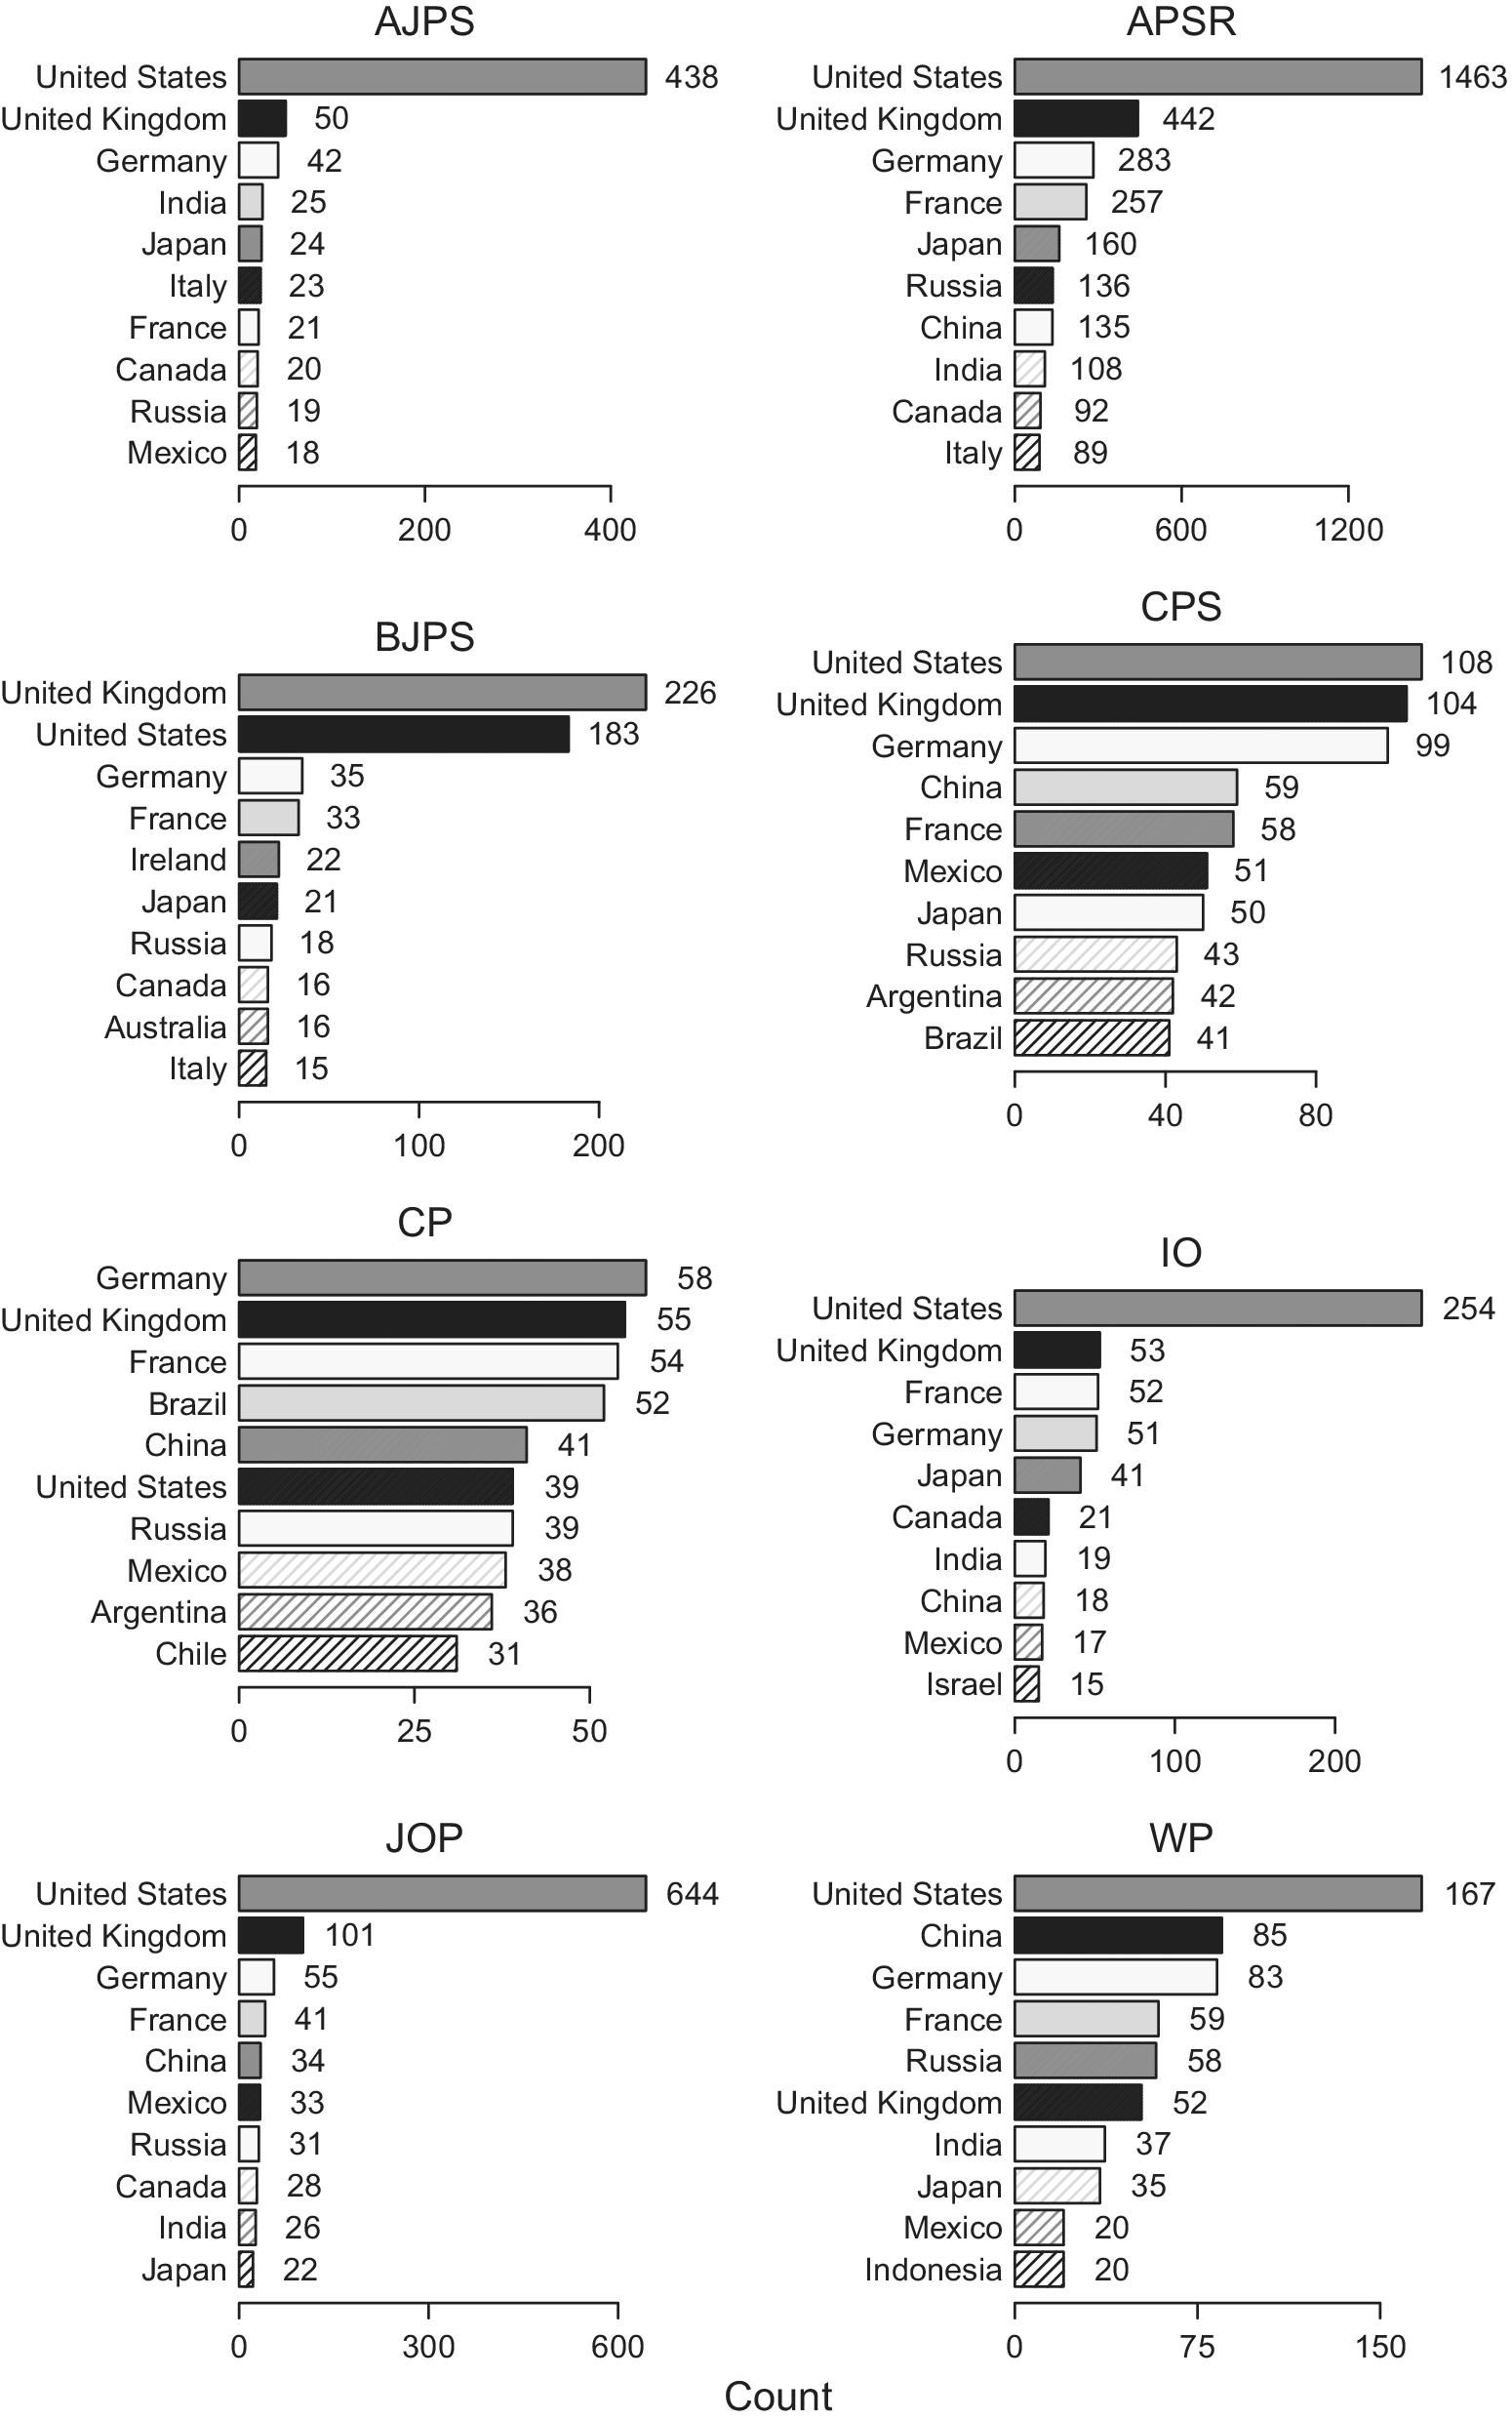
The United States is not as dominant in the comparative politics journals. Specifically, the difference in references to those of the next most-referenced countries—United Kingdom and Germany—is very small in CPS. In CP, the United States even ranks behind five other countries (figure 7). In sharp contrast, the difference between references to the United States and the next most-cited country, United Kingdom, is five-fold in the more international relations-focused journal IO. Furthermore, the United States was referenced about six times as often as the most-referenced non-Western country (Japan, 41) in IO, and thirteen times as much as the most-referenced non-OECD countries (India and China, nineteen and eighteen references each). The criticism that IR as a subfield is heavily centered on western countries (Acharya and Buzan Reference Acharya and Buzan2009; Dunn and Shaw Reference Dunn and Shaw2001; Colgan Reference Colgan2019) thus finds support, at least regarding references in the major field journal.
Regression Analysis
We have discussed the potential for a “Western bias” based on descriptive statistics at the country and regional level without going deeper into the factors that may explain it. However, several factors might shape scholars’ abilities to conduct case-specific research in a particular country. Political science research has long been constrained by issues related to data availability, logistics of field research, institutional reach, and language barriers. The collection and reporting of statistics is hampered in poorer and less democratic countries, and it is more difficult to conduct field research in areas beset by conflict or in dictatorships (Kapiszewski, MacLean, and Read Reference Kapiszewski, MacLean and Read2018; Wood Reference Wood, Boix and Stokes2009). Less developed and smaller countries may also have fewer institutions and resources to collaborate with counterparts elsewhere, increasing transaction costs related to doing research in and on these countries. The language in which materials are available might also affect the likelihood of being able to carefully study the politics of a country. Thus, differences in the country focus of published political science research could stem from practical issues rather than a lack of interest or concern.
To discern what factors drive references to specific countries, we combined the information on annual references with cross-national time-series data from the Varieties of Democracy (V-Dem) Project (Coppedge et al. Reference Coppedge, Gerring, Knutsen, Lindberg, Teorell, Altman, Bernhard, Fish, Glynn, Hicken, Lührmann, Marquardt, McMann, Paxton, Pemstein, Seim, Sigman, Skaaning, Staton, Cornell, Gastaldi, Gjerlow, Mechkova, von Romer, Sundstrom, Tzelgov, Uberti, Wang, Wig and Ziblatt2020) and estimated regressions at the country-year level. First, we hypothesize that wealthier, more economically developed countries are more likely to be the focus of political science research. Rich countries could be scrutinized more often because they support more national political scientists studying the country’s electoral system, party system, bureaucratic organization, public policies, and the like. Moreover, rich countries are typically more powerful (attracting the focus of IR scholars; see Hendrix and Vreede Reference Hendrix and Vreede2019) and have undergone various processes of modernization and political change—e.g., developing a Weberian bureaucracy or an extensive welfare state—that make them attractive objects of study for different subfields in comparative politics and public administration. We therefore include the (natural) log of per capita GDP (from Maddison Reference Maddison2010, via V-Dem). Second, we expect that larger countries receive more attention, all else equal, because of their larger number of national political scientists, more readily available source material of various kinds (news articles, history books, etc.), and likely greater heterogeneity in political institutions (e.g., large countries are more often federal). We therefore include measures for logged population and land area.
A country’s political system may also influence the likelihood with which political scientists have studied it, either because of a normative interest in explaining the determinants of democracy, because of interest in institutions present in democracies (competitive elections, certain types of parties, etc.), or because of the difficulties of conducting field research in authoritarian settings. We therefore include Polyarchy (Teorell et al. Reference Teorell, Coppedge, Lindberg and Skaaning2019), V-Dem’s main measure of electoral democracy, as a covariate. We also include dummy variables denoting the occurrence of an international conflict, civil war, or democratization episode during the previous ten years. The conflict data are from the Correlates of War dataset (Sarkees and Wayman Reference Sarkees and Wayman2010) and the coding of democratization is based on whether we observe a transition to democracy in a categorical regime measure from Lührmann, Tannenberg, and Lindberg (Reference Lührmann, Tannenberg and Lindberg2018). The rationale for including these measures is that scholars working in certain literatures—and in particular, conflict and democratization studies—might focus on country cases that have recently undergone relevant political changes. Finally, to the extent that researchers should be more likely to read about and conduct fieldwork in countries where they speak the local language, being an English-speaking country or having another “global language” such as Spanish or Arabic should increase the number of references made to a country. Hence, we include dummy variables that indicate countries in which English, Spanish, French, Arabic, and Chinese are predominantly spoken.Footnote 9
We ran ordinary least squares (OLS) regressions, with country-year as the unit of analysis, estimating the number of references and using the variables listed earlier as covariates. All models include year fixed effects to account for the possibility of non-linear time trends in number of references—not least because the number of publications varies considerably over time. The resulting sample includes data from 150 countries with time series extending back to 1906. To make the most of the reference data and prevent biases stemming from listwise deletion, we used multiple imputation to generate five imputed datasets for missing values of GDP and population. We mainly discuss and illustrate results from models based on the samples that include imputed data (N=16,425) and we report estimates without imputed data (N=8,641) in online appendix D.
Figure 8 plots the estimated coefficients, with 95% confidence intervals, from our benchmark specification using imputed data. The results lend support to the notions that richer, more populous, and more democratic countries have tended to receive more attention than poorer and autocratic countries. These results are largely robust to omitting imputed data (online appendix table D.1), but also to controlling for region fixed effects (online appendix figure C.1) and omitting the two most referenced countries—the United States and the United Kingdom—from the sample (appendix figures C.2 and C.3). Thus, the tendency of political scientists to focus on richer and more democratic countries does not simply reflect that such countries are more prevalent in Western Europe and North America.
Coefficient plot for OLS regression on number of references
Note: 95% confidence intervals. Includes imputed values. Year fixed effects not shown.
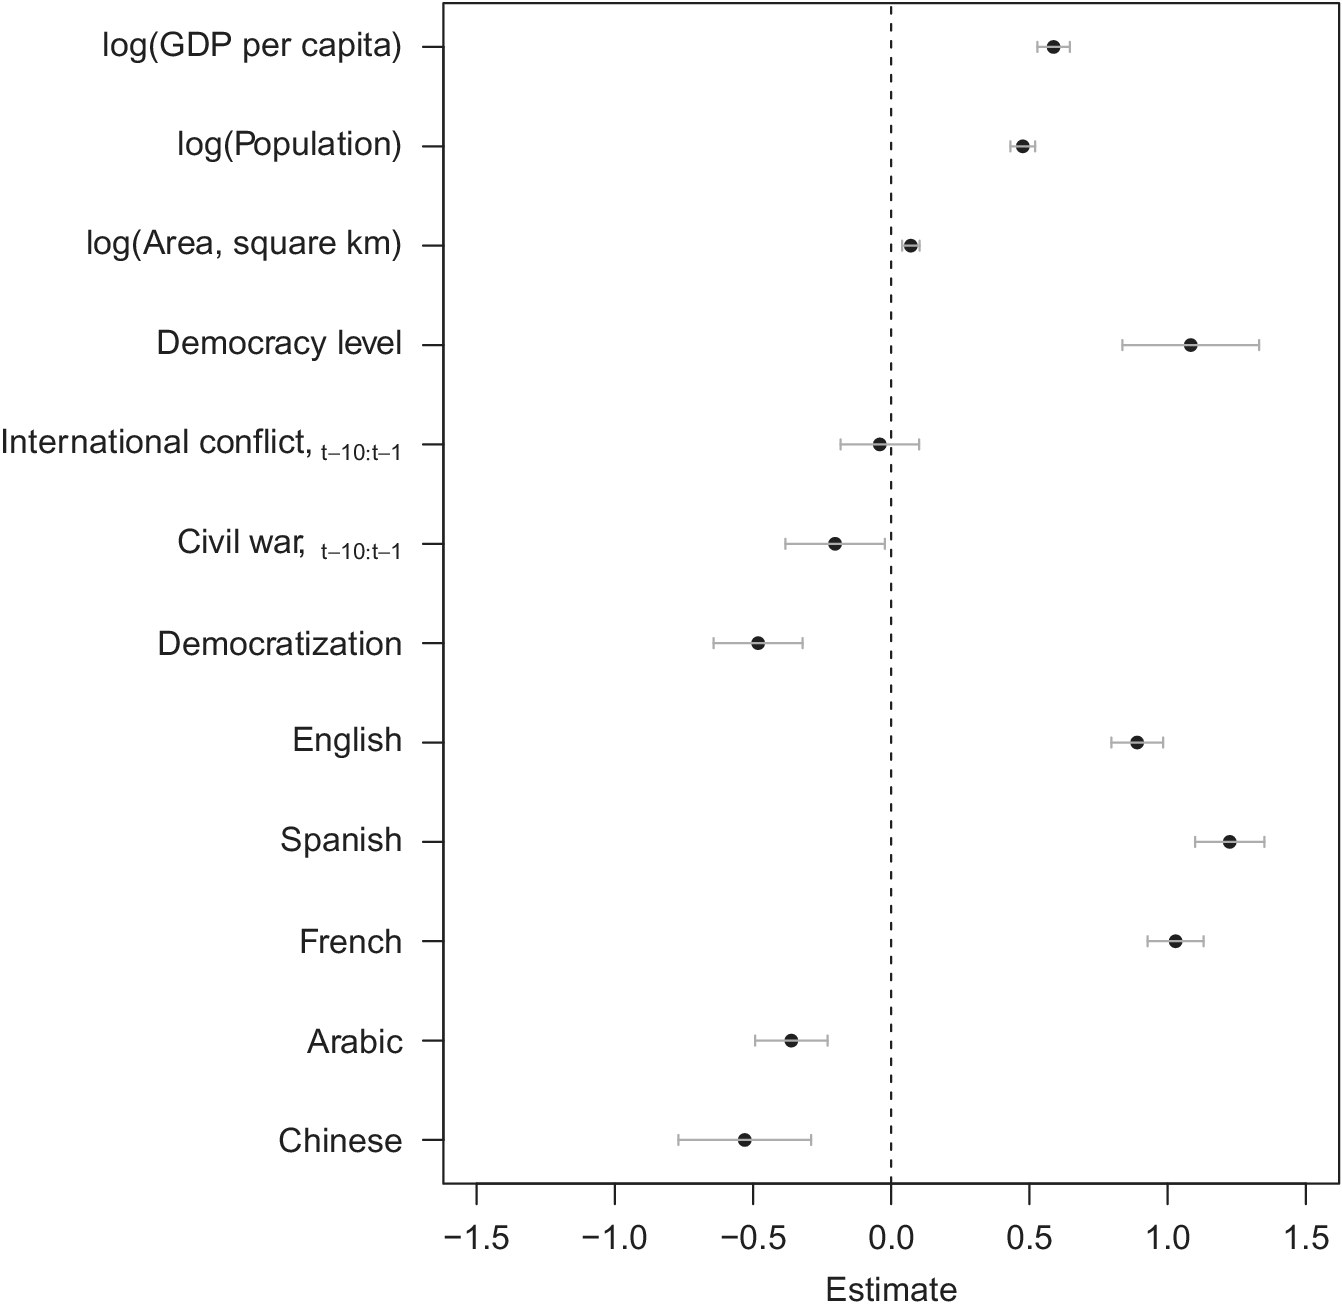
With regard to conflict and regime change processes, countries that experienced democratization during the previous ten years actually tended to receive significantly fewer references, all else equal. The democratization result is seemingly at odds with the observed region-level trends for regions like Latin America and Eastern Europe, which experienced growing citation numbers after periods with democratization. One suspicion is that including the United Kingdom and United States may drive results, but the democratization result remains negative and significant when dropping these countries. However, the result turns insignificant once omitting the two countries, omitting imputed data, and controlling for region fixed effects in the same model (online appendix table D.4). We note that democratic breakdown does not show a similarly clear relationship, although it also carries a negative point estimate when added to the model (online appendix figure A.3). Results are less robust for the conflict dummies in our benchmark, although they show civil conflict to be negatively associated with references. The benchmark results suggest that Spanish- and French-speaking countries are more often studied. Estimates for language dummies for English depend on including the United States and United Kingdom in the sample, Arabic ceases to be significant when we control for region, and results for Chinese vary considerably based on model specification.
The number of journals varies across the time series, with only APSR being included for the first few years. For this reason, and for answering the interesting question of whether there is homogeneity or marked differences across journals in different subfields, we re-estimated the model in figure 8 separately for each journal. Models based on non-imputed values are shown in online appendix D and models based on imputed values are illustrated in online appendix E. These results show that patterns are remarkably consistent across journals. Notably, income, population size, and democracy level are related to country references in each journal, with a couple of caveats to this generalization. The estimates associated with GDP per capita and population are consistently positive and significant when excluding imputed data, but insignificant at the 1% level for several journals once including imputed data.
The positive relationship between democracy and citations is fairly strong, except that there is no relationship between democracy level and references for APSR and JOP in models without imputed values, and not for AJPS when imputed values are used. Another persistent finding across models is that countries in which Spanish is a predominant language are more likely to be referenced for all journals. Being an English-speaking country is consistently associated with more references in the generalist and IR journals (APSR, AJPS, JOP, BJPS, IO) but less so in the comparativist journals. French is also more represented across journals except for BJPS, CP, and CPS. Another robust finding, which holds for each journal except APSR, is that countries that recently underwent democratization were less likely to be represented. As figure 1 illustrates, interest in democratizing countries is a relatively new phenomenon.
Conclusion
Drawing on a novel dataset comprising the abstracts and titles of nearly 28,000 publications in eight top political science journals from 1906 to 2019, we have described and discussed patterns in the geographical coverage of political science research. Overall, we document a trend towards more regional diversity—previously “neglected” regions have become more popular at different points in time over the last few decades. Yet certain subfields (such as international relations) are more focused on a select few countries than others (comparative politics, and especially democratization research; see also Pelke and Friesen Reference Pelke and Friesen2019). Despite such nuances, the overall pattern in the discipline is still one of a strong Western focus, with the United States having been—and remaining—a particularly prominent research context. Scrutinizing these cross-country patterns more in depth, we find that some of the focus on Western countries is linked to more general factors, as political scientists have systematically tended to focus their research on richer and more democratic contexts, everything else equal. Poorer and more autocratic countries are far less likely to be the focus of articles published in the field’s top journals.
These findings point towards the possibility that the political systems and processes that are characteristic of poorer, autocratic countries might be both inadequately described and under-theorized. As we have discussed, our finding that particular types of countries, and even regions of the world, are “over-represented” in certain sub-fields corresponds to long-held suspicions among many political scientists in these fields. IR scholars studying the international politics and foreign policy of non-Western regions such as (East) Asia (Kang Reference Kang2003; Chen Reference Chen2011; Johnston Reference Johnston2012) or sub-Saharan Africa (Dunn and Shaw Reference Dunn and Shaw2001; Lemke Reference Lemke2003) have argued that IR frameworks, including realism and neo-liberalism, build heavily on historical observations from European politics, but also on more contemporary experiences from the United States and its interactions with allies and enemies. If such theories, which are often set out to be general in nature, largely draw from experiences such as the Vienna Congress or emergence of NATO, they may inadvertently fail to explain key structures and modes of interactions appearing between, say, African states. While we do not investigate such scope conditions and potential biases directly (but, see Colgan Reference Colgan2019), we systematically test and provide new evidence to the suspicion that forms the leading premise in the earlier argument, namely that IR scholars much more often consider Western- than non-Western contexts—and in particular focus on the United States—in their publications.
While we find that there is a somewhat more egalitarian distribution of research contexts in comparative politics, the focus is still heavily placed on Western European and North American countries. Hence, our main theories of party systems, for example, may have less general applicability than sometimes thought. Though we only speculate, it could be that by studying political parties in more areas, “standard theories” would not so readily assume that the left–right economic dimension is the key dimension that distinguishes major parties in political systems. Insofar as theories in comparative politics are not built from context-free, abstract considerations alone, but rather are inspired by observations of particular historical events and trends, the countries that researchers have studied and know well likely matters for the assumptions and contents of these theories. Our analysis also documents that the recent trend has been towards a more “globalized” discipline, though many countries and political systems remain “under-studied,” even in comparative politics. This, in turn, leads to less comprehensive descriptions of political systems around the world. It might also lead to less developed and less fruitful theories for understanding political regimes, parties, legislatures, interest organizations, and the like than if comparativists were to utilize information from all available contexts in their research.
Supplemental Materials
A list of permanent links to Supplemental Materials provided by the authors precedes the References section.
To view supplementary material for this article, please visit http://doi.org/10.1017/S1537592720002509.



