


Introduction
Malathion is an organophosphate (OP) insecticide that has been on the market since the 1980s and remains one of the most widely used pesticides worldwide, largely due to its relatively low acute toxicity compared to other compounds in its class. Its mechanism of action involves the inhibition of acetylcholinesterase, resulting in excessive cholinergic stimulationReference Selmi, Rtibi, Grami, Sebai and Marzouki1. In Brazil, malathion has been employed since the 2010s to control mosquito populations, particularly those of the Aedes genus, which are vectors of diseases such as Dengue, Zika and Chikungunya.
However, the widespread and indiscriminate use of malathion contributes to environmental contamination and increases the risk of human exposure. It is currently estimated that virtually everyone around the world is exposed to malathion through multiple routesReference dos Santos, Naime and de Oliveira2,Reference Navarrete-Meneses, Salas-Labadía and Sanabrais-Jiménez3 , and its metabolites have been detected in the urine of women experiencing infertilityReference Streich, Beltran and Pier4. In 2022, Vasseghian et al.Reference Vasseghian, Dragoi, Almomani, Golzadeh and Vo5 demonstrated that drinking water samples from three different countries (Mexico, Iran and Ethiopia) contained malathion levels well above those permitted by regulatory standards, which is of 0.1 μg/L. According to the World Health Organization, the acceptable daily intake (ADI) of malathion in food is up to 0.03 mg/kg/day, chronic exposure – even at doses below those associated with overt toxicity – can have toxic effects on several human systemsReference Zidan6,Reference Badr7 . Its toxic effects are largely mediated by oxidative stress, which can damage DNA integrity and activate pro-apoptotic pathwaysReference dos Santos, Naime and de Oliveira2.
Infertility is a condition affecting the reproductive system of either sex and is defined as the inability to achieve pregnancy after 12 months of regular, unprotected sexual intercourse. In women, infertility can result from dysfunctions of the ovaries, fallopian tubes, uterus, and/or endocrine system8. Contributing factors include advanced maternal age, STIs – sexually transmitted infections, and emotional or physical stressReference Hart9. Lifestyle choices and exposure to environmental contaminants also play a significant roleReference Vander Borght and Wyns10.
The placenta is a transient organ that develops in the uterus during pregnancy and plays essential roles in sustaining gestation and supporting fetal development. Its primary functions include enabling gas and nutrient exchange between the mother and fetus, producing key pregnancy hormones such as estrogen and progesterone, and acting as an immunological barrier to protect the fetus from infections and maternal immune rejectionReference Carter11,Reference Burton and Fowden12 . Proper placentation depends on uterine receptivity, embryo apposition, invasion of the endometrial stroma, and stromal cell decidualizationReference Hamid and Zakaria13,Reference Furukawa, Tsuji and Sugiyama14 . Disruptions in these processes during the critical window of placental development can lead to pregnancy loss, fetal growth restrictionReference Rathbun and Hildebrand15, and complications such as preeclampsiaReference McMaster, Zhou and Fisher16.
Oxidative stress is a well-established pathophysiological condition that leads to significant cellular damage and may result in cell deathReference Melchiorri, Reiter, Sewerynek, Hara, Chen and Nisticò17. It is defined by an imbalance between the production of reactive oxygen species (ROS) and the organism’s antioxidant defensesReference Burton and Jauniaux18. ROS include oxygen radicals and non-radical oxidizing agents that can be easily converted into free radicals. These are typically generated in the mitochondria during cellular respiration. At physiological levels, ROS are involved in ATP production, cell signaling, gene expression, and immune defenseReference Ruder, Hartman and Goldman19–Reference Barbosa, Costa, de Alfenas, De Paula, Minim and Bressan21. However, at elevated levels, ROS become cytotoxic, reacting with and damaging lipids, proteins, and DNA. This leads to lipid peroxidation of cell membranes, causing structural changes, increased permeability, ionic imbalance, and the release of hydrolytic enzymesReference Mello Filho, Hoffmann and Meneghini22.
Previous studies from our group have shown that exposure to low doses of malathion during juvenile and pubertal periods induces oxidative changes and morphophysiological alterations in both maleReference Erthal, Siervo GEM de, Frigoli, Zaninelli, Verri and Fernandes23,Reference Erthal, Staurengo-Ferrari and Fattori24 and femaleReference Erthal-Michelato, Frigoli, de Aquino, Punhagui-Umbelino, Scarano and Fernandes25 reproductive systems. Despite these findings, there is limited research on the effects of malathion exposure during critical postnatal developmental windows – specifically the juvenile and pubertal phases – on fertility, placental function, and intrauterine development.
This is particularly relevant given that the ovarian follicular reserve is established at birthReference Bruxel, da Silva and da Silva26, and puberty marks the maturation of the hypothalamic-pituitary-gonadal axis, a key regulator of female reproductive functionReference Ojeda, Andrews, Advis and White27. Because the ovarian reserve is established around birth, oocytes remain vulnerable to environmental toxicants encountered prior to conception, which may induce long-lasting alterations with consequences for reproductive function and pregnancy outcomes later in lifeReference He, Zhang, Yang and Wang28. Therefore, the present study seeks to fill this gap by investigating whether preconception exposure to low doses of malathion during the juvenile and pubertal periods impairs fertility, placental function, and fetal growth in rats, building upon our previously published findingsReference Erthal-Michelato, Frigoli, de Aquino, Punhagui-Umbelino, Scarano and Fernandes25.
Materials and methods
Animals and experimental conditions
Thirty-six female Wistar rats (PND 21) from different litters were obtained from the Central Bioterium of the State University of Londrina (CCB-UEL) and acclimated to the Bioterium of the Laboratory of Toxicology and Metabolic Disorders of Reproduction (LT&DMR) for one day before the start of the experimental period. Eighteen male Wistar rats (PND 80) from different litters were also obtained and acclimated at the LT&DMR bioterium for three days before mating began; the male animals were not exposed to malathion at any time. All animals were kept under controlled conditions (23 ± 2°C; 12-h light and 12-h dark cycle, with lights off at 7 p.m.), housed in polypropylene cages (43 × 30 × 15 cm; 3 animals per cage), and provided with water and food ad libitum. Animal care and handling procedures complied with the Animal Research: Reporting of In Vivo Experiments (ARRIVE) Guidelines and were approved by the Ethics Committee on Animal Use of the State University of Londrina (CEUA/UEL protocol number OF. CIRC n. 019/2023).
Experimental design
The animals were randomly distributed into three experimental groups: Control (C, n = 12), malathion 10 mg/kg body weight (M10, n = 12), and malathion 50 mg/kg body weight (M50, n = 12). The experimental design is outlined in Fig. 1. Malathion was used at doses below the NOAEL (No-Observed-Adverse-Effect Level) for the reproductive system of rats (130 mg/kg body weight). Malathion doses were adapted from Geng et al.Reference Geng, Shao, Zhang, Ng and Peng29, and administered from PND 22 to 60. The M10 and M50 doses represents 0.5% and 2.5% of oral LD50 for adult male rats, respectively. These doses have been used in previous studies by our group using maleReference Erthal, Siervo GEM de, Frigoli, Zaninelli, Verri and Fernandes23,Reference Erthal, Staurengo-Ferrari and Fattori24 and female Wistar ratsReference Erthal-Michelato, Frigoli, de Aquino, Punhagui-Umbelino, Scarano and Fernandes25.
Schematic outline of the experimental design.

Figure 1. Long description
A line graph illustrating the experimental design timeline for evaluating the effects of malathion exposure on animals. The timeline starts at postnatal day 22 (PND 22) with the administration of malathion to the animals, indicated by an image of a syringe. The exposure period continues until postnatal day 61 (PND 61), followed by a mating period. The gestational period begins at gestational day 0 (GD 0) and ends at gestational day 18 (GD 18), where animal euthanasia and biological material collection occur, depicted by an image of a pregnant rat. The graph includes labels for the start of puberty onset evaluation at PND 27 and the transition points between the exposure, mating, and gestational periods. All values are approximated.
In this study, the exposure period was adjusted to PND 22 to 60, encompassing the juvenile and pubertal periods, as established by Ojeda et alReference Ojeda, Andrews, Advis and White27. The animals were exposed via gavage to 10 or 50 mg/kg body weight. All experimental groups were treated daily during the experimental period, and the control group animals received only the vehicle (saline 0.9%).
Preparation of malathion solution
Malathion (purity: 50%; diethyl 2-[(dimethoxyphosphinothioyl)sulfanyl]butanedioate; CAS No. 121-75-5; Cheminova) was acquired from Dominus Química (Jandaia do Sul, Brazil). Aiming to mimic human exposure the commercial formulation was used. The liquid compound was diluted daily in saline solution (0.9%). The administration volume was of 0,5 mL a day. Administration occurred daily starting on PND 22 via gavage.
Determination of puberty onset
The average day of complete vaginal opening was determined for each animal. From this day onward, vaginal smears were collected daily and analyzed under light microscopy, following the method described by Marcondes et al.Reference Marcondes, Bianchi, Tanno and Marcondes30 Each phase of the cycle was identified based on the proportion and morphology of the predominant cell types: proestrus was characterized by the presence of nucleated epithelial cells; estrus by the predominance of cornified anucleate epithelial cells; metestrus by a mixture of cornified and round epithelial cells and leukocytes; and diestrus by the predominance of leukocytes. The day of the first estrus, together with the day of vaginal opening, was recorded as an indicator of puberty onset in Wistar ratsReference Marcondes, Bianchi, Tanno and Marcondes30,Reference Goldman, Murr and Cooper31 .
Animal mating
Following the exposure period, females were checked for proestrus prior to being paired with males for mating. Estrous cycle monitoring was performed by daily vaginal cytology using standard criteria to identify the stages of the cycle. Vaginal smears were collected each morning and analyzed by the same trained observer throughout the study to minimize inter-observer variability. To avoid potential male-related bias, males were rotated among females across mating sessions. Males were paired overnight in a 1:1 ratio with females checked the next day at 7 a.m. The presence of spermatozoa in the vaginal smear the following morning was used to confirm successful mating and to designate gestational day 0 (GD0). During gestation, the females had access to water and food ad libitum, and their consumption and body weight were measured every three days.
Material collection
At GD 18, pregnant females were anesthetized with a combination of ketamine 100 mg/kg body weight (Sedomin® 10%, Avellaneda, Argentina) and xylazine 10 mg/kg body weight (Anasedan®, Paulínia, Brazil), weighed, and euthanized by exsanguination. Blood samples were collected from the hepatic portal vein in serum gel tubes (BD, Plymouth, UK) for hormonal and biochemical assays. The livers and kidneys were removed, weighed, and discarded. The ovaries were removed, weighed on an analytical balance, and the number of corpora lutea was determined by visual inspection. The gravid uterus was exposed, and amniotic fluid was collected from all amniotic sacs. The organ was then removed, weighed, and the number of implantations, placentas, and fetuses was determined. The placentas and their respective fetuses were weighed, measured with a caliper, and then the placentas were fixed in 4% paraformaldehyde (PFA) solution. Fetuses were measured in a sagittal, neutral position, from the top of the head to the bottom of the rump, this measurement of the fetus’s longest axis is considered the crown-rump length (CRL). Sections between the implantation sites of the right uterine horn were collected and fixed in 4% PFA. The uterine sections and three placentas per female were embedded in Histological Paraffin (Synth®, Diadema, Brazil). Eighteen non-consecutive sections of 5 μm, separated every 30 μm, were obtained from the uteri, placed on histological slides, and stained with hematoxylin and eosin (HE). From the placentas, eight non-consecutive sections of 5 μm, spaced every 40 μm, were obtained, placed on histological slides, and stained with periodic acid-Schiff (PAS). Other portions of the uterus, between the implantation sites of the left uterine horn, and three placentas per female were collected and frozen at −80°C for oxidative profile evaluation. Another three placentas per female were frozen at −20°C for subsequent glycogen determination in the tissue.
Fertility evaluation
Based on the number of corpora lutea in the ovaries, and the number of implantations, placentas, and fetuses in the uterus, the pre-and post-implantation loss rates, fertility potential of the females, and the gestational rate of the experimental groups were calculated according to formulas 1, 2, 3 and 4, respectively.
 $$\eqalign{&{Pre-{implantation}\, loss\,rate} \cr &={{{Number}\ of\ {corpora}\ {luteum}-{Number}\ of\ {implantation}\ {sites}} \over {{Number}\ of\ {corpora}\ {luteum}}}{x\,100}}$$
 $$\eqalign{&Post-{implantation}\ loss\ rate\cr &=\,{{{Number}\ of\ {implantation}\ {sites}-{Number}\ of\ live\ {fetus}} \over {{Number}\ of\ {implantation}\ {sites}}} x\ 100}$$
 $${Fertility}\ {potential}={{Number}\ of\ {implantation}\ {sites} \over {Number}\ of\ {corpora}\ {luteum}}\ x\ 100$$
 $${Gestational}\ rate={{Number}\ of\ {pregnant}\ {females} \over {Number}\ of\ {inseminated}\ {females}}\ x\ 100$$
Hormonal dosages and biochemical assays
Serum was obtained after centrifuging the blood at 2,400 r.p.m. at 3.5°C and stored at −20°C until assays were performed. Estradiol levels were measured at the Laboratory of Applied Immunology of the State University of Londrina Hospital (HU-UEL) using chemiluminescence in a single assay to avoid inter-assay errors. Progesterone levels were measured by radioimmunoassay at a private company named Pesquisas Hormonais based in São Paulo, Brazil, also in a single assay.
Alanine aminotransferase (ALT), aspartate aminotransferase (AST), glucose, triglycerides (TG), urea, creatinine, total cholesterol (TC), and high-density lipoprotein (HDL) were measured according to the instructions of commercial kits (Gold Analisa®, Belo Horizonte, Brazil). Kinetic analyses were performed using a microplate reader (MultiSkan Skyhigh, Thermo Fisher Scientific Inc., USA). Sodium, potassium, and chloride ion levels were measured using a RAPIDPoint® 500 Blood Gas Analyzer (Siemens AG, Munich, Germany).
Uterine and placental morphometrical analysis
Photomicrographs of uteri were taken using the Opton photomicroscope (100x magnification) and Motic software (version 3.1 for MacOS). Five transverse measurements of the endometrium and myometrium were taken in each photographed uterine section using Image J software (version 2.14.0 for MacOS), totaling 30 measurements for each compartment.
Photomicrographs of PAS-stained placental sections were taken at 400x magnification. From these images, the area occupied by fetal capillaries, maternal lacunae, and trophoblastic septa in the labyrinthine zone was assessed using Image J software. In the decidua region, also stained with PAS, the presence and extent of glycogen granules were qualitatively evaluated.
At the time of euthanasia, measurements were taken of the major and minor axes lengths of the placentas, as well as their depth. In total, 411 fetuses and placentas were measured: 126 from control group, 149 from M10 and 136 from M50. From these measurements, placental eccentricity and volume were calculated using formulas 5 and 6, respectively.
 $${Placental}\ {eccentricity}=\sqrt{1-\left({{Minor}\ axis\ {length} \over {Major}\ axis\ \text{length}}\right)^{2}}$$
 $$\eqalign{{{Placental}}\ {{volume}} \cr & = {{{Minor}}\ axis\ {{length}}\ {\rm{x}} \; {\rm{Major}} \; {\rm{axis}} \; {\rm{length}}\; {\rm{x}} \;{\rm{depth}} \;{\rm{x}}\;\rm \pi \over {45}}}$$
Biochemical assays of the amniotic fluid and placenta
Amniotic fluid samples – pooled from all fetuses from the same dam – were frozen at −20°C, where it remained until the time of analysis. Total protein, urea, alkaline phosphatase, lactate, total glucose, and total calcium levels were measured using chemiluminescence on an automated analyzer (Dimension® EXL 200™ Integrated Chemistry System, Siemens, Munich, Germany), according to the manufacturer’s instructions. Sodium, potassium, and chloride ion levels were measured using a RAPIDPoint® 500 Blood Gas Analyzer (Siemens AG, Munich, Germany).
To evaluate the placental glycogen reserve, the method described by Schaubroeck et al.Reference Schaubroeck, Leitner and Perry32 with adaptations was used. Tissue samples, stored at −20°C, were homogenized with 20% sodium hydroxide at 100°C, then ethanol was added in a 2:1 ratio to precipitate the glycogen. The microtubes were then centrifuged, the supernatant was discarded, and the pellet was resuspended in deionized water. In a microplate, the sample was mixed with sulfuric acid and 5% phenol, resulting in a yellowish product read at 498 nm.
Oxidative profile evaluation of the uterus, placenta and amniotic fluid
The fragments stored at −80°C were homogenized with an Ultraturrax homogenizer (Marconi, Piracicaba, Brazil) in phosphate-buffered saline (pH 7.2) and normalized to 1 mg of protein/mL according to the Bradford methodReference Bradford33. Samples from the amniotic fluid were also normalized to 1 mg of protein/mL. From these normalized samples, the concentration of thiobarbituric acid reactive substances (TBARS), carbonylated proteins (PCO), reduced glutathione (GSH), total glutathiones (GT), glutathione S-transferase (GST), catalase (CAT) and superoxide dismutase (SOD) was determined.
Lipid peroxidation. The concentration of TBARS was used to quantify lipid peroxidation, according to the method described by Federici et al.Reference Federici, Shaw and Handy34 TBARS levels were determined by the difference in absorbance at 535 and 572 nm (Multiskan GO, Thermo Scientific, Vantaa, Finland). Results were expressed as nanomoles of TBARS per milligram of protein.
Carbonylated proteins. For the quantification of carbonylated proteins, the method of Reznick and PackerReference Reznick and Packer35 with adaptations was used. Protein homogenates were normalized to 1 mg/mL. To this end, 300 µL of homogenized sample was added to two tubes: the blank, to which 500 µL of 2 M HCl was added, and the reaction tube, to which 500 µL of reaction medium containing 5,5’-dithiobis-(2-nitrobenzoic acid) (DTNB; 0.1982%) diluted in 2 M HCl was added. The reactions were incubated for 1 h with vigorous shaking every 15 min. After this period, 500 µL of trichloroacetic acid (TCA; 28%) was added to all tubes, and they were allowed to sit for 10 min to form a precipitate. The tubes were then centrifuged at 9000 g for 10 min, and the supernatant was discarded. The pellet was resuspended with 1 mL of ethanol and ethyl acetate solution (1:1), followed by centrifugation and discarding of the supernatant. This washing process was repeated twice more. Finally, 350 µL of aqueous guanidine hydrochloride solution (57.31%) was added to the tubes, which were shaken and incubated for 10 min. Lastly, 150 µL of the final solution was pipetted into a microplate, and absorbance was measured at 380 nm.
Glutathiones. The concentrations of GSH and GT were measured according to the method proposed by Rahman et al.Reference Rahman, Kode and Biswas36. The method is based on the reaction between DTNB and GSH, resulting in a yellow-colored product, whose absorbance is measured at 412 nm. The results were expressed in μmol/mg of protein.
For GT, the method is based on the reduction of oxidized glutathione (GSSG) in the sample by the addition of NADPH, in a reaction catalyzed by glutathione reductase (GR), which is also added to the reaction medium. Subsequently, the total glutathione, now reduced, is quantified by a reaction with DTNB, with absorbance measured at 412 nm. The results were expressed in μmol/mg of protein.
The concentration of GSSG was calculated according to Carrara et al.Reference Carrara, Melo and Bernardes37, considering the stoichiometry of the reaction. The GSSG values were calculated using equation number 7.
 $$GSSG\; = \;\left( {\left\{ {\left[ {GT} \right]} \right\} - \left[ {GSSG} \right]} \right)/2$$
The results were expressed in μmol/mg of protein.
GST enzyme activity was evaluated as proposed by Keen et al.Reference Keen, Habig and Jakoby38, spectrophotometrically through the reduction of GSH and the reaction with 1-chloro-2,4-dinitrobenzene (CDNB), resulting in thiol ester formation. The reaction absorbance was measured at 340 nm over 5 min at 40-s intervals. The results were expressed as μM of thiol ester formed per minute per mg of protein.
Catalase activity. Catalase activity was determined by the decomposition of H2O2 into H2O and O2. The absorbance of the reaction was measured at 240 nm for 1 min, with intervals of 15 ssReference Aebi39. Results were expressed as mM/minute/mg of protein.
Superoxide dismutase activity. The activity of the SOD enzyme was determined according to Senthilkumar et al.Reference Senthilkumar, Amaresan and Sankaranaranarayanan40 with adaptations by Erthal et al.Reference Erthal, Staurengo-Ferrari and Fattori24. The method is based on the quantification of complexes formed by O2•- with nitroblue tetrazolium (NBT) and hydroxylamine hydrochloride (NH2OH.HCl), which produce a bluish color. Absorbance was measured at 560 nm for 2 min at 15-s intervals. Results were expressed as SOD units/mg of protein.
Statistical analysis
The data obtained were subjected to the Brown–Forsythe and Shapiro–Wilk tests to analyze variance and homoscedasticity, respectively. When the assumptions of the tests were met, a one-way ANOVA was performed to evaluate the differences between treatments. When the assumptions were not met, the data were classified as non-parametric and subjected to the Kruskal–Wallis test. Differences between treatments were considered statistically significant when p < 0.05. In this case, post hoc Dunnet’s test were conducted following one-way ANOVA, or Dunn’s test following the Kruskal–Wallis test. Pairwise comparisons were made only between a exposed group (M10 or M50) and the control group. Data were expressed as mean ± S.E.M. when parametric, or median [Q1–Q3] when non-parametric.
Results
Due to false-positive pregnancy detections – defined as the presence of spermatozoa in the vaginal smear following mating without any implantation sites observed in the uterus during dissection – adjustments were made to the sample size. This occurred in one female from the control group and two from the M50 group. Only truly pregnant females were included in all analysis. The final group sizes were 11 animals in the control group, 12 in the M10 group, and 10 in the M50 group.
Exposure to low doses of malathion during the juvenile and pubertal periods advances puberty onset but does not affect fertility, body weight, or the weights of reproductive organs, liver, and kidneys in Wistar rats
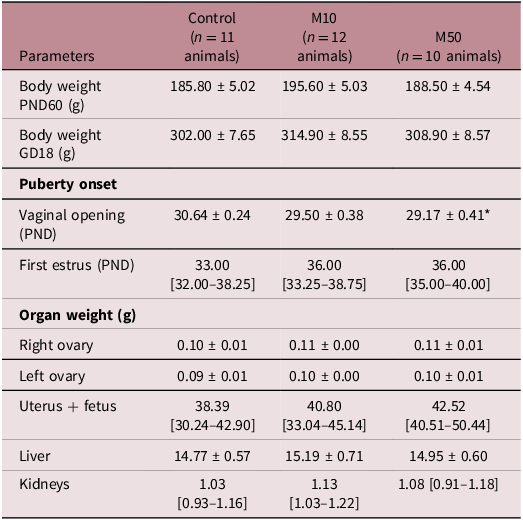
A one-day advancement in vaginal opening was observed in females from the M50 group compared to the control group (p = 0.0126). However, malathion exposure did not affect the timing of the first estrus. Data regarding puberty onset are presented in Table 1.
Biometric parameters of females exposed to low doses of malathion during the juvenile and pubertal periods

Table 1. Long description
The table presents biometric parameters of females exposed to low doses of malathion during the juvenile and pubertal periods. It includes data for three groups: Control with 11 animals, M10 with 12 animals, and M50 with 10 animals. The parameters measured include body weight at postnatal day 60 and gestational day 18, puberty onset indicators such as vaginal opening and first estrus, and organ weights for right ovary, left ovary, uterus plus fetus, liver, and kidneys. Notable trends include a one-day advancement in vaginal opening in the M50 group compared to the control group, while malathion exposure did not affect the timing of the first estrus. The table provides detailed values and standard deviations for each parameter across the groups.
Data expressed as mean ± S.E.M. or median [q1–q3]. One-way ANOVA or Kruskal–Wallis’ test followed by Dunnet’s or Dunn’s test, respectively. *p < 0.05.
Body weight, as well as the weights of reproductive organs, liver, and kidneys, as shown in Table 1, were not affected by malathion exposure during the juvenile and pubertal periods.
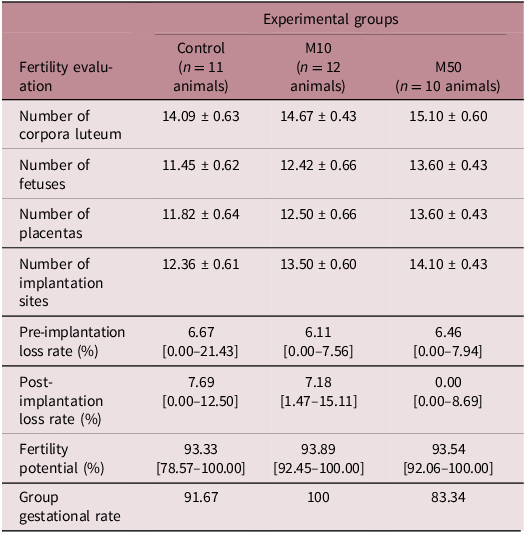
Rates of pre-and post-implantation losses – assessed based on the number of corpora lutea, implantation sites, and live fetuses – were also unaffected by malathion exposure during these developmental windows. Furthermore, no significant differences were observed in fertility potential or gestational rates among the experimental groups. These data are presented in Table 2.
Evaluation of fertility in females exposed to low doses of malathion during the juvenile and pubertal periods

Table 2. Long description
The table presents fertility evaluation metrics for three groups of animals: control, M10, and M50. It includes data on the number of corpora luteum, fetuses, placentas, and implantation sites, as well as pre-implantation and post-implantation loss rates, fertility potential, and group gestational rates. The control group has 11 animals, M10 has 12, and M50 has 10. The M50 group shows the highest values in most categories, such as the number of corpora luteum at 15.10, fetuses at 13.60, placentas at 13.60, and implantation sites at 14.10. The pre-implantation loss rate is lowest in the M10 group at 6.11 percentage, while the post-implantation loss rate is zero in the M50 group. Fertility potential is highest in the M10 group at 93.89 percentage, and the group gestational rate is 100 percentage in the M10 group. The data indicate no significant differences in fertility potential or gestational rates among the groups.
Data expressed as mean ± S.E.M. or median [q1–q3]. One-way ANOVA or Kruskal–Wallis’ test. The number of placentas also comprehends the number of non-functional placentas found in late post-implantation losses. The number of fetuses comprehends only the number of live fetuses at GD18.
Pre-conception exposure to low doses of malathion does not affect serum estradiol and progesterone levels but increases serum urea levels in pregnant rats
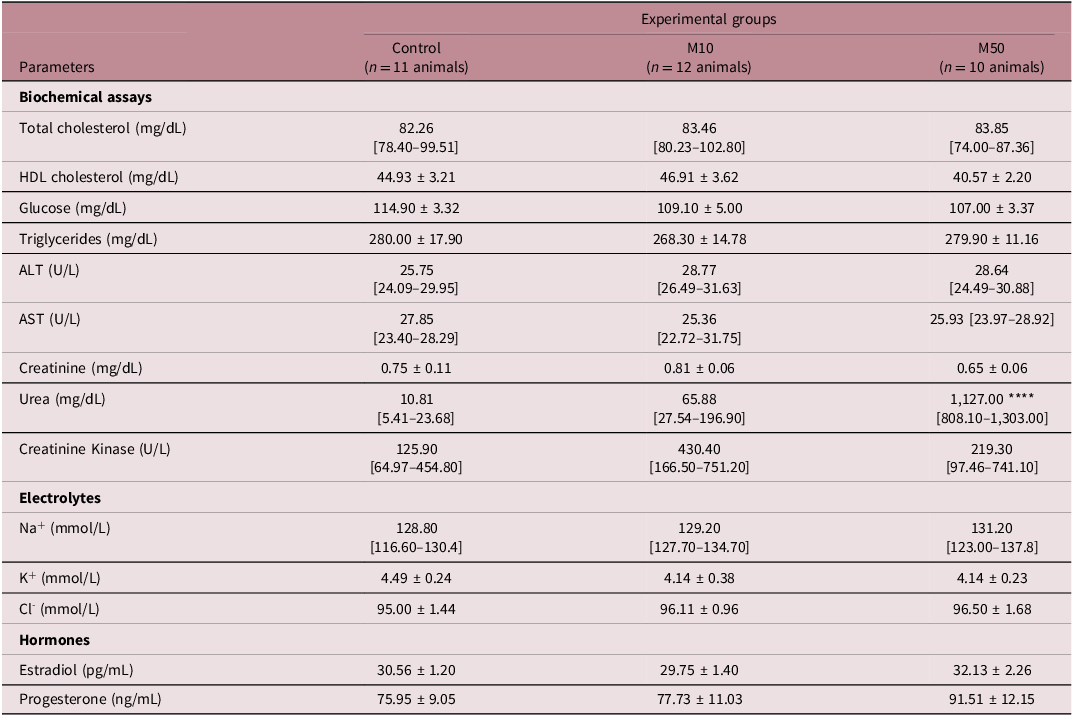
Serum concentrations of estrogen and progesterone were not affected by pre-conception exposure to malathion. However, a significant increase – approximately 100-fold – in serum urea levels was observed in the M50 group compared to the control. No statistically significant differences were found among the experimental groups for the other biochemical parameters assessed. These data are presented in Table 3.
Biochemical parameters, hormonal levels, and electrolyte concentrations in the serum of females exposed to low doses of malathion during the juvenile and pubertal periods

Table 3. Long description
The table presents data on biochemical parameters, hormonal levels, and electrolyte concentrations in the serum of females exposed to low doses of malathion during the juvenile and pubertal periods. It includes three experimental groups: Control with 11 animals, M10 with 12 animals, and M50 with 10 animals. The biochemical assays section lists parameters such as total cholesterol, HDL cholesterol, glucose, triglycerides, ALT, AST, creatinine, urea, and creatinine kinase. The electrolytes section includes sodium, potassium, and chloride levels. The hormones section lists estradiol and progesterone levels. Notable trends include a significant increase in serum urea levels in the M50 group compared to the control group, while other parameters show no statistically significant differences among the groups.
Data expressed as mean ± S.E.M. or median [q1–q3]. One-way ANOVA or Kruskal–Wallis’ test followed by Dunnet’s or Dunn’s test, respectively. ****p < 0.0001.
Exposure to malathion at the highest dose led to a slight increase in sodium ion concentration in the amniotic fluid of the offspring compared to the control group, although statistically significant, there is no biological significancy to this increase. No statistically significant differences were observed among the experimental groups for the other parameters evaluated, including total proteins, urea, alkaline phosphatase, lactate, total glucose, total calcium, potassium, and chloride. These results are shown in Fig. 2.
Biochemical parameters and electrolyte concentrations in the amniotic fluid of fetuses from dams pre-conceptionally exposed to low doses of malathion during the juvenile and pubertal periods, assessed on gestational day 18 (GD18). a, e, f, h and i Data expressed as median [Q1–Q3]. Analyzed using Kruskal–Wallis test followed by Dunn’s post hoc test. b, c, d and g Data expressed as mean ± SEM. Analyzed using one-way ANOVA followed by Dunnett’s post hoc test. C n = 11 animals; M10 n = 12 animals; M50 n = 10 animals.

Figure 2. Long description
The bar graph compares various biochemical parameters and electrolyte concentrations in the amniotic fluid of fetuses from dams exposed to different doses of malathion. The x-axis represents three groups: control (C), low dose (M10), and high dose (M50). The y-axis measures different parameters in various units. The parameters include total proteins, glucose, alkaline phosphatase, lactate, urea, total calcium, sodium, potassium, and chloride. Each bar represents the mean or median value with error bars indicating standard error of the mean or interquartile range. The data are analyzed using Kruskal-Wallis test followed by Dunn’s post hoc test for some parameters and one-way ANOVA followed by Dunnett’s post hoc test for others. The number of animals in each group is 11 for control, 12 for M10, and 10 for M50. The graph shows no significant differences in most parameters between the groups, with p-values indicating non-significance. All values are approximated.
Regarding the oxidative profile (Fig. 3), pre-conceptional exposure to malathion did not affect markers of oxidative damage or antioxidant parameters in the amniotic fluid.
Oxidative profile of the amniotic fluid from fetuses whose mothers were exposed to low doses of malathion during the juvenile and pubertal periods. a and g Data expressed as mean ± SEM. One-way ANOVA followed by Dunnett’s test. b, c, d, e and f Data expressed as median [Q1–Q3]. Kruskal–Wallis test followed by Dunn’s post hoc test. C n = 11 animals; M10 n = 12 animals; M50 n = 10 animals.

Figure 3. Long description
The image contains seven graphs depicting the oxidative profile of amniotic fluid from fetuses whose mothers were exposed to low doses of malathion during the juvenile and pubertal periods. The graphs include one vertical bar graph and six scatter plots. The bar graph shows TBARS concentration in nanomoles per milligram of protein, with three groups labeled C, M10, and M50. The scatter plots display various oxidative stress markers: catalase activity, superoxide dismutase activity, total glutathione, reduced glutathione, oxidized glutathione, and glutathione S-transferase activity. Each scatter plot compares these markers across the same three groups. The bar graph indicates higher TBARS concentration in the M10 and M50 groups compared to the control group C. The scatter plots show variations in oxidative stress markers among the groups, with some markers like catalase activity and glutathione S-transferase activity showing higher values in the M50 group. The data are expressed as mean ± SEM for the bar graph and as median [Q1–Q3] for the scatter plots. Statistical tests used include one-way ANOVA followed by Dunnett’s test for the bar graph and Kruskal-Wallis test followed by Dunn’s post hoc test for the scatter plots. The sample sizes are C n = 11 animals, M10 n = 12 animals, and M50 n = 10 animals. All values are approximated.
Pre-conception exposure during the juvenile and pubertal periods to low doses of malathion does not induce oxidative stress in the uterus of pregnant Wistar rats at GD18
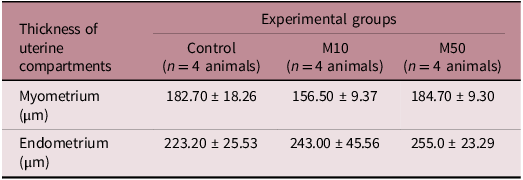
Exposure to malathion did not alter the thickness of both uterine compartments measured. Uterine morphometry data are presented in Table 4.
Uterine morphometrical evaluation of pregnant female Wistar rats exposed to low doses of malathion during the juvenile and pubertal periods

Table 4. Long description
The table presents uterine morphometrical evaluation of pregnant female Wistar rats exposed to low doses of malathion during the juvenile and pubertal periods. It consists of three columns and three rows. The columns are labeled as Control, M10, and M50, each representing different experimental groups with four animals each. The rows indicate the thickness of uterine compartments measured in micrometers for the myometrium and endometrium. The data shows the mean thickness values with standard deviations for each group. The myometrium thickness values are 182.70 ± 18.26 micrometers for the control group, 156.50 ± 9.37 micrometers for the M10 group, and 184.70 ± 9.30 micrometers for the M50 group. The endometrium thickness values are 223.20 ± 25.53 micrometers for the control group, 243.00 ± 45.56 micrometers for the M10 group, and 255.0 ± 23.29 micrometers for the M50 group. The table indicates that exposure to malathion did not significantly alter the thickness of both uterine compartments measured.
Data expressed as mean ± S.E.M.
Regarding the uterine oxidative profile, shown in Fig. 4, exposure to malathion caused an increase in CAT enzyme activity in the uteri of females in the M10 group. There were no significant differences between the experimental groups in the other oxidative profile parameters assessed in this organ.
Uterine oxidative profile of pregnant females pre-conceptionally exposed to malathion during the juvenile and pubertal periods. a, c, d, f and g Data expressed as mean ± SEM. One-way ANOVA followed by Dunnett’s test. b, e and h Data expressed as median [Q1–Q3]. Kruskal–Wallis test followed by Dunn’s post hoc test.C n = 11 animals; M10 n = 12 animals; M50 n = 10 animals.

Figure 4. Long description
The bar graph compares the uterine oxidative profile of pregnant females pre-conceptionally exposed to malathion during the juvenile and pubertal periods. The graph features eight panels labeled a through h, each representing different oxidative stress markers. The x-axis in each panel categorizes the data into three groups: C, M10, and M50, representing control, low-dose malathion, and high-dose malathion exposure, respectively. The y-axis measures various oxidative stress indicators. Panel a shows TBARS concentration in nanomoles per milligram of protein, with bars indicating mean values and error bars representing standard error of the mean. Panel b displays carbonyl proteins in nanomoles per milligram of protein, with data points showing individual values and median lines. Panel c illustrates superoxide dismutase activity in SOD units per milligram of protein. Panel d presents catalase activity in CAT millimoles per minute per milligram of protein, highlighting a significant difference with a p-value of 0.0305. Panel e shows total glutathione in micrograms per milligram of protein. Panel f depicts glutathione S-transferase activity in micromoles per minute per milligram of protein. Panel g indicates reduced glutathione in micrograms per milligram of protein. Panel h shows oxidized glutathione in micrograms per milligram of protein. The color scheme uses different shades of green to represent the control and malathion exposure groups. All values are approximated.
Pre-conception exposure to low doses of malathion compromises placental function and offspring intrauterine growth in Wistar rats, associated with depletion of glycogen reserves and placental oxidative stress
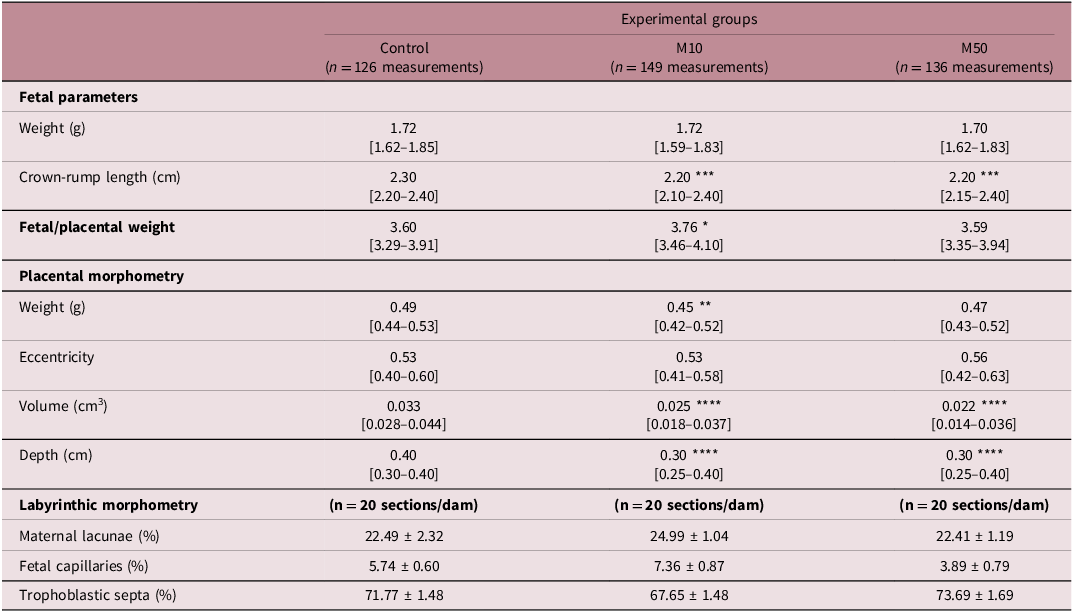
The fetal biometric data are presented in Table 5. Although fetal weight was not affected, there was a reduction in crown-rump length (CRL) in fetuses exposed to either dose of malathion compared to the control group. Placental weight was reduced only in the M10 group, and the volume and depth of this organ were decreased in both groups that received malathion, in comparison to the control group. However, the proportion of the area occupied by maternal lacunae, fetal capillaries, and trophoblastic septa was not affected by malathion exposure. Exposure to malathion at the lower dose increased the fetal/placental weight ratio in M10, compared to the control group. These data are presented in Table 5. Additionally, we observed a reduction in glycogen reserves in the placentas of the M10 group and an increase in the fetal capillary diameter was observed in the labyrinth of M10 placentas (Fig. 5).
Reduction of placental glycogen reserves in females Wistar rats exposed to low doses of malathion during peripuberty a and b Glycogen reserves preserved in the control group individuals; b Glycogenic cell island at higher magnification, showing the presence of cytoplasmic glycogen granules marked with PAS; c Impairment in placental glycogen reserve after pre-conceptional exposure to 10 mg/kg malathion; d Placental glycogen reserve preserved after pre-conceptional exposure to 50 mg/kg malathion; e Biochemical quantification of glycogen in placentas. Data expressed as median [q1–q3]. Kruskal–Wallis’ test followed by Dunn’s test; C n = 10 animals; M10 n = 12 animals; M50 n = 11 animals; g.c. Glycogen cells; The scale (white line in the right inferior corner) is of 100 µm in all photomicrographs.

Figure 5. Long description
The image contains four microscopic photomicrographs and two bar graphs. The photomicrographs show placental glycogen cells in Wistar rats under different conditions. Image A shows preserved glycogen reserves in the control group, while image B shows a higher magnification of a glycogenic cell island with cytoplasmic glycogen granules marked with PAS. Image C shows impaired placental glycogen reserves after exposure to 10 milligrams per kilogram of malathion, and image D shows preserved placental glycogen reserves after exposure to 50 milligrams per kilogram of malathion. Each photomicrograph includes a scale bar of 100 micrometers. The first bar graph (E) displays the biochemical quantification of glycogen in placentas, with data expressed as median [q1–q3]. The second bar graph (F) shows the capillary diameter in micrometers. Both graphs include statistical significance values (P values) indicating the differences between the control group (C), the group exposed to 10 milligrams per kilogram of malathion (M10), and the group exposed to 50 milligrams per kilogram of malathion (M50).
Fetal biometrical and placental morphometrical data of pregnant female Wistar rats, exposed to malathion pre-conceptionally during the juvenile and pubertal periods, at GD 18

Table 5. Long description
The table presents fetal biometric and placental morphometric data of pregnant female Wistar rats exposed to malathion pre-conceptionally during the juvenile and pubertal periods at gestational day 18. The table has four main sections: Fetal parameters, Placental morphometry, Labyrinthic morphometry, and includes measurements for Control, M10, and M50 experimental groups. Fetal parameters include weight, crown-rump length, and fetal/placental weight. Placental morphometry includes weight, eccentricity, volume, and depth. Labyrinthic morphometry includes the proportion of the area occupied by maternal lacunae, fetal capillaries, and trophoblastic septa. The table shows that fetal weight was not affected, but crown-rump length was reduced in fetuses exposed to either dose of malathion compared to the control group. Placental weight was reduced only in the M10 group, and the volume and depth of the placenta were decreased in both malathion-exposed groups. The proportion of the area occupied by maternal lacunae, fetal capillaries, and trophoblastic septa was not affected by malathion exposure. Exposure to malathion at the lower dose increased the fetal/placental weight ratio in the M10 group compared to the control group.
Data expressed as mean ± S.E.M. or median [q1–q3]. One-way ANOVA or Kruskal–Wallis’ test followed by Dunnet’s or Dunn’s test, respectively. *p < 0.05; **p < 0.01; ***p < 0.001; ****p < 0.0001.
Regarding the oxidative profile in the placentas, an increase in TBARS levels was observed in the M50 group, a decrease in GST activity and an increase in SOD activity in M10, and a decrease in GT and GSSG levels in animals exposed to either dose of malathion compared to the control group. However, there were no significant differences in PCO and GSH levels and CAT enzyme activity between the experimental groups. The oxidative profile of the placentas is presented in Fig. 6.
Placental oxidative profile following pre-conceptional exposure to low doses of malathion during the juvenile and pubertal periods. a, c, d, e, f and g Data expressed as mean ± SEM; analyzed using one-way ANOVA followed by Dunnett’s test. b and h Data expressed as median [Q1–Q3]; analyzed using Kruskal–Wallis test followed by Dunn’s post hoc test. C n = 11 animals; M10 n = 12 animals; M50 n = 10 animals.

Figure 6. Long description
The bar graph compares the placental oxidative profile following pre-conceptional exposure to low doses of malathion during the juvenile and pubertal periods. The x-axis represents different groups: C, M10, and M50, while the y-axis measures various oxidative stress markers. There are six sets of vertical bars, each representing different oxidative stress markers: TBARS concentration, carbonyl proteins, superoxide dismutase activity, catalase activity, total glutathione, and glutathione S-transferase. Each bar is color-coded: light green for C, medium green for M10, and dark green for M50. The graph includes error bars indicating standard error of the mean (SEM) for most markers and interquartile ranges for others. Notable trends include significant differences in TBARS concentration, superoxide dismutase activity, total glutathione, and oxidized glutathione levels among the groups. All values are approximated.
Discussion
In this study, we demonstrated that pre-conception exposure to low doses of malathion during the juvenile and pubertal periods impairs placental function and intrauterine development of the offspring, despite not altering the fertility of Wistar rats.
The placenta is the maternal-fetal organ responsible for the nutritional supply to the developing embryo/fetus, composed by the decidua – a modified endometrium and where glycogen is stored during pregnancy; the labyrinth – where nutrient exchange take place; and the basal zone, a transitional region between the first two regions. Placental size has been used as an indicator of maternal influence and toxicity on fetal growth and development, as its function directly affects fetal weight, size, and circulationReference Beck, Calabrese, Slayton and Rudel41. Therefore, changes in placental size can be predictive of morphophysiological alterations in this organ. Thus, the reduction in placental volume and depth observed in this study indicates impairments in placental function after pre-conception exposure to low doses of malathion during the juvenile and pubertal periods.
Oxidative stress may be one of the mechanisms underlying the placental alterations and smaller offspring we observed, since placental oxidative stress has already been linked to intrauterine growth restriction in humansReference Mandò, De Palma and Stampalija42. Supporting our results, Durom et al.Reference Durom, Aneesha and Kumar43 also observed an imbalance in the oxidative profile in the placentas of rats exposed to ethion – another OP – in a dose of 3.43 mg/kg during the last 13 d of gestation, evidenced by increased lipid peroxidation and reduced CAT activity.
Glycogenic cells in the placenta are responsible for storing energy in the form of glycogen. Although their metabolic function is still unknown, the most accepted hypothesis is that this organ stores energy to be made available to the fetus in adverse situations to ensure normal developmentReference Coan, Vaughan and Sekita44. During rats’ gestation, the placental glycogen reserve increases, reaching its peak on GD 16, and from this day, the reserves are exponentially degradedReference Akison, Nitert, Clifton, Moritz and Simmons45. Concomitant with the degradation of placental glycogen, the period of greatest fetal growth occursReference Tunster, Watson, Fowden and Burton46. Waldron Lechner and Abdel-Rahman, in a study with adult Sprague Dawley rats with pre-conception exposure for 3 months, demonstrated that exposure to malathion at doses of 1 and 50 mg/kg did not alter the weight of the placentas or fetuses. However, more recent data have linked exposure to the insecticide malathion to the promotion of glycogenolysis in both the liverReference Rezg, Mornagui, Kamoun, El-Fazaa and Gharbi47 and skeletal muscleReference Pournourmohammadi, Farzami, Ostad, Azizi and Abdollahi48. Thus, the early degeneration of glycogen reserves observed in M10 also suggests a reprogramming favoring glycogenolysis in the placenta and/or an increased demand of nutrient from the fetus. In this context, the fetal-placental weight ratio, a parameter used to evaluate placental efficiency, was also altered in M10, also indicating placental insufficiency.
An increase in fetal capillary diameter observed without concomitant changes in the proportional area of placental compartment is consistent with a functional hemodynamic adaptation rather than structural vascular remodeling. According to Starling’s principles, capillary distension is primarily driven by elevations in capillary dilation and/or reduced venular outflow, leading to enhanced intraluminal pressure without expansion of the overall tissue compartmentReference Hall and Guyton49,Reference Michel and Curry50 . Given that capillaries lack smooth muscle, changes in diameter reflect passive responses to upstream and downstream vascular tone, often mediated by endothelial signaling pathways such as NO, which is highly active in the placentaReference Reynolds, Borowicz and Caton51,Reference Myatt and Cui52 . From a morphometric perspective, increases in capillary caliber may occur without altering relative compartmental areas due to redistribution within a spatially constrained labyrinthine structure – which has been documented in stereological analyses of the rat placentaReference Mayhew53. Also, such capillary dilation may represent an early compensatory mechanism to preserve fetoplacental exchange efficiency in response to altered hemodynamic or metabolic conditionsReference Burton and Fowden12.
Alterations in placental structure and metabolism are closely associated with impaired fetal growth, as the placenta plays a central role in regulating the transfer of nutrients, oxygen, and energy substrates to the developing fetus. Reductions in placental size and depth, together with disturbances in placental energy reserves, can limit substrate availability during critical periods of fetal development, thereby affecting longitudinal growth parameters such as CRLReference Coan, Vaughan and Sekita44,Reference Akison, Nitert, Clifton, Moritz and Simmons45 . Placental glycogen serves as an important temporary energy store that supports fetal growth during periods of high metabolic demand, and it’s premature depletion has been linked to altered fetal growth trajectoriesReference Tunster, Watson, Fowden and Burton46. Moreover, oxidative stress in placental tissues can impair trophoblast function and placental efficiency, further compromising fetal development even in the absence of marked changes in fetal weightReference Myatt and Cui52. Together, these mechanisms provide a plausible link between placental abnormalities and the reduced CRL observed in the offspring.
Based on the DOHaD – Developmental Origins of Health and Disease – concept, we believe that the reduction in CRL in the fetuses could be indicative of developmental reprogramming in these animals. Metabolic reprogramming refers to the process by which critical periods of development can durably program the organism’s functionReference Gluckman and Hanson54. In this context, it is important to note that the follicular ovarian reserve is established at birthReference Bruxel, da Silva and da Silva26, meaning that the oocytes that gave rise to the offspring evaluated here were directly exposed to malathion during their quiescent and maturation phases prior to conception. Such exposure may predispose the embryo-placental unit to altered metabolic regulation during gestation. Supporting this hypothesis, Bruxel and collaboratorsReference Bruxel, da Silva and da Silva26, in a model of pre-conception exposure to malathion at doses of 14 and 140 mg/kg for 21 to 25 d starting at 1 m.o., observed an imbalance in glucose metabolism in pregnant rats and their offspring. However, the plasma glucose levels of females exposed to the pesticide 120 min after the start of the glucose intolerance test were comparable to those of control animals. These findings suggest that subtle impairments in glucose handling – rather than sustained changes in basal glucose levels – may underlie developmental reprogramming. A limitation of the present study is that dynamic assessments of glucose homeostasis were not performed; therefore, although plasma and amniotic fluid glucose concentrations were unchanged, we cannot determine whether compensatory mechanisms were required to maintain normoglycemia following pre-conception malathion exposure. Alterations in maternal glucose metabolism can disrupt placental glycogen synthesis and turnover, as maternal glucose availability and insulin-sensitive pathways directly regulate glycogen storage in placental trophoblast cells, with premature glycogen depletion being associated with impaired placental efficiency and altered fetal growthReference Coan, Vaughan and Sekita44–Reference Tunster, Watson, Fowden and Burton46.
Cholinergic communication occurs in a paracrine and autocrine manner in the oocyte-cumulus oophores communication, being essential for the fine regulation of intracellular Ca2+ homeostasis, meiotic resumption and progression, and the acquisition of oocyte competence, integrating nuclear and cytoplasmic maturation and sustaining functional communication with cumulus cellsReference Wessler and Kirkpatrick55–Reference Swann and Yu58. This pathway depends on precise balance between local ACh synthesis and degradation, controlled by AChE, whose dysregulation may impair spindle organization, mitochondrial metabolism and early embryonic quality, with potential repercussions for developmental programming and the formation of extraembryonic tissues, such as the placentaReference Wessler and Kirkpatrick55,Reference Duranthon and Renard59 . These functions position the ovarian cholinergic system as a key modulator of oocyte competence and early developmental stability, particularly sensitive to environmental and toxicological interferenceReference Fleming, Watkins and Velazquez60. Although malathion and/or malaoxon levels were not measured in the present or previous exposure models from our group, AChE inhibition induced by malathion exposure may disrupt ovarian cholinergic signaling in exposed females, thereby directly influencing subsequent pregnancy outcomes through epigenetic modulation of the oocytes. Despite being arrested in meiotic prophase I, oocytes during the pubertal period exhibit a dynamic and epigenetically active chromatin organization, allowing them to undergo environmentally induced epigenetic modificationsReference De La Fuente61–Reference Smallwood and Kelsey63. In this context, it is plausible that malathion exposure during juvenile and puberty can promote epigenetic alterations in oocytes, potentially through disruption of regulatory pathways active during oocyte growth and maturationReference He, Zhang, Yang and Wang28, with potential persistence of these changes into the offspring.
Regarding the exacerbated urea levels in pregnant females in M50, we initially hypothesized the occurrence of rhabdomyolysis a condition characterized by skeletal muscle breakdown and leakage of intracellular components, for which OP exposure is a recognized risk factorReference Guis, Mattei, Cozzone and Bendahan64. However, this hypothesis was ruled out after evaluation of CK activity, the gold standard biomarker for rhabdomyolysis diagnosisReference de Almeida, Losi Francisco and Gamel Sallum65. Other causes for increased urea include dehydration, high protein consumption, disturbances in protein metabolism, and reduced renal or hepatic perfusionReference Rodwell, Rodwell, Bender, Botham, Kennely and Weil66. As no differences were observed in water or food intake between malathion exposed females and controls (Supplementary Fig 1), dehydration and excessive protein consumption were excluded. A limitation of our study is the absence of renal histological analysis; therefore, subtle kidney injury cannot be fully ruled out based solely on urea and creatinine measurements. With respect to hepatic involvement, unchanged AST and ALT indicate the absence of hepatocellular injury. Notably, increased urea levels following OP exposure have been reported in the absence of transaminase alterationsReference Gupta67, suggesting early mitochondrial dysfunction in the liver that may precede detectable increases in circulating AST and ALT levelsReference Pessayre and Fromenty68.
Regarding the uterine oxidative profile, the increased activity of the CAT enzyme in the uterus of pregnant females in the M10 group, not accompanied by oxidative damage (TBARS or PCO) or recruitment of the second-line antioxidant system (glutathione system), leads us to hypothesize an adaptative response to an earlier increase of ROS, thus maintaining oxidative homeostasis and preventing oxidative damage to this organ. Corroborating our results, a previous study published by our research group, using the same exposure period and doses of malathion, demonstrated an immediate increase in uterine antioxidant defense, mainly through the mobilization of first-line antioxidantsReference Erthal-Michelato, Frigoli, de Aquino, Punhagui-Umbelino, Scarano and Fernandes25. In the same previous study, however, we obtained conflicting results regarding the morphometric evaluation of the uteri of exposed females. In the immediate evaluation, we observed an increase in the myometrial thickness in M1024. In the present study, contrarily, we found no alterations to the morphometry of both uterine compartments analyzed. Our main hypothesis is that the hypertrophy found in an immediate evaluation is somehow reverted due to the adaptation of this muscle layer to pregnancy, in which the myometrium becomes very distended due to the growing of the fetuses in the uterine lumen.
Puberty onset in Wistar rats normally occurs between PND 30 and 37Reference Laffan, Posobiec, Uhl and Vidal69. Contrarily, in our previous study, we did not observe changes in the onset of puberty in females during malathion exposureReference Erthal-Michelato, Frigoli, de Aquino, Punhagui-Umbelino, Scarano and Fernandes25. However, in this study, with a larger sample size per experimental group, we observed a one-day advancement in vaginal opening in M50, compared to the control group, on PND 29. The advancement in puberty onset may indicate imbalances in the HPG axis during its establishmentReference Qiu, Sun, Sun, Wang, Fan and Yu70. In this context, a cohort study demonstrated a positive relationship between the early development of secondary sexual characteristics in girls and the presence of an OP insecticide metabolite in their plasmaReference Castiello, Suárez and Beneito71. According to BadrReference Zidan6, malathion is a known endocrine disruptor (EDC), including disturbances in the HPG axis. Despite this, we did not observe changes in the serum levels of estrogen and progesterone – at the time being produced by the placenta – following pre-conception exposure to the low doses used. This is corroborated by the previous study conducted by our group, where we showed malathion in this same dosages and exposure period did not impair estradiol levels in pubertal femalesReference Erthal, Staurengo-Ferrari and Fattori24. Although no alterations were found in hormonal dosages, several outcomes show opposite effects at 10 and 50 mg/kg, which is a known characteristic to EDCsReference Vandenberg, Colborn and Hayes72. Puberty advance may be reflection of an endocrine disruption occurring during this phase, due to malathion exposure, potentially predisposing females to altered reproductive and metabolic environments during gestation, indirectly contributing to placental and fetal outcomes.
The limitations of this study should be acknowledged. First, internal concentrations of malathion or its active metabolite, malaoxon, were not directly measured, which would have provided additional insight into internal exposure levels and dose–response relationships. Although this represents an important aspect of toxicological characterization, exposure was carefully controlled through daily oral gavage, ensuring accurate and reproducible dose administration. As no other sources of exposure were present in the experimental design, the observed effects can reasonably be attributed to the administered doses. Second, fertility-related outcomes were assessed using relatively small group sizes (n = 10–12), which may limit the statistical power to detect subtle or variable effects. While no statistically significant differences in fertility parameters were observed among the experimental groups, the absence of detectable impairment should therefore be interpreted with caution, and modest effects cannot be fully excluded. Studies with larger experimental numbers or specifically powered to evaluate reproductive success may be required to confirm these findings.
In the present study, the effects of pre-conception exposure to low doses of malathion in Wistar rats were investigated, highlighting its consequences on the offspring fetal development and maternal physiology. Malathion exposure resulted in intrauterine growth restriction, likely due to damage to placental function, evidenced by alterations in oxidative profile and glycogen reserves.
Conclusion
Based on this experimental model, we conclude that while low-dose malathion exposure during the juvenile and pubertal periods does not directly impair fertility, it does accelerate the onset of puberty in Wistar rats. Moreover, pre-conception exposure disrupts placental function through oxidative stress and early glycogen degradation, leading to impaired fetal growth. These results indicate that malathion compromises reproductive health when exposure occurs during the critical postnatal window of pubertal development. Our findings reinforce the idea that OP exposure can have lasting and multifaceted effects on reproductive health and fetal development of the offspring.
Supplementary material
The supplementary material for this article can be found at https://doi.org/10.1017/S2040174426100580.
Data availability statement
All data supporting the findings of this study are available within the paper and its Supplementary Information.
Acknowledgments
The authors are grateful to Professor Andrea Name Colado Simão, from the Center of Health Sciences (CCS), University Hospital, State University of Londrina, for her assistance with the estradiol dosage analysis. To Professor Katherinne Maria Spercoski, from the Biological Sciences Building, Federal University of Paraná, for the enriching and insightful discussions. To the Government of the State of Paraná, the Paraná State Council of Science and Technology, and the Secretariat of State for Science, Technology and Higher Education (budget allocation #4560.19.571.06.6153; e-protocol 21.234.745-0).
Funding statement
The authors are grateful to CAPES (Coordination for the Improvement of Higher Education Personnel) for granting a masters scholarship to G. F. Frigoli and for partial funding (Funding Code 001) and to CNPq (National Council for Scientific and Technological Development) process 313704/2021-0.
Competing interests
The authors declare no conflicts of interest. The authors have no financial or proprietary interests in any data and materials discussed in this article.
Ethical standard
The animal care and handling procedures were approved by the Animal Use Ethics Committee of the State University of Londrina (protocol CEUA/UEL number OF. CIRC. CEUA 019/2023).
ARRIVE Guidelines
The animal care and handling procedures complied with the Animal Research: Reporting of In Vivo Experiments Guidelines.